Running the Buyer Exchange Report
- Open the buyer exchange report.
- Create the report query.
- View the report output.
- Manage exchange report templates.
You can create a buyer exchange report to analyze your data usage and cost over a specific interval. For example, you can view the impressions and pixel calls for an audience delivery over a daily or monthly interval to evaluate the amount and cost of the data that the campaign is winning. After you configure your buyer exchange report, you can export it to a tab-separated value (TSV) file or run it in your web browser.
Note: The Buyer Exchange report may take ten minutes or more to complete.
Opening the buyer exchange report
To open the buyer exchange report:
-
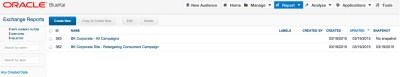
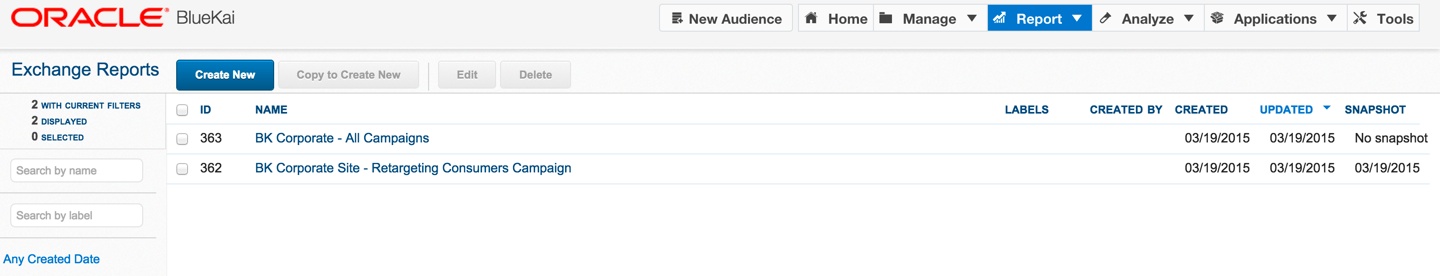
Select Report > Buyer Exchange. The Exchange Reports page lists all the exchange reports you have previously saved as templates. For details, see managing exchange report templates.
Creating the report query
The exchange report query specifies the range of dates for which you want to check data and the interval in which to list the results.
Note: You can select and view information in this report based on campaigns. Although users do not explicitly create campaigns in the platform UI, the system creates them automatically to manage data delivery. Each campaign has a unique ID.
To create the report query:
- Click Create New. The Exchange Report dialog is displayed.
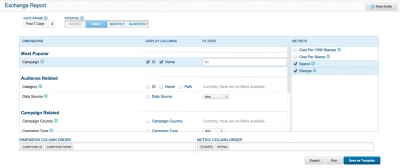
- Select the range of dates and the interval for your the report following these steps:
- In the Date Range list, select for which range of days or dates to report the exchange data. Select one of these date ranges:
- Yesterday
- Past 7 Days (default)
- Past 30 Days
- Custom Range: If you select this option, enter the start and end dates in the Date From and Date To boxes, or select them using the calendar.
- Under Interval, specify the time range used to display the data in the report. An interval represents a period of time in which the individual data records are summed and provided as a single result for the whole time. You can select the following intervals: Hourly, Daily, Monthly, or Quarterly. The interval that is the most appropriate for the Date Range specified in step 1 is selected by default. For example, if you select the Today or Yesterday date ranges, the default interval is Hourly; if you select the Past 7 Days, Past 30 Days, or Custom Range, the default is Daily.
- In the Date Range list, select for which range of days or dates to report the exchange data. Select one of these date ranges:
- Under Display Columns, select check boxes for dimensions to be added as columns in the report. To speed the report configuration process, the dimensions are logically grouped into the following categories: Most Popular, Audience Related, and Campaign Related. When you select a dimension, a tab for the dimension is added to Dimension Column Order at the bottom left. If filtering was applied to the dimension, its tab is highlighted green. Some dimensions include multiple check boxes for each format you want to include in the report, such as name, ID, or path. Dimensions that include a box under Filters can optionally be narrowed to a specific type. If you do not specify a filter, all the applicable data for that dimension is included in the report. You can add the following dimensions to your exchange report:
Dimension Description Campaign Select campaigns you used to purchase and target an audience. You can include the ID and name for each selected campaign. Category Displays the category in the target audience that is associated with the campaigns. You can include the ID, name, or path of the category. Data Source Select the data source used for the campaigns: - Any (default)
- Retargeted (first-party) data
- Prospecting (third-party) data
Target Country Displays he countries included in the audience Campaign Country Displays the countries targeted by the audience. Campaign Type Displays the campaign type: - Any (default)
- Internal
- Certified
Country Won The country code and name of the users won. Geolocation data is based on the IP addresses of online users and country locations specified for offline users. Current Status Displays the status of the campaigns: - Any (default)
- Active
- Idle
Max Bid Displays the maximum bid prices specified for the campaigns. Order Displays the name of the order associated with the campaign. The order specifies the total budget for one or more campaigns. Order Type Select the order type: - Any (default)
- Normal
- Time based
- Bulk
Pacing Goal Displays the pacing goal for the campaign in dollars ($) or impressions per time period format. The actual format depends on the pacing type used for the campaign. Pacing Type Displays the pacing type used for the campaign: - Any (default)
- No Restriction
- Budget Per Day
- Budget Per Campaign Lifetime
- Stamps Per Day
- Stamps Per Campaign Lifetime
- Cost Per 1000 impressions (CPM)
- Audience On
Pixel URL Displays the URL of the pixel used to trigger an ID swap or transfer the user with their category. - Select check boxes for the metrics you want to include as columns in your report. When you select a metric, a tab for the metric is added to the Metric Column Order box at the bottom right of the page.
If you include the cost per stamp or spend metrics in your report with an hourly interval, they will not return any data (they will display a series of zeroes).Metric Description Cost Per 1000 Stamps The average spend per 1,000 impressions (including finance-entered adjustments) Cost Per Stamp The average spend per stamp Spend The total cost of the campaign Stamps Number of times a user was sold with a category based on the campaign's target audience - After you select dimensions and metrics, you can change how their columns are ordered in the report. The dimensions and metrics are listed from left to right in the order in which you selected them. Drag its tab to the desired position within its respective Column Order box.
- Click Run to generate the report. Alternatively, you can:
- Click Export to generate and download the report as a tab-separated value (TSV) file.
- Click Save as Template to save the report and download it to a TSV file. Saving a report as a template stores the configuration, including date range, interval, dimensions, metrics, and column ordering so that you can run the report without having to recreate it. When you save a report as a template, a snapshot of the report is created each time you run it. You can view or download the snapshot to analyze the data as it existed when the snapshot was created.

Exporting the report
You can export an exchange report from the report query page or the output page.
To export an exchange report:
- Click Export.
- A new tab opens and the report is generated. A TSV file is then downloaded to your computer.
- Save the report.
- You can open and view the report using a spreadsheet or text application.
- Click Close to close the new tab that opened when you ran your report.
Saving the report as a template
You can save an exchange report as a template so that you can re-run the report whenever needed. When you save a report as a template, a snapshot of the report is created each time the report is run. You can view or download the snapshot to analyze the data as it existed when the snapshot was created. After you create a template, you can clone it to create new templates with varied configurations or different scheduling.
To save an exchange report as a template:
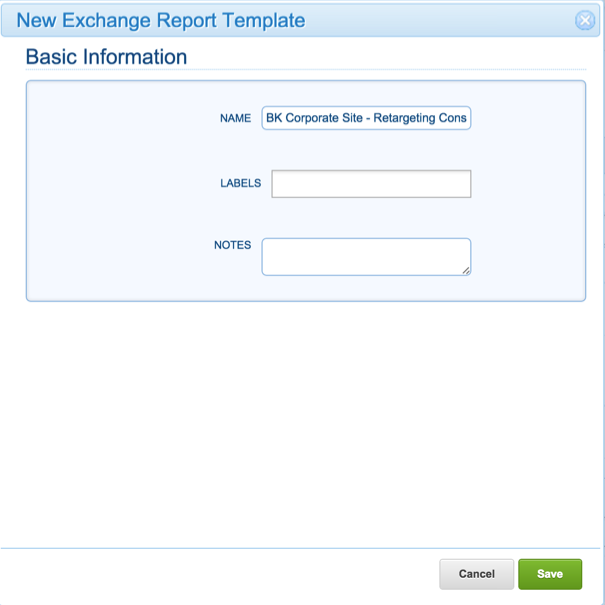
- Click Save as Template. The New Exchange Report Template dialog is displayed.
- In the Basic Information section, configure the following properties:
Property Description Name Enter a descriptive name for the template. Labels (Optional) Enter an alias name or nickname for the report that can be used to filter the exchange report templates. Notes (Optional) Enter a description, purpose, use case, instructions, or any other text to be associated with the exchange report. 
- Click Save. Your report is added to the main exchange report page. See managing exchange templates for more information on viewing, copying, and editing your templates.
Viewing the report output
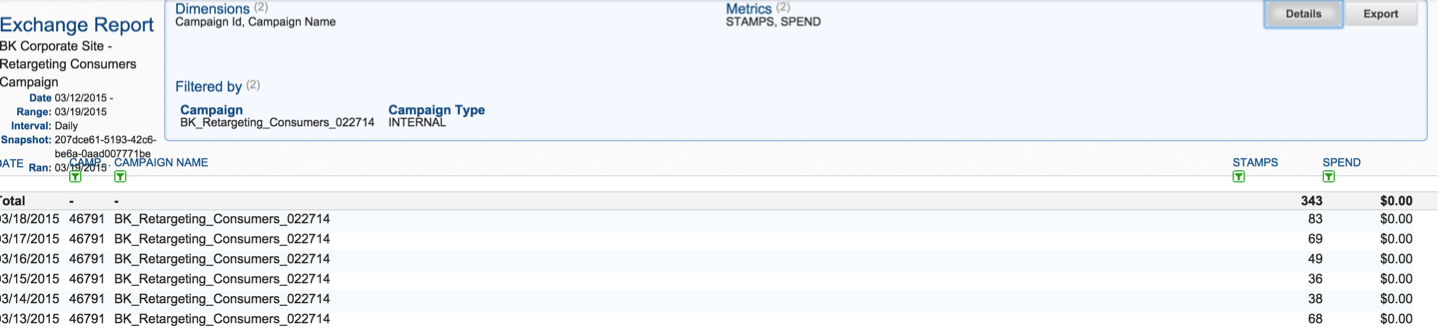
When you run an exchange report, the report opens in a new tab in your web browser. It includes a summary at the top and a table that lists the exchange data.
Viewing the report summary
The exchange report includes at a summary at the top that lists the dimensions selected in the report. You can click Details to view additional information such as the report name (if saved as a template), the selected date range and interval, the snapshot ID, the date the report was last run, and any labels associated with the report. In addition, the details includes the filters applied to the provider, site, and category dimensions. Click Export to export the exchange report to a TSV file.

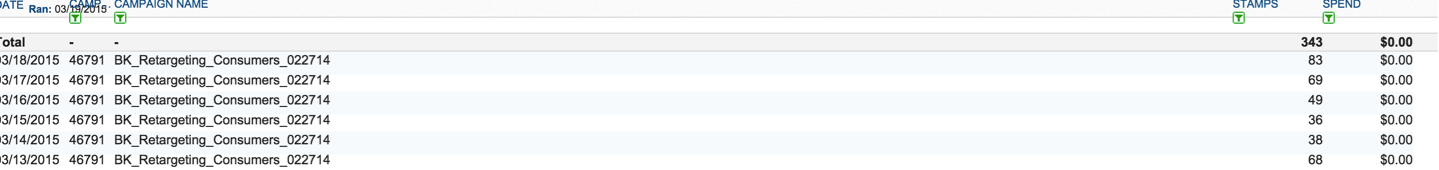
Viewing the report table
The bottom of the exchange report includes lists the exchange data and interval within the specified date range. The columns are listed in the order you specified in the report query.
To sort and filter the exchange data:
- Click the filter icon in a column. Each columns have sliders to adjust the value.
- To specify a specific value, click on the value at either end of the filter and then type the desired value.
- Click Apply to filter the data.
Managing exchange report templates
After you save an exchange report template, it is added to the list of templates in the exchange report index page. You can then view, copy, edit, and delete your templates.
Viewing templates
To view the exchange reports you saved as templates:
- (Optional) Sort the exchange report templates using one or more of the following column headers: ID, Name, Labels, Created By, Created, or Updated.
- (Optional) Filter exchange report templates using one or more of the following properties listed in the left sidebar:
- Name: Enter the name of the bookmarked report, and then press Enter.
- Created Date: Display only Exchange Report templates created in the Past Day, Past 7 Days, Past 30 Days, or for a Custom date range. To specify a Custom date range, click the From and To boxes and select the start and end dates from the calendar.
- Created By: Display only Exchange Report templates that are Created by Me or by Created by Any User.
Note: To clear the filter applied to a property, click the Any <property> option. To clear all the filters, click Reset Filters.
- To view a detailed summary of your exchange report template, click the template's Name. An exchange report template details page opens.
- The top of the page lists the template's status, ID, name, creation date, and last update. It then includes sections for the following properties:
Property Description Report columns This section lists the following properties: - Dimensions: The number and names of the dimensions included in the report
- Filtered by: The filtering used to includes the specified providers, sites, and categories in the report
- Metrics: The number and names of the metrics included in the report
Report snapshots The number of snapshots taken of the report. A snapshot is created each time the report is generated from the template. This section includes a timestamp and ID for each snapshot. Click View to open the snapshot of the exchange report. Click Download to export the report snapshot to a TSV file on your computer. Date range The range of days or dates for which exchange data is reported Interval The period of time over which the exchange data is summed and provided as a single result Labels The labels used for sorting and filtering this template Notes Any user-specified notes entered for this template - Click Run to manually generate the report. This also creates a snapshot.
- Click Copy to Create New to create a copy of the exchange report template. By default, the copy will have the same query as the original. You can modify the copy's date range, interval, dimensions, metrics as needed, and then create a new template and/or run the report.
- Click Edit to configure the basic information of the report.
- Click Back to return to the main exchange reports template page.
Copying templates
You can copy an exchange report template to create a new exchange report that has the same query as the template. You can then modify the copy's date range, interval, dimensions, metrics as needed, and then create a template for the copied report or run it. This is useful for quickly creating nuanced or specialized versions of an existing exchange report.
To copy a template:
- Select the check box for the template to be copied.
- Click Copy to Create New.
- Modify the report query, as needed.
- Export the exchange report to a TSV file, run the report in your web browser, or save it as a template.
Editing templates
To edit the basic information and schedule for an exchange report template:
- Select the check box for the template for you want to edit.
- Click Edit.
- In the Edit Exchange Report Template dialog, modify the template's name, label, and notes).
- Click Save.
Deleting templates
To permanently remove an exchange report template:
- Select the check box for the template for you want to delete.
- Click Delete.
- Click OK to confirm the deletion of the template.