Interface Usage and Response Data
The Activity Report presents the following information on user interface requests and response of the environment:
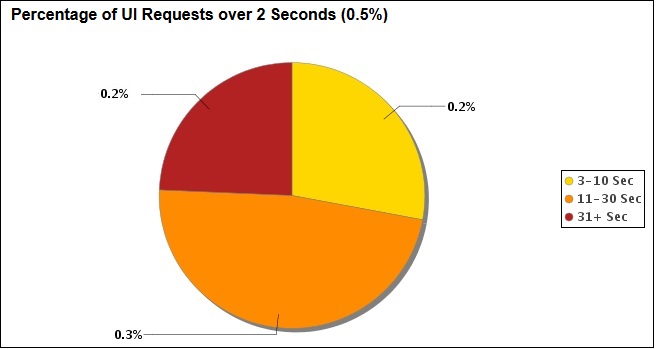
- Percentage of UI requests that took more than 2 seconds to finish.
A UI request is a user action such as signing in, loading data, opening or saving forms, and validating rules. The section on the top 30 longest running user actions identifies the user, duration of the action, the activity that the user was performing, and the screen that the user was on.
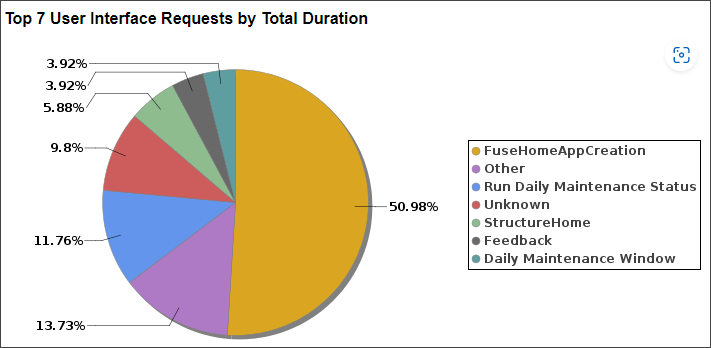
- Top 7 requests that took the most time to complete.
- Top 15 user interface requests that were executed most frequently.
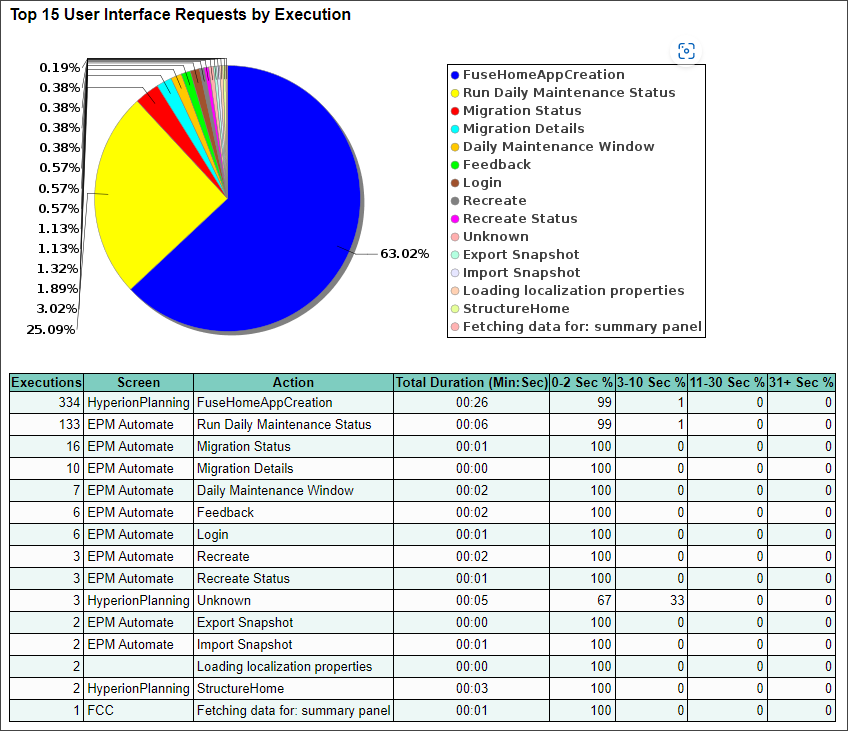
- Top 30 user interface actions that took more than 2 seconds to complete. By analyzing this data, you can identify optimizations that can improve performance.

- Average service response time every hour for the last 24 hours.
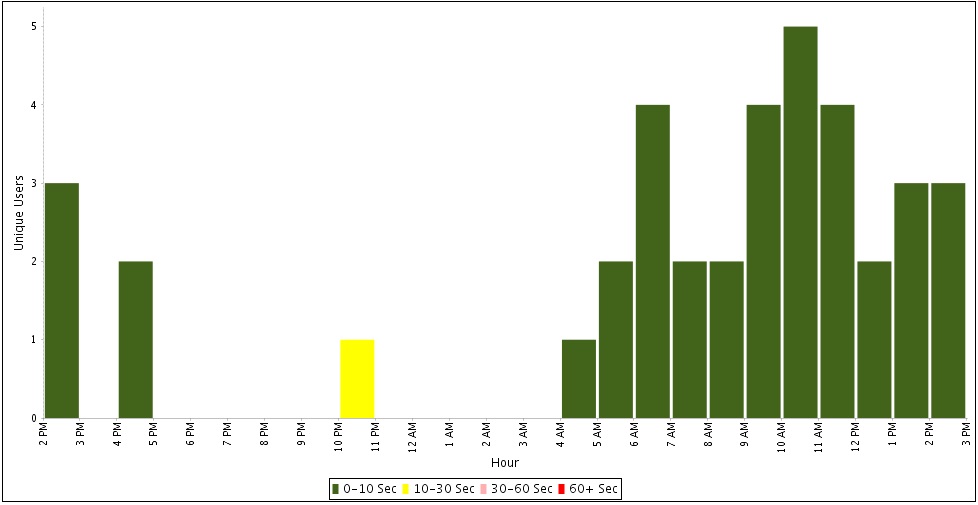
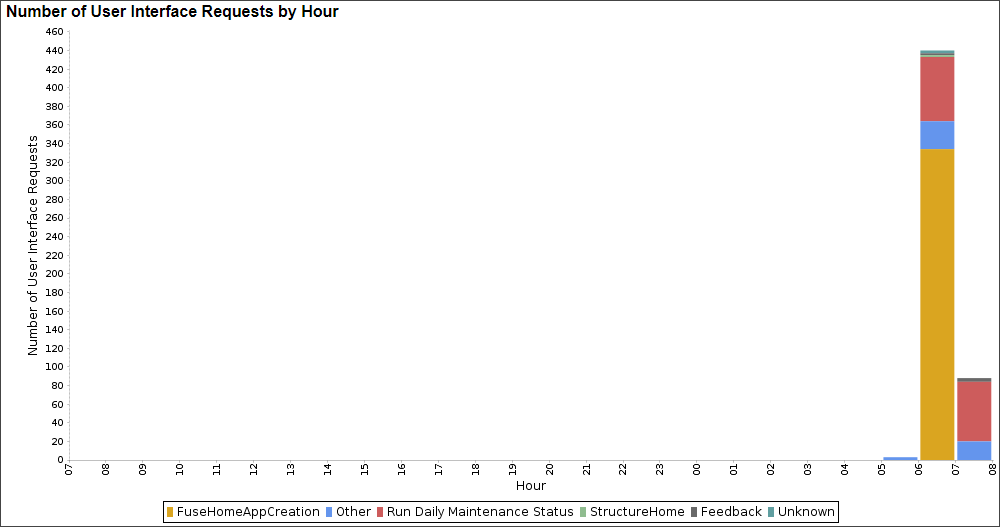
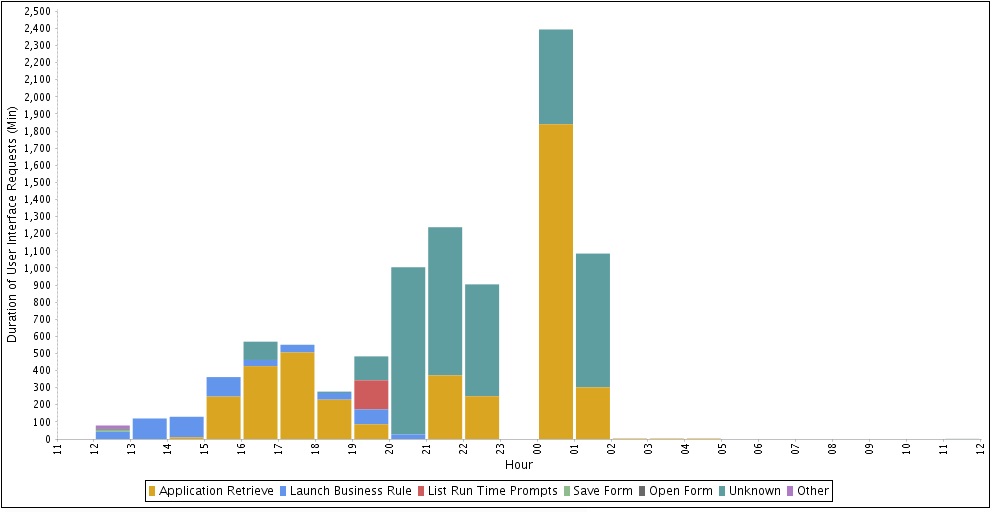
- Number and duration of interface requests each hour.
