Reports Design Considerations
As you design your report, here are some elements to consider.
Reports and Grid Data Limit
The Oracle Fusion Cloud Enterprise Performance Management data sources have a maximum number of cells that can be returned by a grid, this maximum also applies to forms and ad-hoc grids. The maximum number of cells may vary depending on the Cloud EPM business process. If this limit is reached when previewing the grid or report, you will receive this error: "Error executing query. The number of cells exceeds the maximum of <maximum amount>."
If the report results are too large to be rendered in the browser (HTML with a grid cell count limit of 180000 or PDF size limit of 10MB), users will be prompted to download the report as a PDF where you can either select OK to download or Cancel to exit the operation.
Chart Object's Data Set Limit
The maximum chart data set limit is 50 rows by 25 columns, or 1,250 values.
Using Expanded Versus Single Data Segments in Queries
A data segment is a row or column that retrieves data from a database. An expanded data segment is a row or column that can expand, so that the resulting grid expands to two or more rows or columns when viewed. Often, expanded data segments use functions such as Children Of or Descendants Of. A single data segment is a row or column that remains a single row or column when shown in the viewer.
While it is generally valid to use expanded and single data segments in the same grid, when designing a grid with large amounts of data, consider using expanded data segments rather than single data segments. Expanded data segments provide some performance advantages over single data segments; however, to produce detailed formatting on different data rows or columns, use single data segments.
Suppressing Missing Blocks
Note:
The ability to suppress missing blocks is available for Cloud EPM products only.
You can suppress missing blocks to improve performance when rows or columns contain sparse dimensions. When you suppress missing blocks, you can place large sparse dimensions in rows, while providing good response time if the density of the query is low. Only blocks with data are retrieved. For example, if you place an employee dimension consisting of thousands of members in rows, and place the entity in the page or POV, then only employees of the selected entity are retrieved.
Suppressing missing blocks aids in suppressing missing data when a large number of rows, such as 90% or more, is suppressed. However, choosing to suppress missing blocks when few or no rows contain missing blocks that would be suppressed can degrade performance. Also, certain suppressed blocks may ignore dynamic calculation members.
Renaming Dimensions and Members
If you rename the dimensions or members in a data source, you must manually update each report in Reports to reflect the changes.
Performance Considerations
-
Try to avoid writing relational-type reports
-
A good indication of relational-type report is one with multiple row dimensions that are expanded using member selection functions such as Descendants or Bottom Level which return a large number of members.
-
Large reports may take a significant amount of time to execute. A report is considered big when the number of cells starts getting into the tens of thousands.
-
Reports should not be used as a large-scale data extraction tool.
-
-
While dynamic calculation storage on sparse dimension parents in BSO cube data sources will improve calculation and aggregation performance, it can adversely affect retrieval performance, especially when used with multiple dimensions. If you have these storage settings implemented at the data source level and you are experiencing slower report retrieval times, it is recommended to revisit your usage of these storage settings.
-
Inserting a larger number of grids in a report, where each grid is medium to large sized, may result in slower report retrieval performance. It is recommended to split a report with multiple larger grids across multiple reports.
Other Design Considerations
When designing reports:
-
Use expanded data segments for optimal performance:
-
Use functions on expanded data segments that are not placed on separate rows or columns.
-
Use multiple member selections on expanded data segments that are not placed in separate rows or columns.
-
Use single data segments only when required for formatting or calculations.
-
-
Write efficient formulas:
-
Use row or column formulas rather than cell formulas, when possible.
-
Use reference properties.
-
Use a cell reference instead of cross-axis references.
-
Remove unnecessary parenthesis from formulas.
-
-
Do not limit your report to the Grid object:
-
Add functions in text boxes that highlight specific areas.
-
Hide a grid of data in a report to highlight just the graphics.
-
Alias Table Names and Reserved Words
In Cloud EPM Platform data sources, if an alias table name is the same name as an internally used member property reserved word, such as "Name", "Custom", or "DESCRIPTION", aliases will not be returned in the Reports grid result. To resolve this issue, rename the Alias to something more unique.
Rounding and Footing in a Report
Overview
When displaying data values in a Report grid, where the data values are displayed as scaled (For example, 173,545,723 scaled in "thousands" is rounded and displayed as 173,546), may result in the scaled balance detail not footing to rounded subtotals and totals within the report. The grid design can be modified to correct any footing differences caused by the rounded values by using a row or column formula to determine the difference and include it in a "plug" amount.
This topic provides an example of the updates needed to a simple grid displaying scaled and rounded Current Assets rolling into a Total Current Assets member. The example uses the Narrative Reporting Sample Application.
Problems in Reports
Note the following grid design, where the individual Current Assets and Total Current Assets are selected in separate rows.
-
The first column has the original, or unscaled data values for Q2.
-
The second column is scaled by "thousands" in cell formatting for Q2.
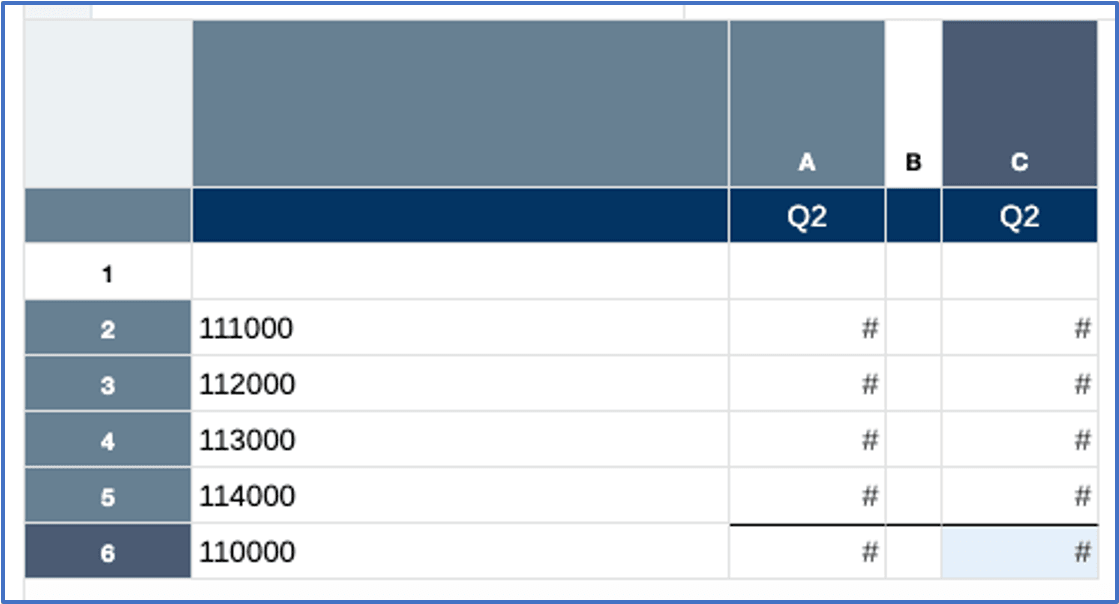
Here is the grid preview, note the scaled values in the second column. Also, note that the second column values sum to 904,569, which results in a scaled variance of "1" from the scaled total displayed of 904,570.

Solution for Reports
The solution is to create a formula row in the grid to calculate the variance and apply the variance as a "plug" amount to one of the existing accounts in the rows (Prepaid Expenses in our example). A row formula for the plug amount will replace the Prepaid Expenses data row, which will be hidden from the display.
The Report grid formulas utilize the underlying unscaled data values, and not the displayed scaled values (for example, 173,545,723 unscaled in the first cell vs 173,546 scaled by thousands), the data values will need to have rounding applied via a formula column before applying the row formula for the plug amount. The original data column will be hidden from the display.
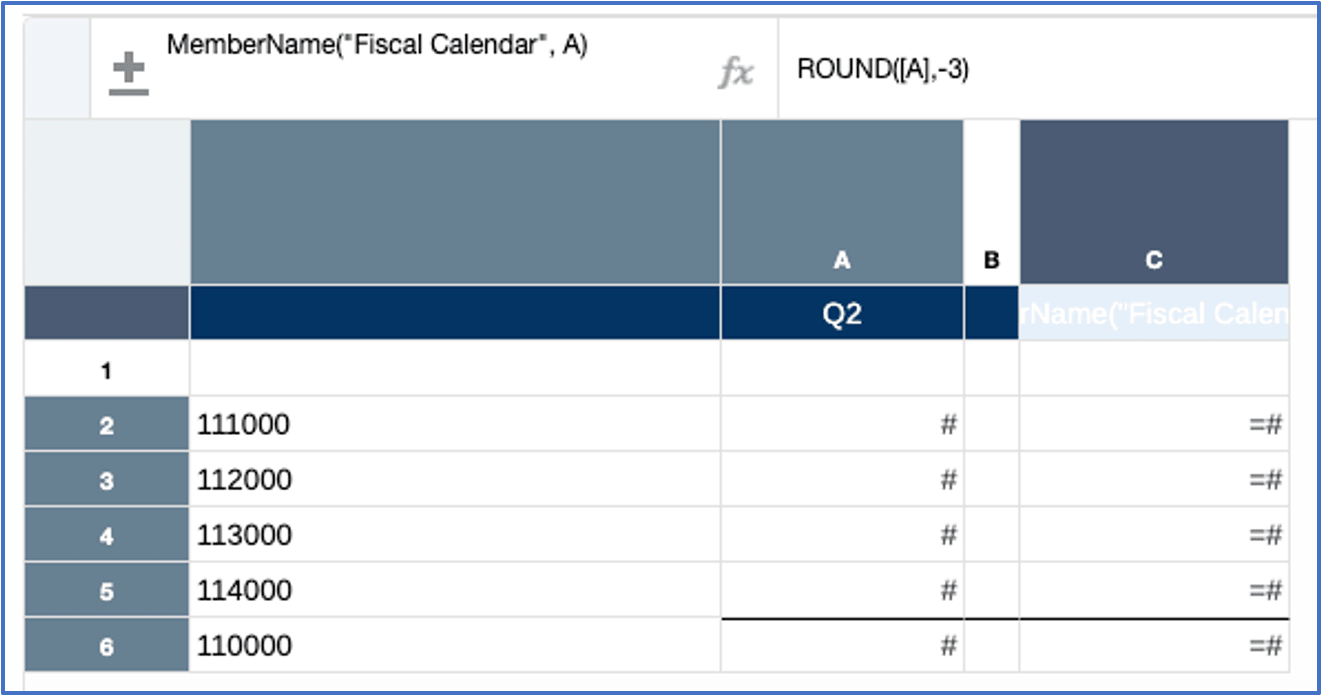
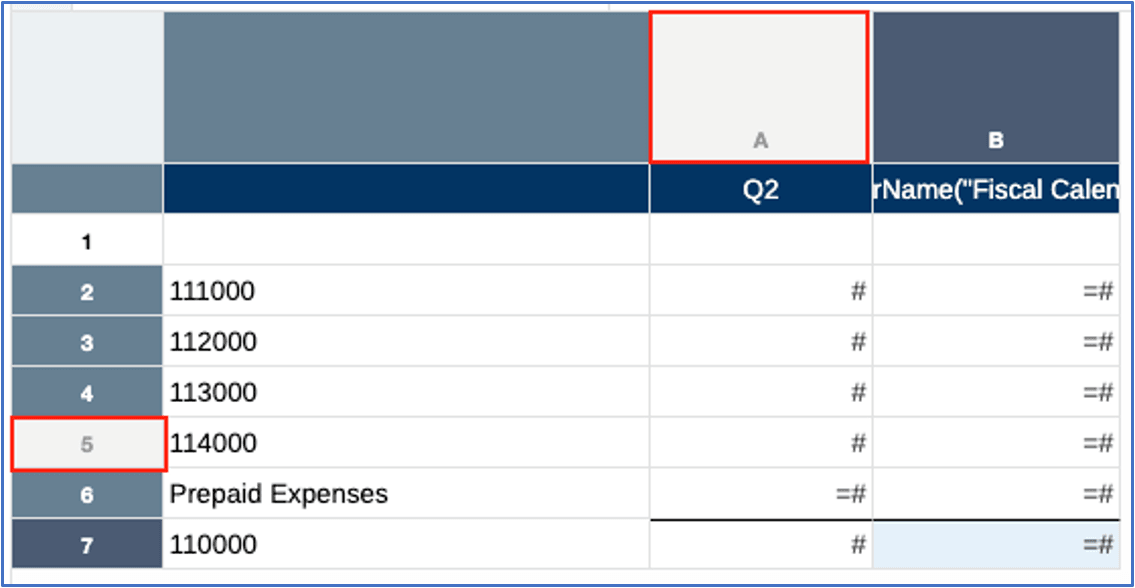
Note that in the modified design below, where the first column still contains the unscaled data values, the second column is a formula column that rounds the values in the data column by three digits using the following column formula: ROUND([A],-3). Also, note that a text function is used in the formula column to display the member name from the first data column.
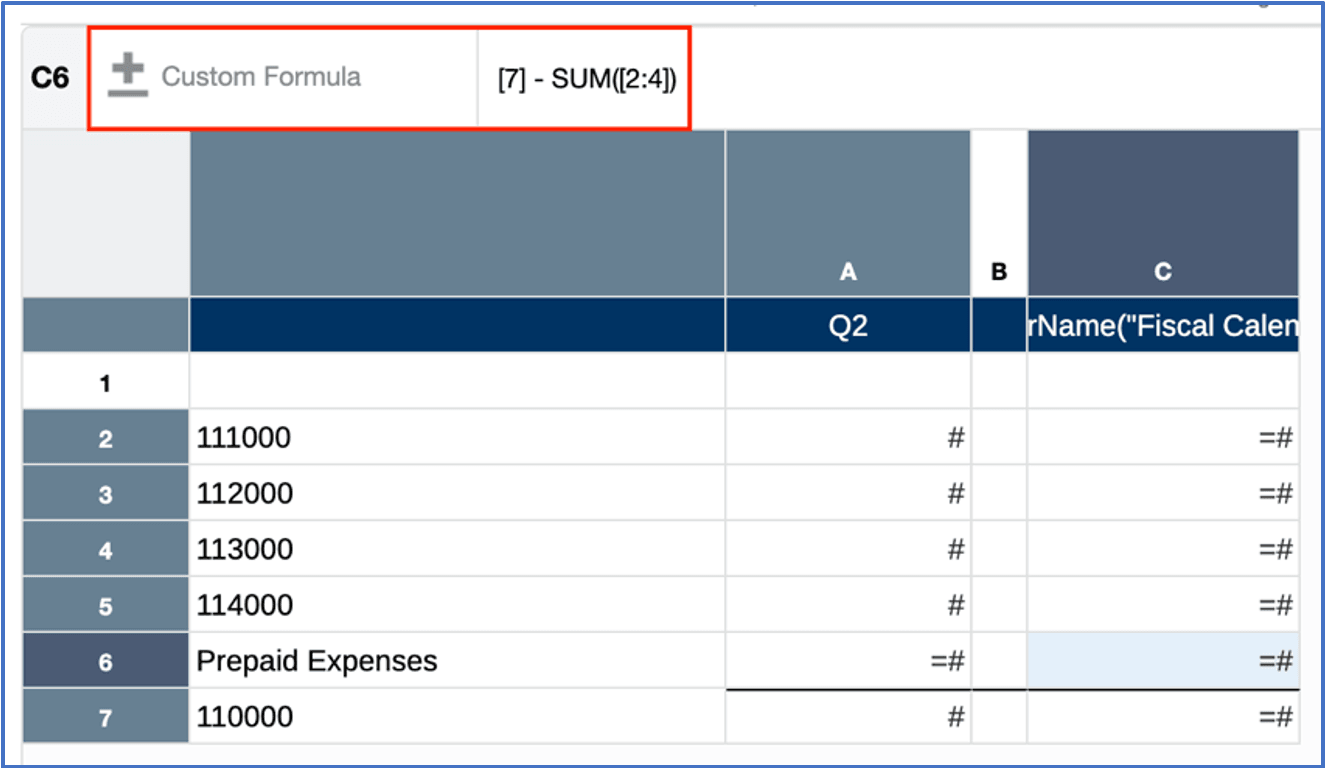
A formula row was inserted right below the Prepaid Expenses data row (member name 114000) which takes the difference between the Total Current Assets member (110000) and the sum of the Current Assets accounts, except for the Prepaid Expenses data value in row 5: [7] - SUM([2:4]). A "Custom" formula was used, which applies the formula only to the selected cell, not an entire column or row.
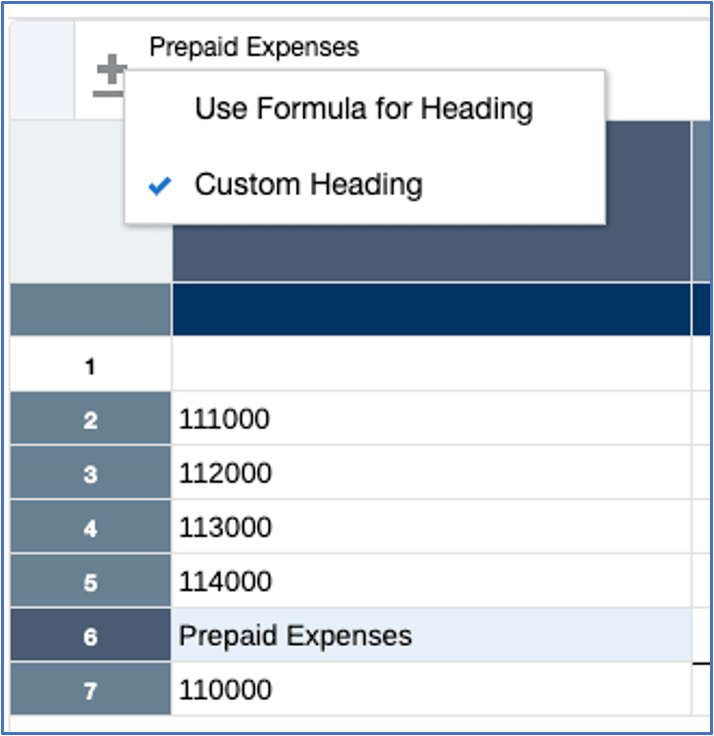
Also, a Custom Heading of "Prepaid Expenses" was specified for the formula row header:
Next, Column A and row 5 are hidden from display:
In the grid preview, note that the original variance of "1" is plugged into the original Prepaid Expenses value of 124,569, resulting in the value of 124,570, which now correctly foots into the Total Current Assets amount:
