Introduction to Grouping
Grouping provides the ability to calculate, group and format nested dimensions in a row or column data segment.
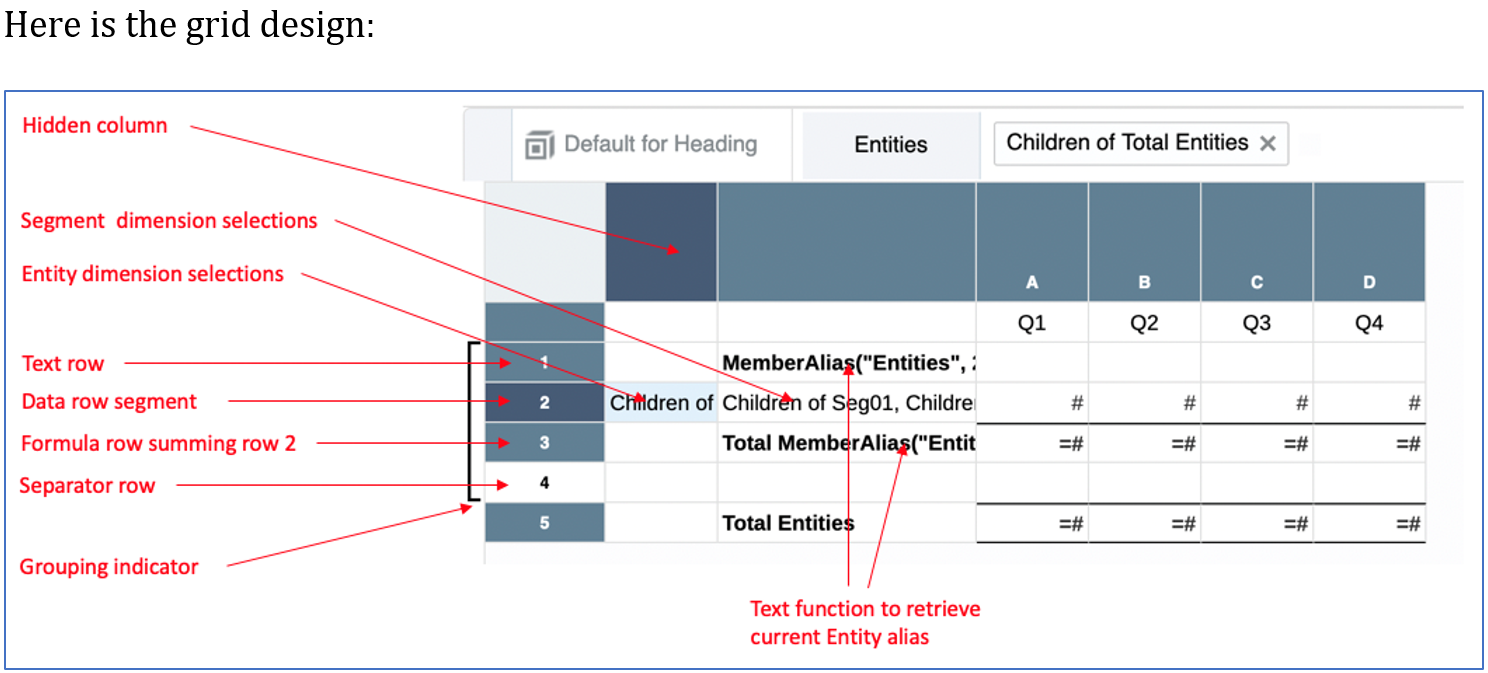
A grouping may only contain one data row or column segment, you can optionally include one or more formula, text and/or separator segments. These non-data segments can be before and/or after the data segment. For example, you can add a SUM formula segment after the data segment to calculate subtotals for each nested dimension combination; you can also add a text segment before the data segment with a text function to display the member name or alias for the current member in the grouping.
You can add a grouping if there are at least two dimensions in the rows or columns. Additional groupings can be added if there are additional dimensions.
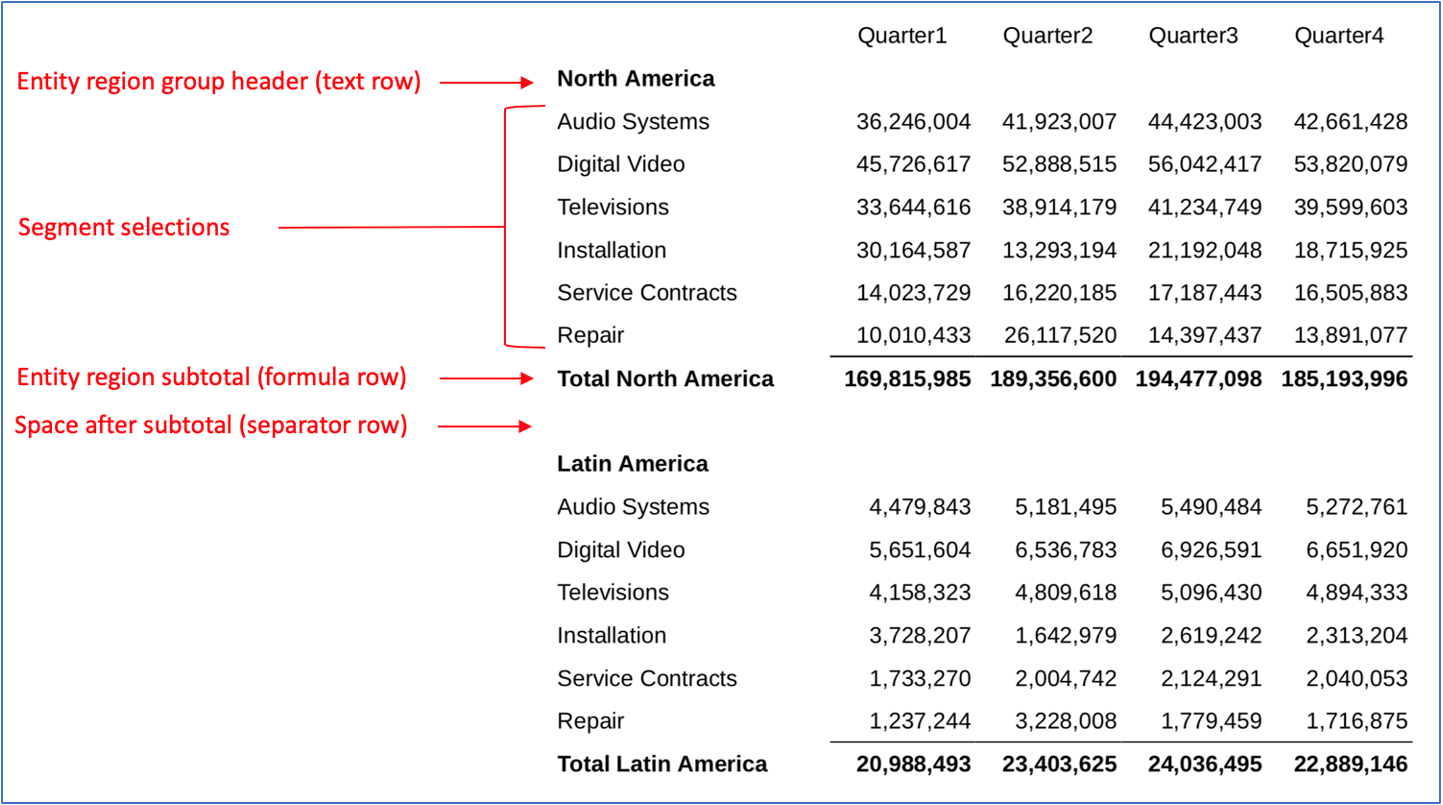
For example, in the following grid with Entity and Segment dimensions in a single row segment, each Entity region (North America, Latin America) is grouped with the Segment selections with a group header (text row), Segment members, a row formula to sum the Segments for each Entity region, and a separator row after each total.


Watch this tutorial video, you’ll learn how to use grouping in grids to calculate, group and format nested dimensions in a row or column data segment.
![]() -- Grouping Dimensions in Grids.
-- Grouping Dimensions in Grids.
A grouping may contain one row or column data segment and, optionally, formula rows or columns to define totals and subtotals, text rows or columns for group headings, and separator rows or columns for blank spaces between groupings.