Working with Legacy Financial Reports
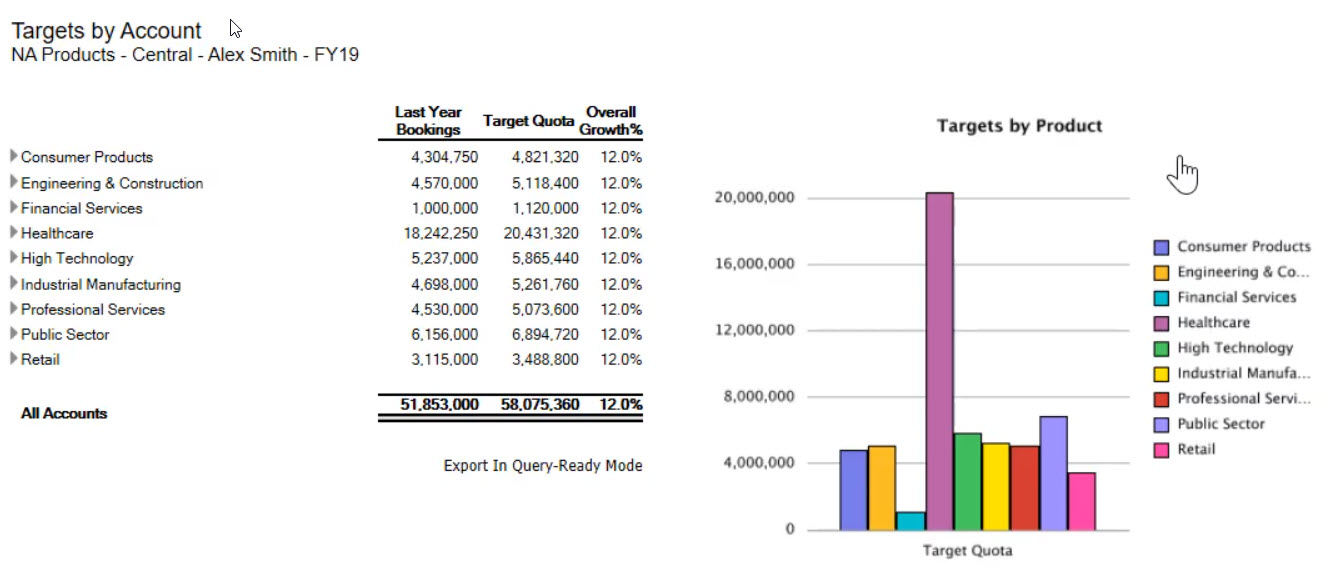
Sales Planning provides a comprehensive report authoring solution that enables you to quickly create dynamic and interactive reports in PDF, HTML, and Excel format. Accurate and timely reports based on real-time data are critical for planning and decision making at multiple levels in a sales organization.
The graphical interface of the report designer allows you to swiftly design report frameworks using objects. The wide range of formatting and design options give you maximum control on the layout of the report.
Power users build report definitions using the Report Designer. Power users assign access to viewers, who use these report definitions to generate reports.
For example, sales managers can design a report definition to analyze quota attainment based on product, account, or territory. The regional manager can use this definition to generate reports based on different criteria.

Report definitions that are built using the report designer act as a framework to retrieve real-time data in reports.
In the Reporting Web Studio, you can design reports by inserting, positioning, and customizing objects such as grids, charts, textboxes and images.
The Reporting Web Studio provides:
-
Different chart types
-
Dynamic member selection
-
Sorting
-
Conditional formatting and suppression
-
Zoom and drill to details
-
Report linking
-
Data source features such as:
-
Supporting detail
-
Cell text and file attachments
-
Drill to source data
-
You can preview reports any time from the report designer and save them as time-specific snapshots.
Once a report is designed, viewers such as regional or operations managers can view and interact with reports in HTML, PDF or Excel format. They can specify criteria for report data by selecting members for dimensions. They can also zoom and drill to access more information and they can download reports.
To design reports, from the Navigator ![]() , click Reporting Web Studio.
, click Reporting Web Studio.
To work with reports, on the Home page, click Reports, and then click the Financial Reports tab ![]() on the left side of the page.
on the left side of the page.
For more information, see:
- Designing with Financial Reporting Web Studio for Oracle Enterprise Performance Management Cloud.
- Working with Financial Reporting for Oracle Enterprise Performance Management Cloud
Videos
| Your Goal | Watch This Video |
|---|---|
|
Learn more about reporting in Sales Planning. |
Tutorials
Tutorials provide instructions with sequenced videos and documentation to help you learn a topic.
| Your Goal | Learn How |
|---|---|
| Learn how to design a new report in Reporting Web Studio to report on Sales Planning data. You add components such as grids, charts, and headers into a report and you set up those components to define how they are displayed. |
|