Running a Query Report
You can display all member combinations across dimensions by running a query sheet as a report.
You can fetch these combinations for all the members on the sheet using the Run as Report or for specific row or column members using the Cross Join on Rows or Cross Join on Columns option.
Run As Report
You can run an ad hoc query sheet as a report to fetch the cross joins between all members in row and column dimensions and to display all member combinations across the dimensions in a separate sheet. The Run as Report option enables you to perform a cross join to display all member combinations across the dimensions.
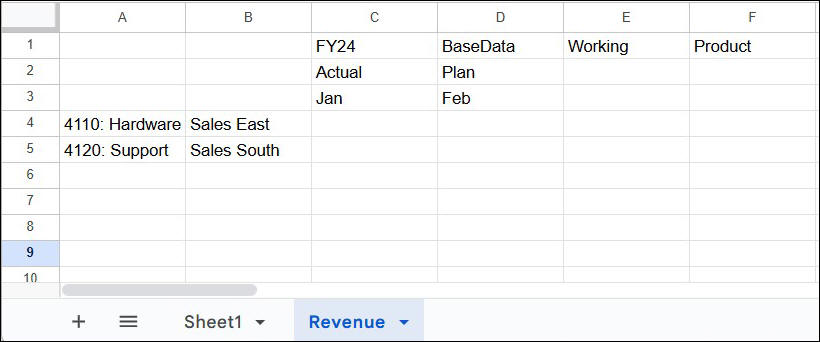
Any regular ad hoc sheet can be treated as a query sheet. You can either type the dimensions and members directly in the sheet or select them using the Member Selector. For example, let's create the following freeform grid in which:
-
Scenario and Time in the columns, where you want to see Actual data for the month of January and Plan data for the month of February.
-
Account and Entity in the rows, where you want to see specific data for specific Account and specific Sales Entity.
You can optionally click Refresh to see the data values in the grid before running the report.
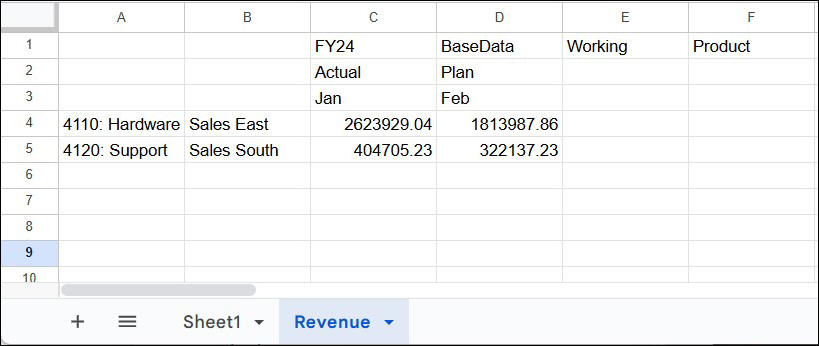
In the grid, every member combination for rows and columns is different. For example, cell C4 displays the value for Hardware revenue from Sales East for Jan for the Actual scenario, where as cell D5 displays the value for Support revenue from Sales South for Feb for the Plan scenario.
To run this ad hoc query sheet as a report, use the Run as Report option. In the Extensions menu, select Smart View for Google Workspace, and then select Ad Hoc. Click Query and then click Run as Report.
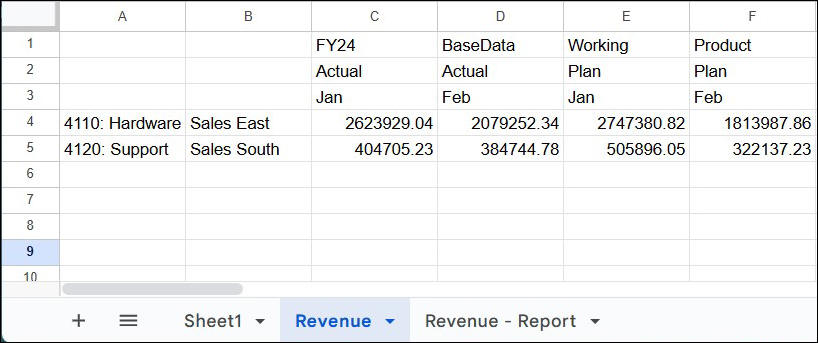
A combination of all row and column members available on the sheet is displayed in a separate report sheet. The report sheet is named as <Sheet name> - Report. In this example, the query sheet is named as Revenue, so the report sheet gets created with the name Revenue - Report.

The report sheet displays a grid consisting of combinations of all existing row and column members on the sheet, along with their data values. In the above example, the report sheet displays Actual and Plan columns for both Jan and Feb months, and Hardware and Support values in rows for both Sales East and Sales South entities.
Cross Join on Rows
If you want to perform cross join for only specific members in rows, use the Cross Join on Rows option.
To display combinations for specific members, select the required row members.
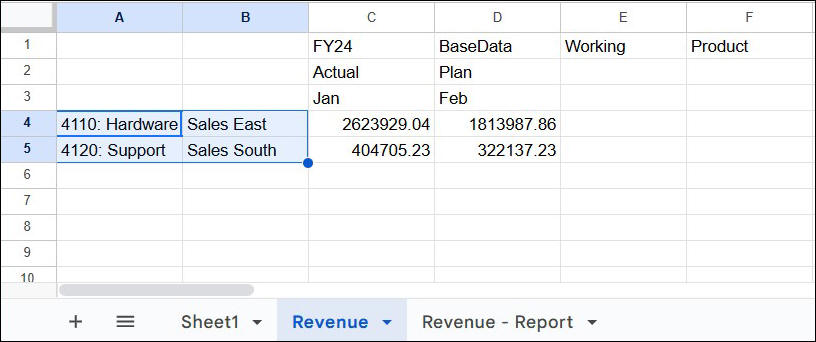
In the Extensions menu, select Smart View for Google Workspace, and then select Ad Hoc. Click Query and then click Cross Join on Rows.
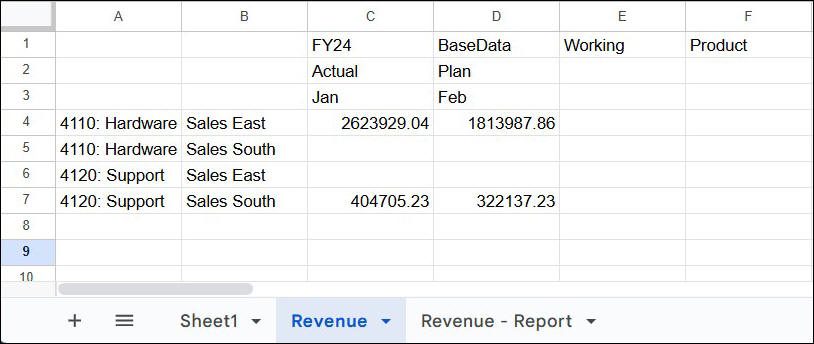
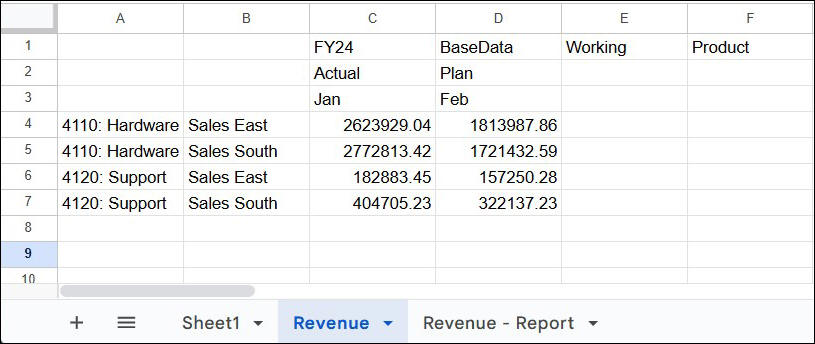
Note that the cross joins or combinations for the selected members are displayed in the same ad hoc sheet in new rows at the end of the original grid. For example, new rows 5 and 6 appear in the Revenue sheet tab itself.
Click Refresh to display the data values for the different row combinations.
Cross Join on Columns
If you want to perform cross join for only specific members in columns to display their combinations, use the Cross Join on Columns option.
To display combinations for specific members, select the required column members.
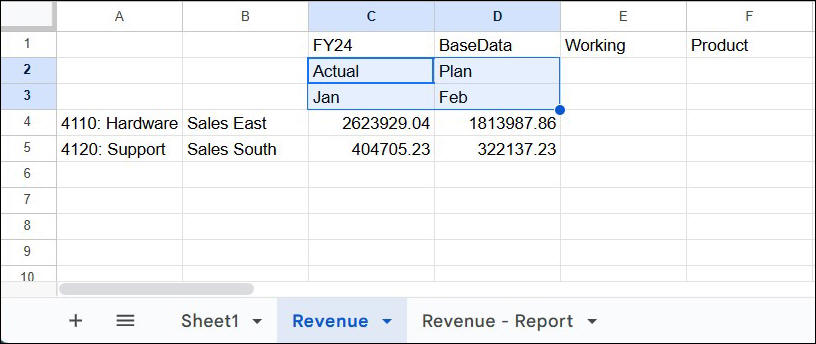
In the Extensions menu, select Smart View for Google Workspace, and then select Ad Hoc. Click Query and then click Cross Join on Columns.
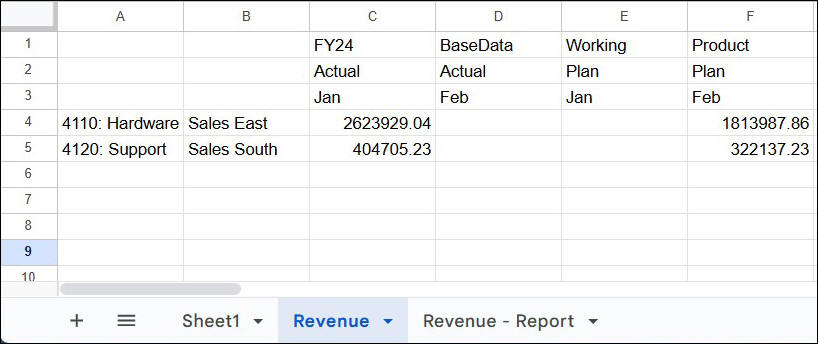
Note that the cross joins or combinations for the selected members are displayed in the same ad hoc sheet in new columns after the existing columns. For example, new columns D and E appear in the Revenue sheet tab itself.
Click Refresh to display the data values for the different column combinations.
