Generating Profit Curves
To generate a profit curve:
-
From the Home page, select Intelligence.
-
On the Profit Curves page, click the name of the profit curve you want to generate.
The profit curve is generated and displayed on the left panel of the page. Click Refresh to display the latest data. In the right panel of the page, you can click the expansion nodes to view the following information:
-
Details: Display the distribution of values associated with the profit curve.
-
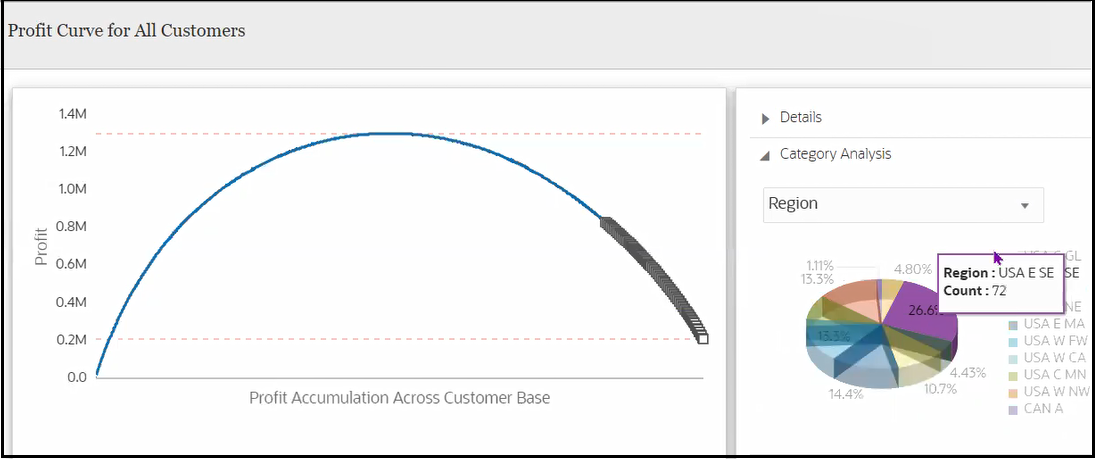
Category Analysis: If the row dimension has attributes, you can select a portion of the curve (by dragging the mouse curser), and analyze the corresponding breakdown of member contributions for a selected attribute category.
For example, in the figure below, the rightmost part of the curve (the least performing customers) is selected, and the attribute category selected is Region. The Category Analysis chart shows that 26.6% of the least performing customers are in the region USA E SE.

- Data: Displays a snippet of data allocations on the
selected attribute category. You can also download data by clicking
Download (
 )
)
-