Completion Progress By Volume Report
The Completion Progress by Volume report shows the total volume of activities completed in minutes or points per hour for a selected date in comparison with the average number of activities completed in the previous week and previous month. Only the regular and reopen activities are considered to generate this report.
The completion progress dashboard report is displayed to the following user categories:
buckets/organizations
individual resources
The Completion progress by volume chart lets you to select a date and add filter to display the data by activity type group. You also need to select the units of measurement to represent the completed activities volume. If the company does not use points according to its 'Business Rules' settings, data is not displayed when 'Points' are selected. The Completion progress by volume report is represented with a column chart.
This figure shows the Completion Progress by Volume report column chart displaying the volume of completion for each hour.
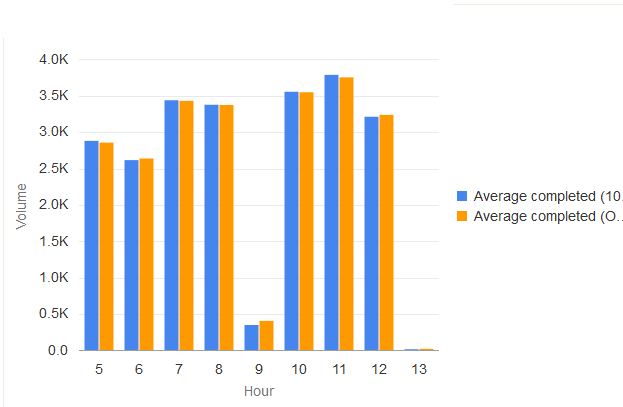
This table displays the elements in the Completion progress by volume report and their description:
| Element | Description |
|---|---|
| Header | Displays the report name and date in the header. |
| Columns | There can be up to three columns per hour representing the following data:
Note: If the previous week/month statistics is not available,
the corresponding column is not show. |
| Legend | Type of data represented by the chart:
|
| Axes | horizontal: Hour vertical: Volume |
| Hint | Each activity displays a hint pop-up with Hour, data corresponding to the selected column, column representing the volume of activities and the units of measurement. |