View Business Metrics for Any Period
The Business Metrics tab provides the details about the business metrics displayed on the Cloud Portal.
Note: The Business Metrics is calculated at the end of the day and only for the Production
environments.
To view the Business Metrics for a particular period, use the procedure
below:
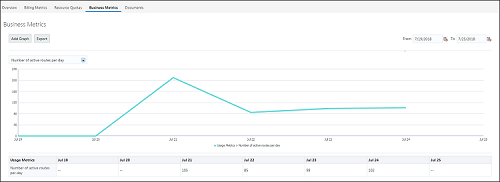
Click the Calendar and select the dates for which you want to view the business metrics.
From the drop-down list, select the type of business metrics you want to view. The specific Billing Metrics appears as a graph.
Types of Business Metrics
The following table lists different types of business metrics:
| Metrics | Description |
|---|---|
| File management: number of files | Provides information about a file storage usage metric, namely: number of requests to File storage grouped by day |
| File management: number of bytes | Provides information about a file storage usage metric, namely: number of transferred bytes grouped by day |
| Number of logged users | Provides information about the number of active users that logged into the system grouped by day |
| Number of mobile workers | Provides information about the number of active Mobile Workers grouped by day |
| Number of activated routes | Provides information about the number of active routes grouped by day |
| Number of sent messages | Provides information about the number of messages sent out through the Notification Engine grouped by day |
| Number of auto-routed activities | Provides information about a Routing usage metric, namely: percentage of auto-routed activities |
| Number of manually assigned jobs | Provides information about a Routing usage metric, namely: percentage of manually assigned jobs |
| Number of not-routed jobs | Provides information about a Routing usage metric, namely: percentage of not-routed jobs |
| Routing Usage | Provides information about a Routing usage metric, namely: a number of routing runs per day |
| Average Travel Time | Provides information about a Travel time metric, namely: average travel duration per day. |
| Number of assigned appointments | Provides information about the number of assigned jobs metric, namely: average number of assigned jobs per Mobile worker per day |
| Number of completed assignments | Provides information about the number of completed jobs metric, namely: average number of completed jobs per Mobile worker per day |
| Number of cancelled appointments | Provides information about the number of cancelled jobs metric, namely: average number of cancelled jobs per Mobile worker per day |
| Number of suspended appointments | Provides information about the number of suspended jobs metric, namely: average number of suspended jobs per Mobile worker per day |
| Number of not done appointments | Provides information about a number of not done jobs, namely: avg. number of not done jobs per Mobile worker per day |
| % of appointments started in time | Provides information about the percentage of jobs that started within Service window |
| % of appointments not started in time | Provides information about the percentage of jobs that started after Service window end time |
| % of appointments completed within SLA | Provides information about the percentage of jobs completed within SLA window |
| % of appointments completed outside SLA | Provides information about the percentage of jobs completed outside SLA window end time date and time |