Example: Creating a Chart to Display Journal Values of the Preparers
This example creates a chart that displays the values of the journals under each preparer.
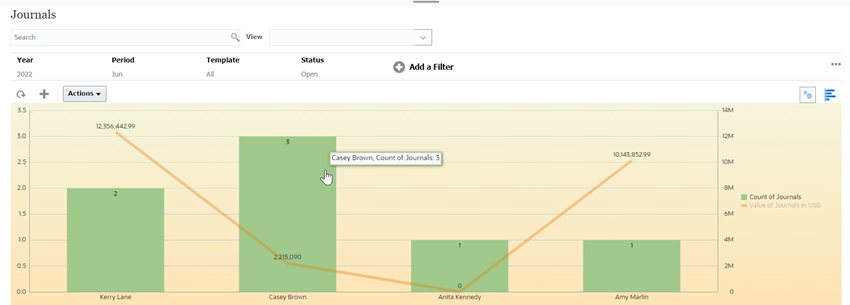
The generated chart is displayed as shown. Click any area within the chart to drill down and view of the individual records that comprise that aggregated area. You can see that though Casey Brown has three journals, the journal value is lesser than Kerry Lane who has only two journals.

To create this chart:
- From the Home page, click Enterprise Journals to display the Enterprise Journals List.
- From the View Selector at the top-right of the page, select Chart
View.
The Chart view appears with a default chart displayed.
- Click Edit at the top-right to display the Edit Chart dialog.
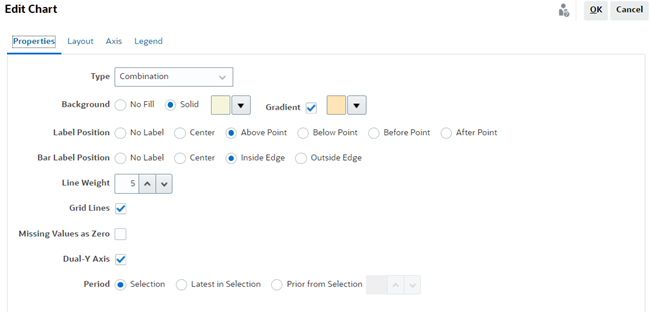
- In the Properties tab, specify the following:

- In Type, select Combination.
- In Background, select Solid. Select the color of your preference from the drop down.
- Select the Gradient checkbox. Select the color of your preference.
- In Label Position, select Above Point.
- In Bar Label Position, select Inside Edge.
- In Line Weight, select 5.
- Select Line Weight as 5.
- Select Grid Lines.
- Deselect Missing Values as Zero.
- Select Dual Y Axis.
- In Period, select Selection.
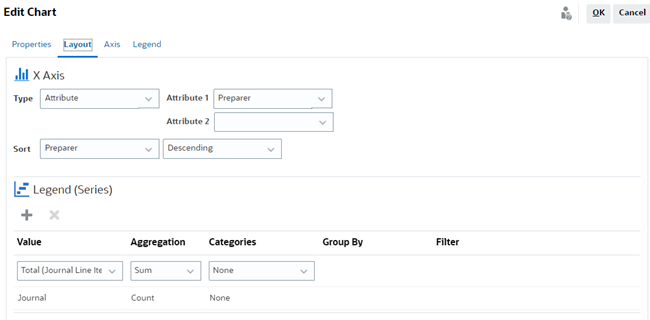
5. In the Layout tab, specify the following:

- In the X-Axis section, for Type, select Attribute.
- For Attribute 1, select Preparer.
- In Sort, select Preparer and Descending.
- In the Legend (Series) section, enter 2 values:
- For the first entry:
- In Value, select Total (Journal Line Items).
- In Aggregation, select Sum.
- In Categories, select None.
- For the second entry:
- In Value, select Journal.
- In Aggregation, select Count.
- In Categories, select None.
- For the first entry:
6. In the Axis tab, leave the default settings as is.
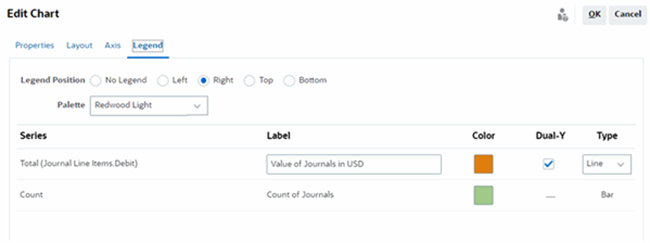
7. In the Legend tab, specify the following:

- In Legend Position, select Right.
- In Palette, select Redwood Light.
- For Series 1, select Total (Journal Line Items Debit), enter Label as Value of Journals in USD, select Dual-Y, Type as Line.
- For Series 2, select Count, enter Label as Count of Journals, and Type as Bar.
8. Click OK.