Using Tables in Dashboards
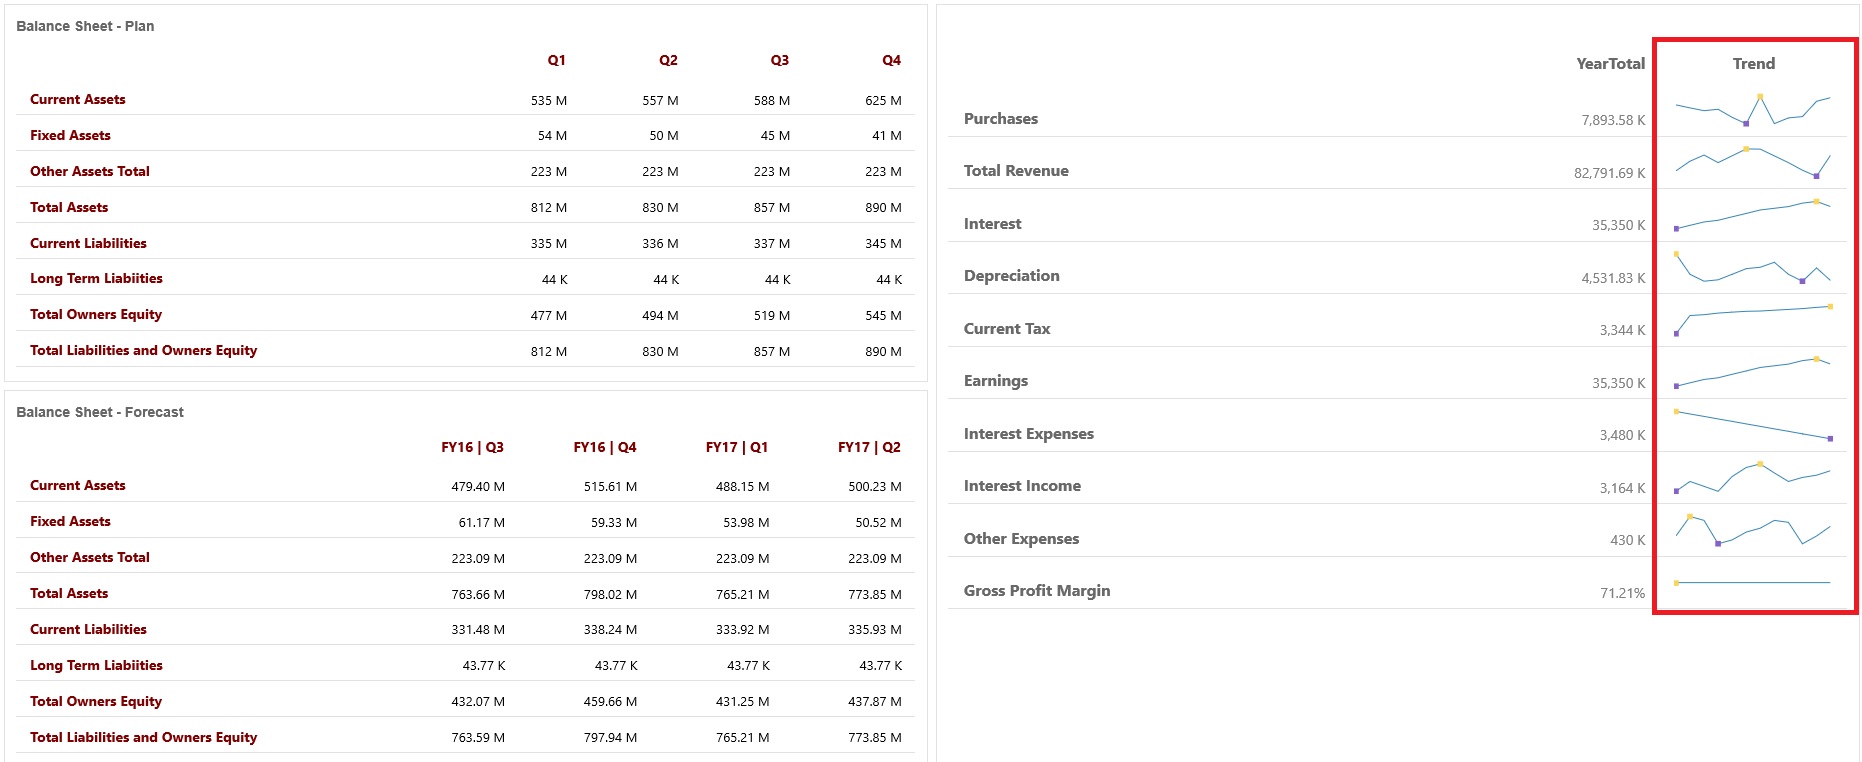
Tables in dashboards provide a list view of the data showing multiple values from a form or grid. You can embed mini-charts into each row of the table, called Spark Charts, which plot column data. Tables are also searchable. Note that currency symbols or currency codes are displayed in tables for multicurrency applications.
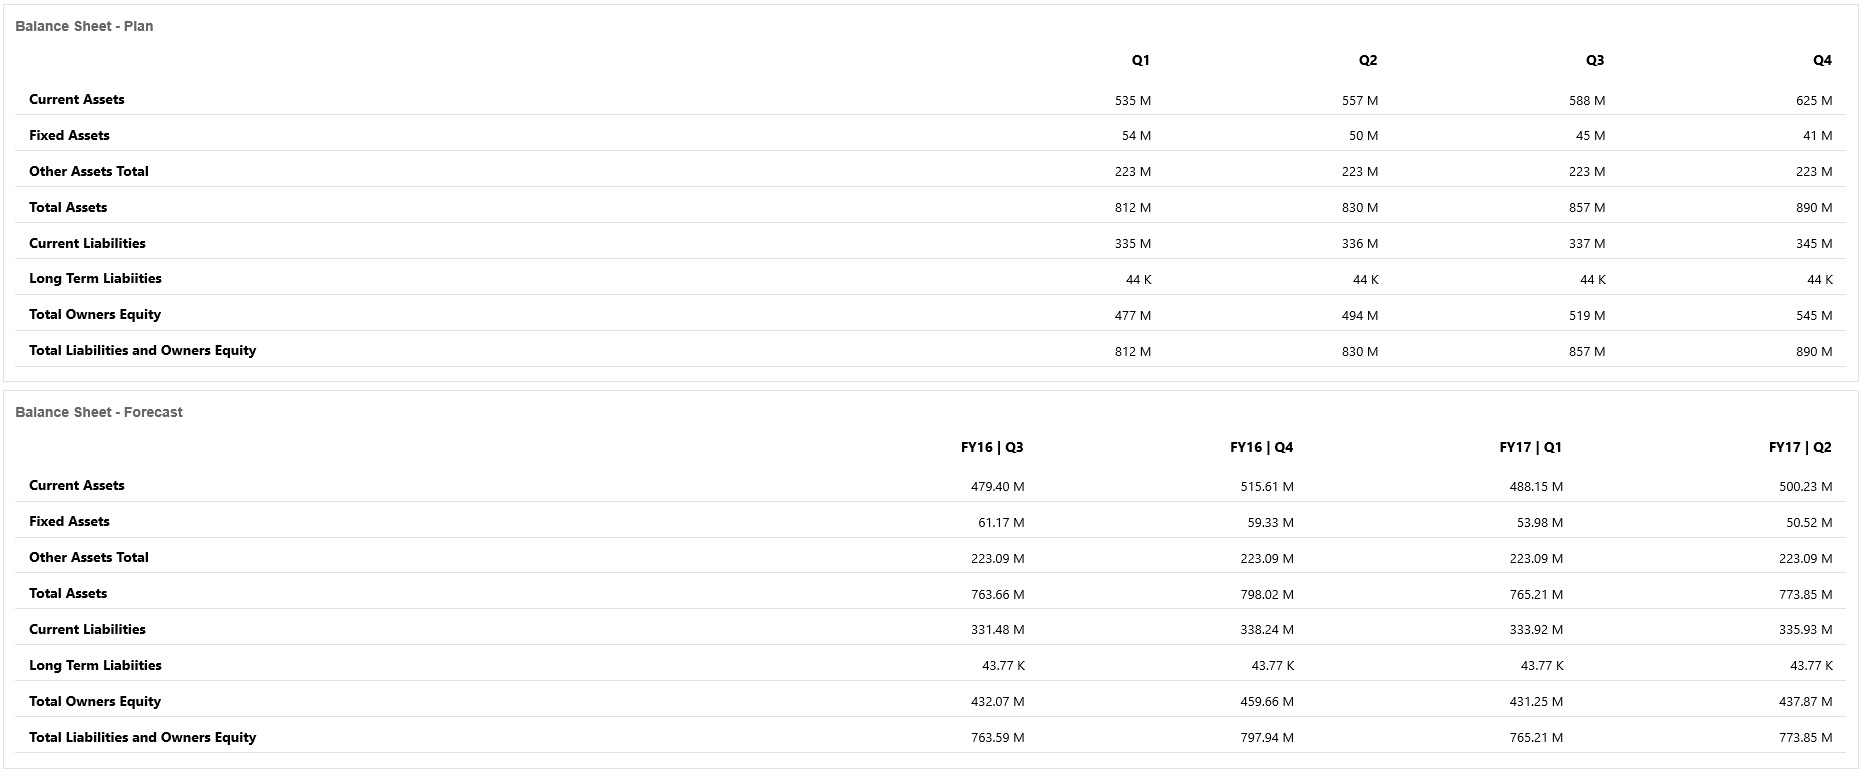
Example Dashboard Showing Plain Tables

Example Dashboard Showing a Table With a Spark Chart

Dashboard designers can set these table properties:
Table 12-6 Table Properties
| Setting | Description |
|---|---|
|
Value Scale |
Especially useful for large numbers, you can scale how a value is displayed. For example, if the value is 1,689,000 and you select K - Thousand as the scaling option, the table displays the value as 1,689K. Your scaling options:
|
|
Row Divider |
Choose Show or Hide. |
|
Font |
Specify size and color options for headers and data. |
|
Spark Chart |
|
Videos
| Your Goal | Watch This Video |
|---|---|
|
See how to create a dashboard with multiple components in the Dashboard Designer for Dashboard 2.0. You create a dashboard with a table, a table with a spark chart, and a tile chart. |