Overview of Financial Reporting Center
The Financial Reporting Center is intended to be the primary user interface for financials end users to access all seven report types.
Financial Reporting Center
The Financial Reporting Center includes these report types: Financial Reporting Web Studio Reports, Account Groups and Sunburst, Smart View Reports, Oracle Transactional Business Intelligence Analyses, Oracle Transactional Business Intelligence Dashboards, Oracle Analytics Publisher Reports, and Business Intelligence Mobile Apps. Other reporting tools are also available to run the same seven report types.
This figure illustrates the report types that are available in the Financial Reporting Center.
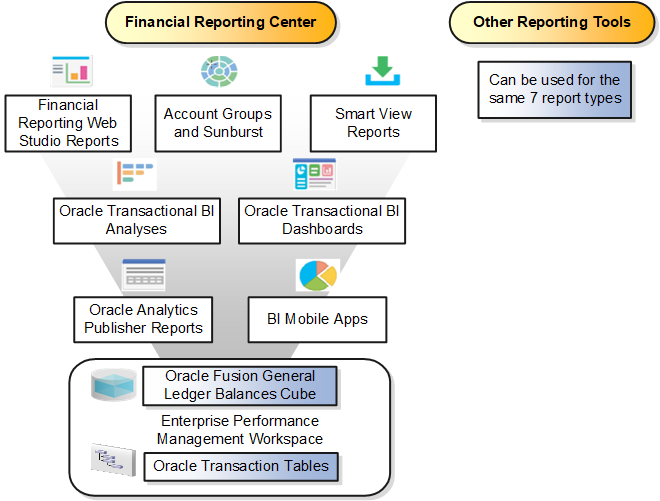
Reports can be accessed through various methods. However, the Financial Reporting Center provides access to every type of report, is intended to be the primary user interface for financials end users, and is tablet and smartphone friendly. In addition to accessing reports, you can add favorites, define tags, and view report details, such as type and last updated date.
Financial Reports are read from the Shared > Custom > Financials and My Folders directories. All other report types can be saved anywhere in the BI Catalog however, any user-defined content should be in the Shared > Custom folder. Subfolders can be created within the Shared > Custom folder.
Seven types of reports can be run from the Financial Reporting Center and from the other reporting tools.
-
Financial Reports: These reports are built off of the Oracle Financial Reporting Web Studio using data in the Oracle General Ledger balances cube. For example, company income statements and balance sheets. These reports are mainly run by users in General Ledger.
-
Account Groups and Sunburst: Account groups are used to monitor key accounts in General Ledger. When a user creates an account group, it becomes visible in the Financial Reporting Center with the Sunburst visualization tool. The Sunburst visualization tool lets you interact with your account balances across various business dimensions to view balances from different perspectives. Account groups are used only in General Ledger.
-
Smart View Reports: Smart View is a multidimensional pivot analysis tool combined with full Excel functionality. Smart View enables you to interactively analyze your balances and define reports using a familiar spreadsheet environment. These queries are mainly for users in General Ledger. To share Smart View queries, users can email them to other users, or they can upload the queries to the Financial Reporting Center where users can download them to a local drive for use. The Financial Reporting Center is only a place for users to upload and download Smart View queries.
Note: To upload a Smart View report to the Financial Reporting Center: select the Open Workspace for Financial Reports task, navigate to the BI Catalog, and select Upload from the Tasks section. Be sure to upload the Excel file to one of the folder locations mentioned previously. -
Oracle Transactional Business Intelligence Analyses: These analyses and reports are built off of transactional tables using subject areas. These reports can be run by users in General Ledger, Payables, Receivables, Cash Management, Intercompany, and so on.
-
Oracle Transactional Business Intelligence Dashboards: Dashboards put all the information, functions, and actions that a business user must have to do their job in one place. Dashboards are built off of Oracle Transactional Business Intelligence objects like analyses and reports. These reports can be run by users in General Ledger, Payables, Receivables, Cash Management, Intercompany, and so on.
-
Oracle Analytics Publisher Reports: Most of these reports are predefined and must first be submitted and resubmitted to see the latest data by the Oracle Enterprise Scheduler through the Scheduled Processes navigation. These reports can be run by users in General Ledger, Payables, Receivables, Cash Management, Intercompany, and so on.
-
BI Mobile Apps: Oracle Business Intelligence Mobile App Designer is an application that enables you to create multitouch information-driven applications with rich interaction, rich visualization, and rich media, for mobile devices such as iPhone, iPad, Android phone, tablet, and more. These reports can be run by users in General Ledger, Payables, Receivables, Cash Management, Intercompany, and so on.
Other Reporting Tools
Six other tools are available for reporting in Financials.
The following table lists the other reporting tools and the types of reports they support.
|
Other Reporting Tools |
Report Type |
|---|---|
|
General Accounting Dashboard and Account Inspector |
Account Groups |
|
Reports and Analytics |
Oracle Transactional Business Intelligence Objects |
|
BI Catalog |
All Report Types, Except Oracle Analytics Publisher Reports |
|
Enterprise Performance Management Workspace |
Reports, Books, Snapshot Reports, Snapshot Books, Financial Reporting Batches, and Batch Scheduler |
|
Enterprise Scheduler System |
Oracle Analytics Publisher Reports |
Even though the Financial Reporting Center is designed to be the main user interface for a financial end user's reporting needs, some users may choose to use any of the six other tools for reporting in financials, such as:
-
General Accounting Dashboard, which provides access to Account Groups: Uses the Account Monitor to efficiently monitor and track key account balances in real time.
-
Account Inspector: Perform ad hoc queries from account groups and financial reports through drill down to underlying journals and subledger transactions.
-
Reports and Analytics: This reporting tool has a panel that reflects the folder structure of the BI Catalog. Users can access and run any Oracle Transactional Business Intelligence analysis, report or dashboard. Users can't run predefined Financial Reports or Oracle Analytics Publisher reports from this interface. This interface can be used by all financials users.
-
BI Catalog: A component of the Enterprise Performance Management Workspace where you can run all report types, except for predefined Oracle Analytics Publisher reports.
-
Enterprise Performance Management Workspace: Create reports, books, snapshot reports, snapshot books, Financial Reporting batches, and batch scheduler, and schedule batches to automatically run and burst to email.
-
Enterprise Scheduler System: Only Oracle Analytics Publisher reports can be submitted from this interface. Users access this interface by navigating to Tools > Scheduled Processes. Most financial users have access to this interface to run standard reports for General Ledger, Payables, Receivables, and so on.