Predicting Future Values Based on Past Performance
You can start a prediction from a valid form or ad hoc grid. When you run a prediction, historical data for each member on the form is retrieved and then analyzed using time series forecasting techniques to predict the future performance for these members.
For details about valid forms, see Using Valid Forms.
-
From a form or ad hoc grid, click Actions, and then Predictive Planning. The prediction runs, and a results area opens below the form with a chart and detailed information about the prediction.
If there isn't a calendar associated with the form, you are prompted to select a calendar before the prediction can run. Select a calendar that maps to the granularity defined in the form. This selection is saved with the form.
Use the results to compare the predicted values to your forecasted values for each member.

Depending on the chart settings:
-
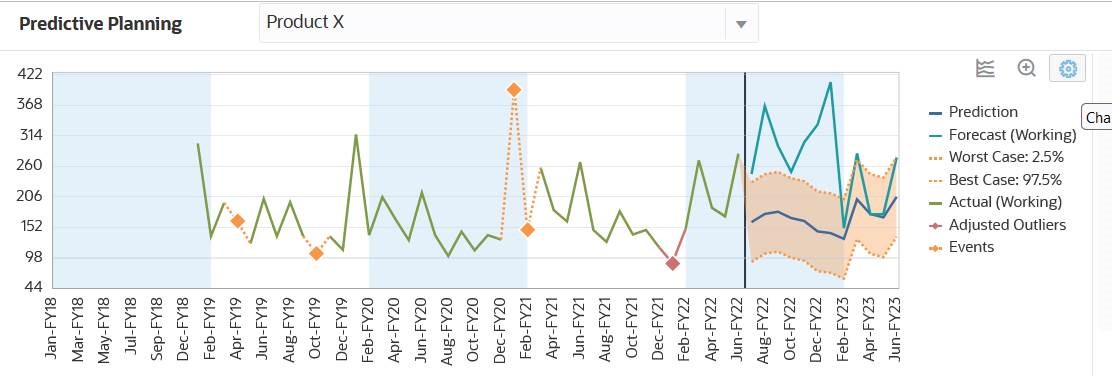
The historical data is shown as a green series to the left of the vertical separator line. Administrators determine the scenario/version to use for historical data values.
-
The base case for predicted data is in the blue series to the right of the vertical separator line.
-
The predicted data series is bounded by dotted lines that show the upper and lower prediction intervals—the range between the Best Case predicted scenario and the Worst Case predicted scenario.
-
Your forecast values are in the red series on the right side of the chart. The chart displays a data series for each scenario on the form.
- If the form has a calendar with events associated with it, events are
displayed as orange diamonds in the historical data section.
Tip:
If the selected calendar includes Skip type events, you can choose to exclude or include the Skip events to see the impact on the prediction results. Hover the cursor over the upper right corner of the prediction area, and then click Exclude Skip Events or Include Skip
Events.
You can change the way the chart is displayed. See Customizing the Chart.
-
-
To see predicted values for a different member, select the member from the member list in the results area, or click the row for the member in the grid area.
The prediction area is updated so you can see the historical trends and predictions for each member on the form.
Tip:
Hover the cursor over the upper right corner of the prediction area, and then click Zoom InAbout predictions:
-
Predictive Planning predicts all members on a form.
-
The lowest Period dimension member level on a form determines the time granularity of the prediction. A form with lower level Period members (for example, months instead of quarters) has more historical data, which improves the accuracy of the prediction. There should be at least twice the amount of historical data as the number of prediction periods.
-
Predictive Planning can detect seasonal patterns in the data and project them into the future (for example, spikes in sales numbers during holiday seasons). At least two complete cycles of data must be available to detect seasonality.
-
Predictive Planning detects missing values in the historical data, filling them in with interpolated values, and scans for outlier values, normalizing them to an acceptable range.
- Your administrator may have designed the form to use events in predictions by
default. Alternatively, when running a prediction from a form, you can use the
Settings option to select a calendar to use for the
prediction and whether to include events in the prediction. Use the Chart
Settings to specify whether to show events on the chart. You can
also choose to exclude Skip events. You can run the prediction with and without
events to see the impact of the events on the prediction results. Using events for
predictions improves the accuracy of the predictions. See Changing the Chart Appearance and Changing Prediction Options.
For information about calendars and events, see About Using Calendars and Events in IPM Insights, Auto Predict, and Predictive Planning in Administering FreeForm.
For detailed information about the forecasting methods and error measures used in Predictive Planning, see Predictive Planning Forecasting and Statistical Descriptions.
Predictive Planning always runs a full prediction. Full predictions predict all members on a form without regard to dimension hierarchies. With this method, Predictive Planning makes no assumption about the type of aggregation on the form. If you want to preserve the results at the summary-levels, ensure that the business logic does not aggregate the results from lower level members. For more information about hierarchical prediction issues, see Hierarchical Data Prediction Issues.