Write-Enabled Dashboard Examples
With write-enabled dashboards, Oracle Fusion Cloud Enterprise Performance Management supports the ability to update data and immediately visualize it.
Provided in the table below are recommendations for the components to display in write-enabled dashboards, the chart types to use, and the number of components.
| Dashboard Content | Recommendation |
|---|---|
|
Information to display |
|
|
Chart types |
Grids, Tables, Line/Bar/Area, Waterfall, Pie, Gauge, Doughnut |
|
Number of dashboard components |
2 to 4 |
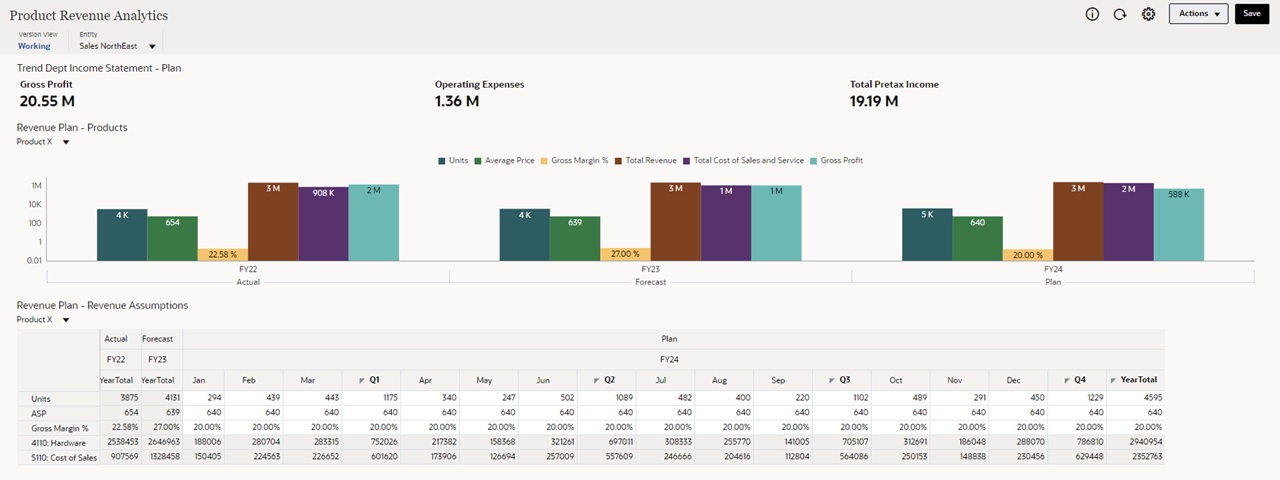
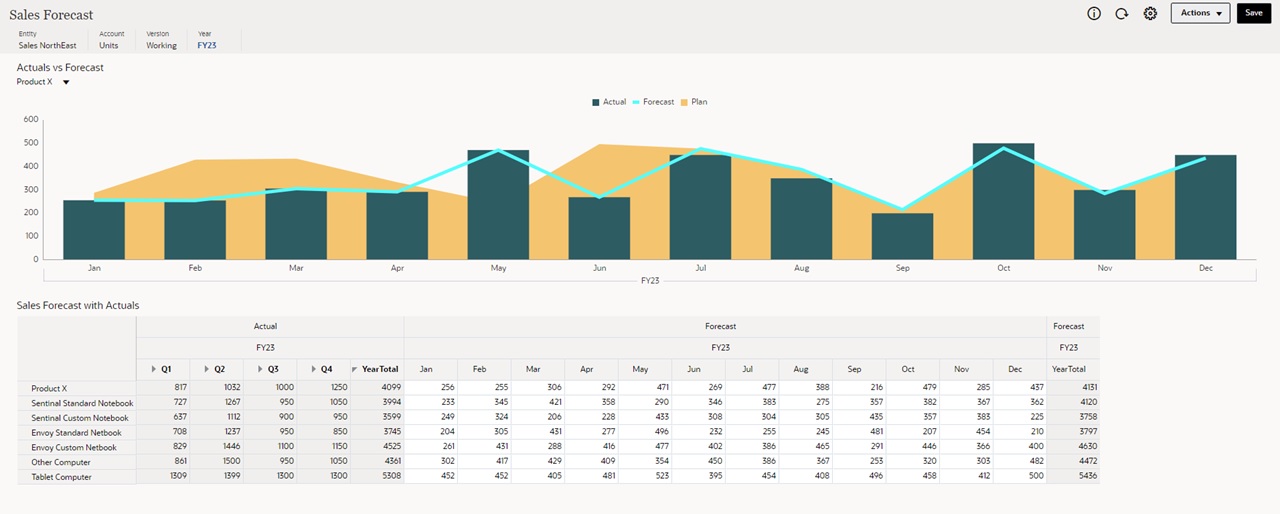
In the examples below, note that the dashboards have both visual charts to represent data as well as grids (wherein data updates are made). When the grid values are updated and saved, the changes are reflected in the chart(s) in real-time.
Example Write-Enabled Dashboard: KPI Tiles with Writeable Grids
In the dashboard example below, the top component of the dashboard uses tiles. The middle left and bottom components are writeable grids, and the middle right component is a bar chart.

Example Write-Enabled Dashboard: Sales Forecast
In the Sales Forecast dashboard example below, the Actuals vs Forecast chart at the top is a combination chart, and the Sales Forecast with Actuals grid at the bottom is a writeable grid.
