Account Engagement Overview dashboard
The Account Engagement Overview dashboard provides an account-centric view of marketing metrics. It organizes marketing metrics by account rather than leads, channel, or product.
By default, the dashboard shows information for your top engaged accounts from the last two weeks. You can use the filters to change the date range.
Click a link below to find out more about this dashboard:
Learn more by watching this video!
Good to know
- This dashboard refreshes every 24 hours.
- Accounts are determined using either the account to contact linkage or the contact's company name. For example, if a contact has an account linkage, the activity is associated to the linked account name. Whereas, if a contact does not have a linked account, the activity is associated to the company name. You can use the Account Source column to understand the source of the account name.
- Account engagement is measured using the total email clickthroughs, form submissions, page views, and external activities.
- Unless otherwise noted below, forwarded messages count toward the metrics in this dashboard. For example, if a contact forwarded an email, and the recipient clicked a link, the recipient's clickthrough would count towards the clickthrough metrics in this dashboard.
- To access a dashboard report in Insight, click
 . The dashboard reports are available in Insight in the following location: Shared Folders / Dashboard Reports / Account Engagement.
Dashboard filters
Use the Filters section to filter the dashboard based on activity date. The following filter is available:
- Date Range: The activity time frame of the dashboard. Accounts must have clickthroughs, form submits, external activities, or page views during this time frame to be included.
Dashboard metrics
| Metric | Description |
|---|---|
| Account Contacts |
The total contacts associated with the account. Tip: To view contacts that performed the activities, open the Top Engaged Accounts report and drill down to contact details. |
| Total Clickthroughs | The total clickthroughs. This includes multiple clicks by the same recipient. System Action links are not tracked. |
| Total Form Submissions | The total forms submitted. This includes multiple submissions by the same contact. |
| Total Page Views | The number of times that a page was viewed. A visitor might view the page multiple times during a visit and this metric counts each of those views. One page view is counted every time the page is loaded. |
| Total External Activity | The amount of activity that occurred outside of Oracle Eloqua. For example, attending a trade show, or interacting with an app such as WeChat. The data associated with an external activity is either uploaded to Oracle Eloqua or generated by an app. For more information, see External assets and activities. |
Understanding the charts on the dashboard
Top Engaged Accounts
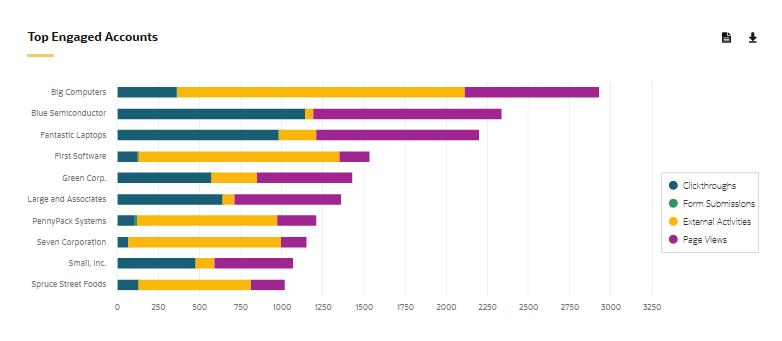
This chart shows a comparison of clickthroughs, form submissions, page views, and external activities for the accounts within the specified date range. Click to view the Top Engaged Accounts report.
Activity Timeline by Account
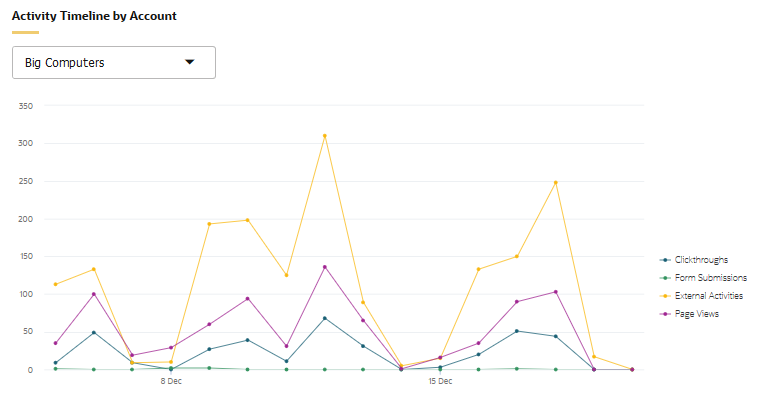
This chart shows the total clickthroughs, form submissions, page views, and external activities for an account within the specified date range. You can select any account using the drop-down above the chart name. You can also use the search functionality in the drop-down to search for accounts. Search will begin after you type 3 characters.
Top Accounts by Engagement Score
Important: This feature is only available if the
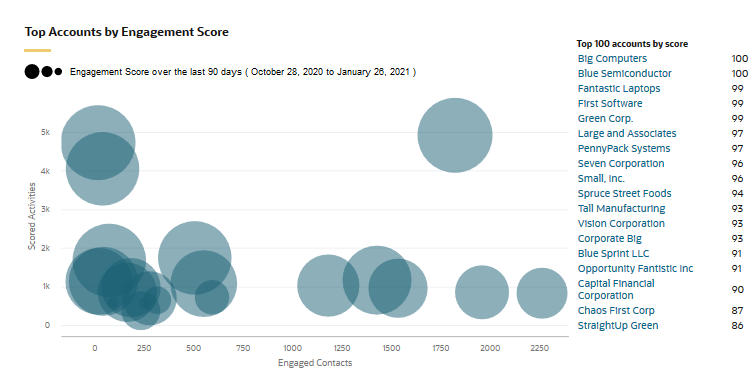
This chart compares an account's engaged contacts to engaged activities. The size of the bubble is proportional to the account's engagement score.
When reviewing the chart, you might want to focus on outliers—an account that is very different from others. You may want to perform a deeper analysis on these accounts as they may represent valuable information. Clusters of accounts may also be worth deeper anaysis as you may want to focus on some of those accounts and how to move them beyond the cluster. Click on the name of an account to drill to the Account Performance dashboard.
Accounts by Engagement Score
Important: This feature is only available if the
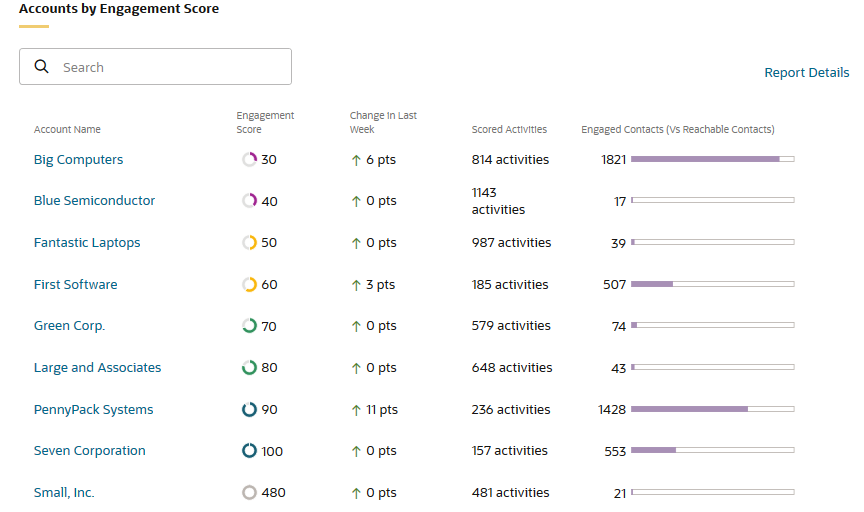
This table lists the 100 top accounts by engagement score over the last 90 days. Examine how many contacts were engaged within the account and how many engagement points have changed within the last week.
Use this table to better examine how many contacts were engaged out of total reachable contacts. This will allow you to determine where to drill down in ongoing campaigns based on specific accounts.
Click on the account name to access the Account Performance dashboard.
Accounts Summary
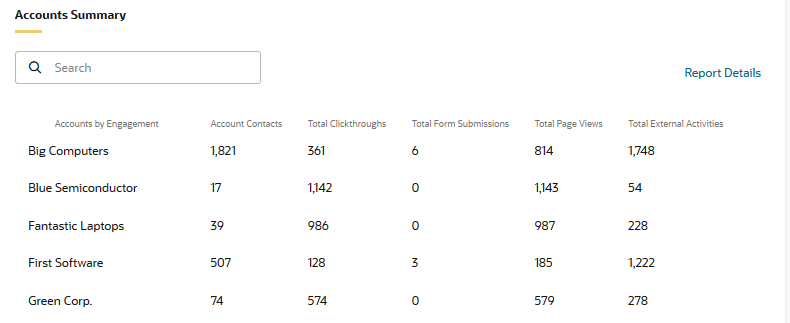
This chart shows the total number of contacts, clickthroughs, form submissions, page views, and external activities for the top 100 accounts within the specified date range. Click Report Details to view the Top Engaged Accounts report.