Email open by device metrics dashboard
The email open by device metrics dashboard shows information about the devices that are being used to open your emails. Information in this dashboard is derived from the user agent string. The user agent string identifies information about the browser, device, operating system, and so on.
By default, the dashboard shows all email open activity from the last two weeks. You can use the filters to change the date range and group data by campaign.
Click a link below to find out more about this dashboard:
Good to know
- This dashboard only shows information related to email opens.
- Oracle Eloqua began collecting data for this dashboard since version 492, released between October 31 - November 12, 2017. There is no data available before these dates.
- The user agent string from iOS devices usually don't identify the specific device model. As a result, these devices are usually classified as Apple without a specific device model.
- To access a dashboard report in Insight, click
 . The dashboard reports are available in Insight in the following location: Shared Folders / Dashboard Reports / Email Open by Device Metrics.
Dashboard filters
Use the Filter results section to filter your campaigns. The following filters are available:
- Date Range: The time frame for the data on the dashboard. To appear on the dashboard, the email must have been opened during this time frame.
- Options: Groups data on the dashboard by device or by Campaign Type, Product, or Region.
Dashboard metrics
| Metric | Description |
|---|---|
| Email opens | The total opens by email recipients (original recipients or email forwards). An open is counted every time the email is opened. |
Understanding the charts on the dashboard
Email Open by Device Platform Trend
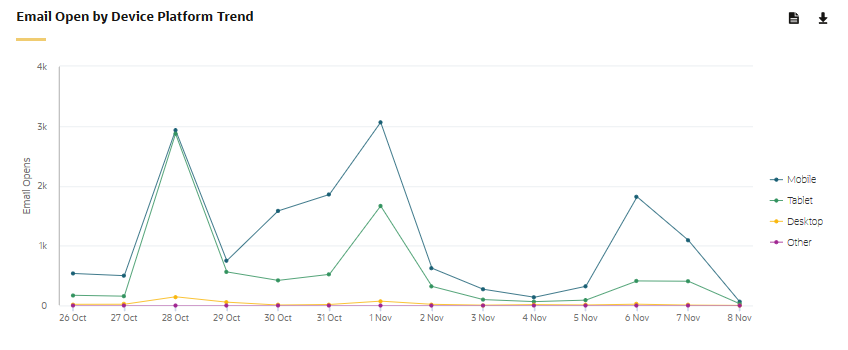
This chart shows the total opens by device type over the filter date range. You can use this chart to quickly determine what types of devices are being used to open your emails. Device types include Desktop, Tablet, Mobile, or Other. Other includes non-mobile devices like other mobile, smart TV, robot, or unknown. To break down the other category and view the non-mobile types, click .
Email Open by Device
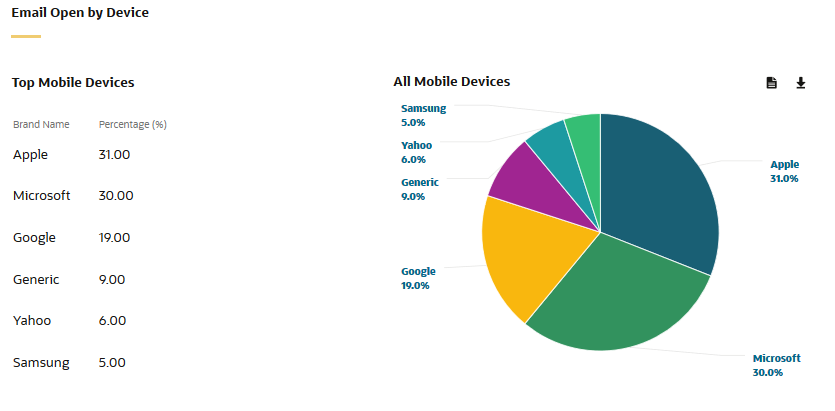
This report and chart show the percentage of email opens by the top 10 device brand. All device types are included, such as desktop, mobile, tablet, and so on. Generic indicates that there is no brand recorded for the device (for example, desktop devices). Others is a grouping of all other devices that make up the remaining percentage of email opens. Others include other mobile, smart TV, robot, and unknown. You can break this down in Insight by building an analysis with the Device Category and Form Factor attributes. Learn more about building a report.
Email Open by Mail Client
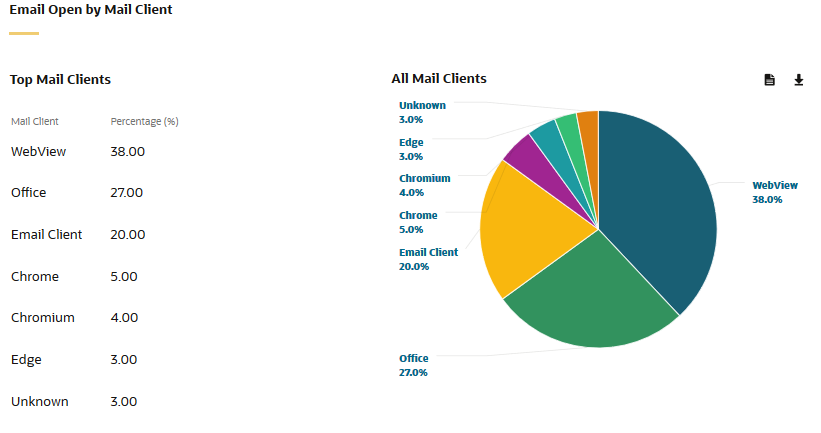
This report and chart show the percentage of email opens by the top 10 email clients. This chart can help you understand what email clients are being used to open your emails. If a browser was used to access the email client, then this report might show the browser information instead of the email client. You can use the chart to drill down and view a breakdown of a given operating system by version.
Email Open by Operating System
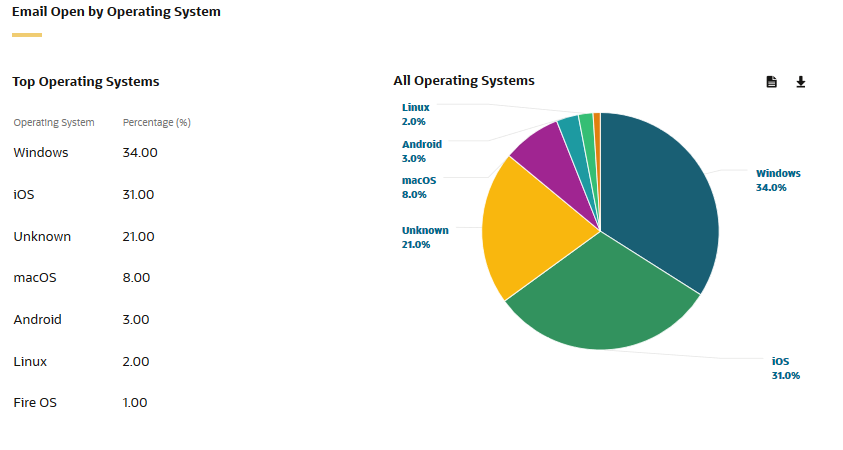
This report and chart show the email opens by the top 10 operating system (for example, Windows, iOS, and so on). You can use the chart to drill down and view a breakdown of a given operating system by version.