Viewing and managing event reports
A number of reports and dashboards are available for events.
Accessing reports for an event
To access reports for an event:
- Navigate to Orchestration
 > Tools, then click Events.
 - Locate an event on the left panel, click the drop-down arrow next to the event name, then click Event Dashboard.
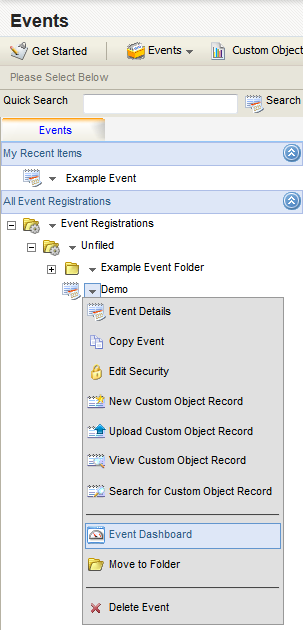
The dashboard for this event opens in the right panel, showing three reports:
- Event Submissions: Shows submissions for the event day-by-day over the selected time range.
- Session Overview for Event: Shows the breakdown of different sessions for the event, including the numbers registered, on the waitlist, canceling, and in total for each session.
- Event Registrations by Geography: Shows the registrants on the selected map.
From this page, you can select one or more of a number of options for an individual report. Select the Actions or Export menu in the upper right corner of each respective report window, then click one of the available options.
Options for an individual report's Actions menu include:
- Refresh: If you want to make sure that the information is current for the report, click this option.
- Pop-Out Report: Open the report in window you can resize. This makes it easier to work with report details.
- Edit: Edit the features of the report. This options is only enabled if you are the owner of the Report.
- Print: Send the report to a print engine.
- View Tabular Report: If the report is in chart or map format, this lets you view the data points as a table.
- Remove: Remove the report from the dashboard. This option is available only to the owner of the report.
Options for an individual report's Export menu include:
- Export To Excel: Export the report to your local machine as an Excel .xls file.
- Export as Image: Export the report to your local machine as a .png file.
-
Click Additional Reports in the upper-right corner of the right panel to access the following:
- Event Registrants and Contact Data: Shows custom object records that have been created during a specified time range.

You can change the Start Date and End Date, or select a different time span (such as Last week or Last month), and click the
 button to view information for a different time range.
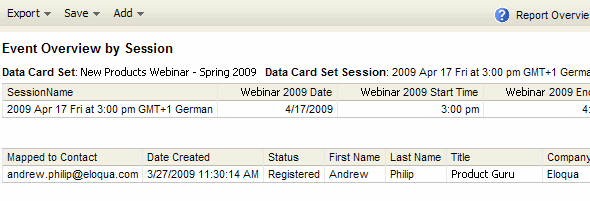
 - Event Overview by Session: To view this report, you must first choose the specific session in a multiple-session event about which you want to view information. Then click Select.

The report shows session information about the contact details mapped to that session.
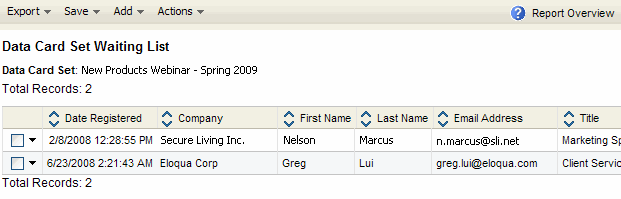
- Event Waiting List: The waiting list shows details of custom object records in waiting for a particular event.
- Custom Object Record Field Values: To view this report, you must first choose the specific field about which you want to view information, then click Select.
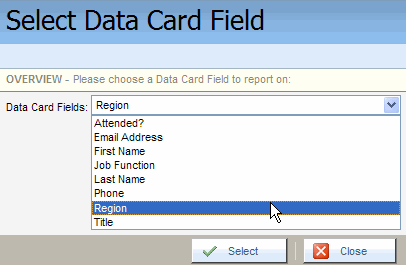
The Report shows all different instances of the values in this field, along with the count for each. You can click on the Custom Object Record Field Value to view all instances of that value.
Note: If there are more than 1,000 different values, they will not be displayed here, but you can Export a report to an Excel .xls file to view them all
- Custom Object Record Field Value Percentages: Shows the percentage for each different type of value for a selected custom object record field.
Note: If there are more than 1,000 different values, they will not be displayed here, but you can Export a report to an Excel .xls file to view them all
- Event Session Overview: Provides specific information
about different event sessions such as the Session Name, Date, Start and End Time, Location or URL, and so on, as well as the custom object record information.

- Event Data: Shows the associated registrants
and their field information, including event fields, for the event.
- Event Registrants and Contact Data: Shows custom object records that have been created during a specified time range.