Working with columns in a report
After you run a report in Insight, you can change the way it displays.
Note: Any changes you make are not saved. If you are an analyzer, you can copy the report and customize how you want the report results to display.
Learn more by watching the video
Learn more by watching the video
- Hiding or showing columns
- Moving columns
- Sorting columns
- Aggregating a column
- Creating sections
- Filtering data in a report
Hiding or showing columns
- To hide a column, right-click the column and click Exclude Column.
- To show a column, right-click any column and click Include Column. Then click the column you want to show. The column appears to the right of the column you clicked.
Moving columns
You can move columns using the right-click menu or by dragging and dropping the column.
- To use the menu, right-click the column and click Move Column. Then click Left or Right.
- To drag-and-drop the columns, move your mouse over the top-border of the column name. When the pointer becomes a move pointer
 , drag the column to the new location.
Sorting columns
To sort columns in ascending or descending order:
- To sort in ascending order, right-click the column name and click Sort Column. Then click Sort Ascending.
- To sort in descending order, right-click the column and click Sort Column. Then click Sort Descending.
To sort more than one column:
When you have data that you want to group together by the same value, you can sort by more than one column .
- Sort the first column.
- Right-click the next column name and click Sort Column. Then click Add Ascending Sort or Add Descending Sort.
To remove column sorting:
- Right-click the column name and click Sort Column. Then click Clear All Sorts in View.
Aggregating a column
If a column shows numeric values, you can aggregate the column using Insight. This removes the column from the report and shows the sum of the column at the top of the report instead.
To aggregate a column:
- After you run a report in Insight, right-click the column name and click Move. Then click To Sections.
The aggregate value of the column appears at the top of the report.

- To remove an aggregate, right-click the column and click Move. Then click To Column.
Creating sections
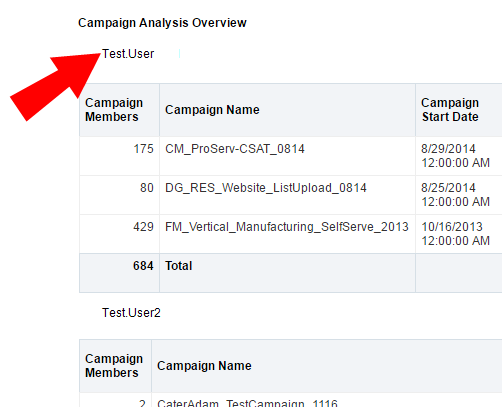
Using Insight, if a report contains rows that could be logically grouped together, you can create sections. Sections break up a report into logical groups based on a common value. Typically, you would section a report by text values, like names.
For example, if you ran the Campaign Analysis Overview report, you could create sections to display the report by campaign creator.
To create sections:
- After you run a report in Insight, right-click the column name and click Move. Then click To Sections.
- To remove a section, right-click the section and click Move. Then click To Column.
Filtering data in a report
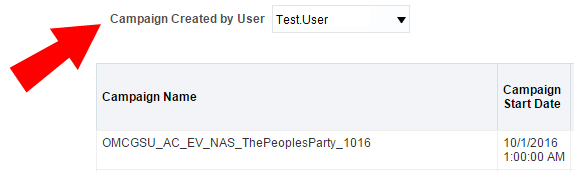
If you want to filter data in an Insight report, you change a column to a prompt. This is an easy way to view a subset of the report's data. After you change a column to a prompt, the values from the column are moved to a drop-down list that appears at the top of the report. For example, if you ran the Campaign Analysis Overview report, you can change the campaign creator column to a prompt. After you make this change, you can then filter the report by campaign creator.
To filter data in a report:
- After you run the report in Insight, right-click the column and click Move. Then click To Prompt.
The column is removed from the report and a drop-down list appears at the top of the report.
- To remove a filter, right-click the section and click Move. Then click To Column.