Damped Trend Additive Seasonal Method
Separates a data series into seasonality, damped trend, and level; projects each forward; and reassembles them into a forecast in an additive manner.
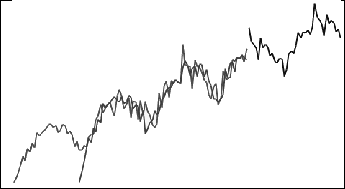
This method is best for data with a trend and with seasonality. It results in a curved forecast that flattens over time and reproduces the seasonal cycles.
Figure B-10 Typical Damped Trend Additive Data, Fit, and Forecast Curve
