Forecasting Use Cases
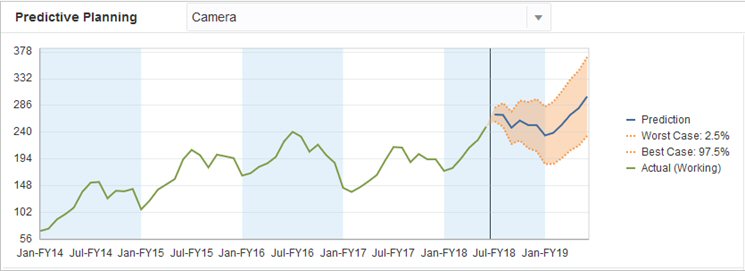
In a planning context, time-series forecasting has several uses. The most common use case is to compare the statistical predictions from Predictive Planning against your own forecast. This generally takes place on a three, six, or twelve month time horizon, and can be performed once at the start of a planning cycle, or on a rolling basis as plans are adjusted based on incoming actuals.
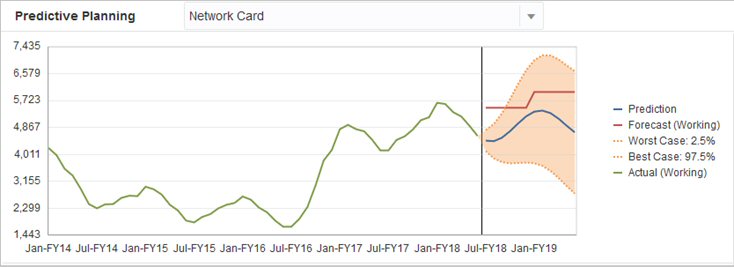
In this example, you can see that the prediction is below the forecast for the coming fiscal year. You can also measure how the forecast lies within the prediction’s 95% confidence interval (orange band). Using this information, you can decide to adjust the forecast for the fiscal year, or take other actions that mitigate the forecasting gap.

If you haven't supplied a forecast, or can't generate one for the fiscal year, you can decide to use the prediction as your own forecast. You can copy and paste the prediction results into the form and save the results.

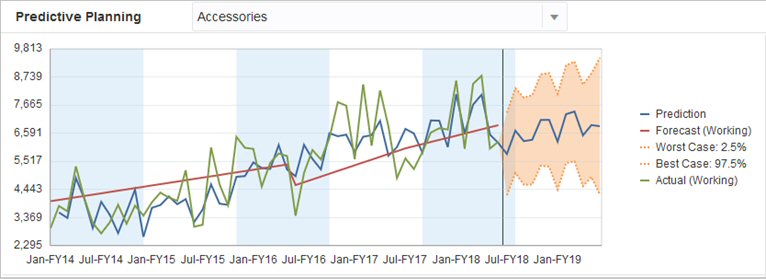
You can also compare the historical predictions against the historical forecasts to determine the accuracy of each, assuming that predictions have been saved in a separate scenario. By turning on the historical view in the chart, you can gauge how far the forecast (red line) and the predictions (blue line) have diverged from the actuals (green line) in the past. For this member, it appears that the prediction had smaller variance than the forecasts against the actuals.
