Introduction
This tutorial shows you how to enter data within the FreeForm Business Process. The sections build on each other and should be completed sequentially.
Background
With FreeForm, you can create an application with the cubes and dimensions of your choice without being constrained by the cube and dimension limitations imposed by standard applications. You can model and build your own cubes while preserving the ability to leverage business process functionalities.
You enter data on forms. You use form elements to navigate between different views of data and perform different actions on data.
You can access Freeform from Oracle Cloud Enterprise Performance Management (EPM) or Oracle Smart View for Office. Both support Groovy scripts for custom functions, and business rules for calculations.
When you access FreeForm from Cloud EPM, you log on to an EPM instance and open your FreeForm app. You then navigate to a spreadsheet-like template to review and modify data.
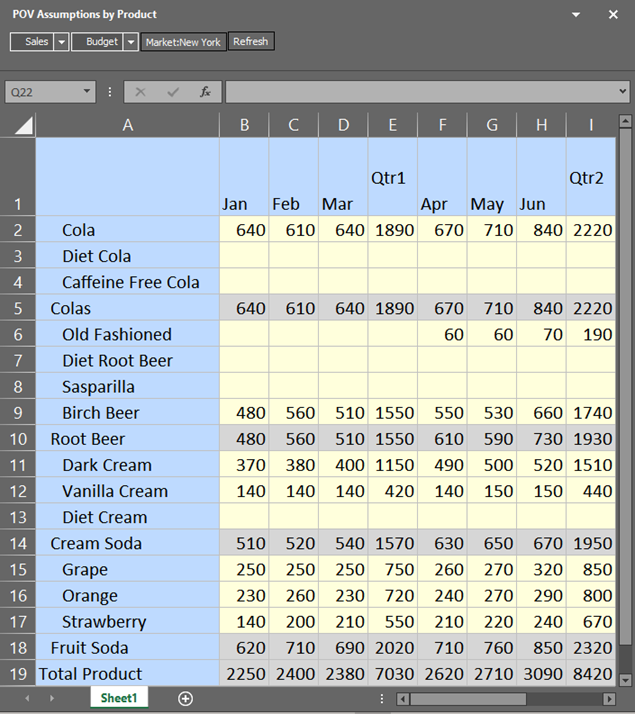
When you access FreeForm from Smart View, you open a spreadsheet in Excel and connect to your FreeForm business process. You then open a spreadsheet-like template called a form to review and modify data.
Prerequisites
Cloud EPM Hands-on Tutorials may require you to import a snapshot into your Cloud EPM Enterprise Service instance. Before you can import a tutorial snapshot, you must request another Cloud EPM Enterprise Service instance or remove your current application and business process. The tutorial snapshot will not import over your existing application or business process, nor will it automatically replace or restore the application or business process you are currently working with.
Before starting this tutorial, you must:
- Have Service Administrator access to a Cloud EPM Enterprise Service instance.
- Upload and import this snapshot (Sample_LCM_updatedv3.zip) into your FreeForm instance.
- Set the navigation flow to Sample.
Note:
If you run into migration errors importing the snapshot, re-run the migration excluding the HSS-Shared Services component, as well as the Security and User Preferences artifacts in the Core component. For more information on uploading and importing snapshots, refer to the Administering Migration for Oracle Enterprise Performance Management Cloud documentation.Assigning Values to User Variables
User Variables were added when the business process was created. User variables act as filters in forms, enabling planners to focus only on certain members. In this section, you set values for user variables.
On the home page, click
 (Navigator), and under Tools, click User Preferences.
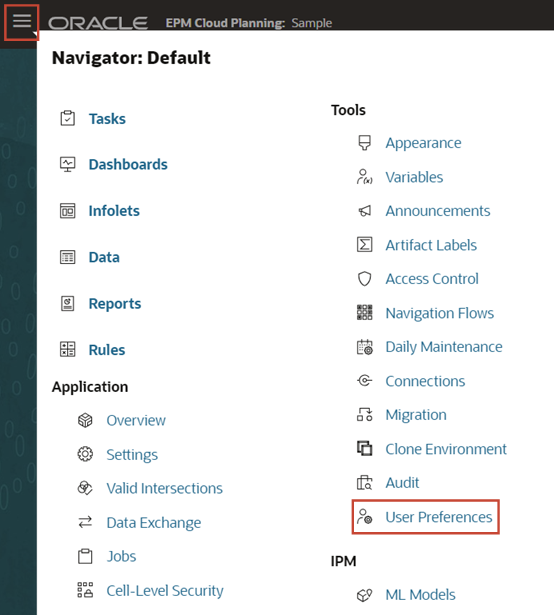
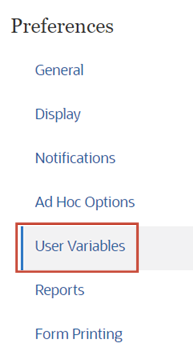
Under Preferences, click User Variables.
For Market, click its
 (Member Selector) and select New York as the variable's value.
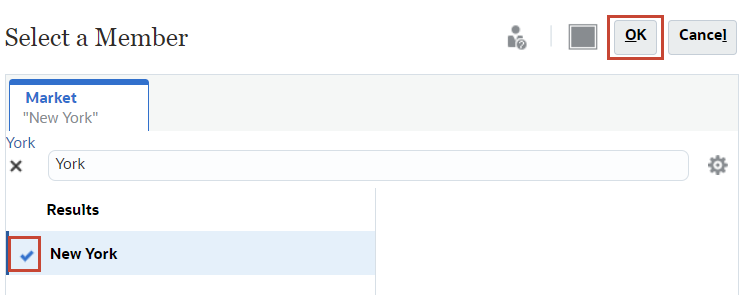
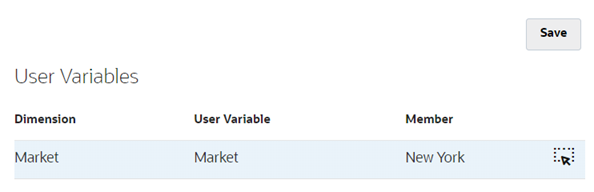
Verify your selection and click Save.
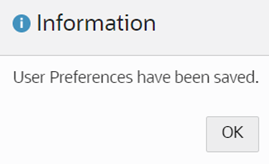
At the information message, click OK.
About Forms
You work with and analyze data and develop your plans in spreadsheet-like templates called forms. Structured forms help you focus your attention on a specified slice of data so you can review and modify your plans.
Form Design
Each form has a purpose. For example, the administrator may design a form solely for creating a revenue plan for your product line or for comparing last year's actual expenses against this year's projected expenses.
With the form's objective in mind, the administrator sets up the form with specific dimensions and members, reflected in the row and column headings. An example of a dimension is Year, and its members may include FY21, FY22, and FY23.
Cells display data for the selected members.
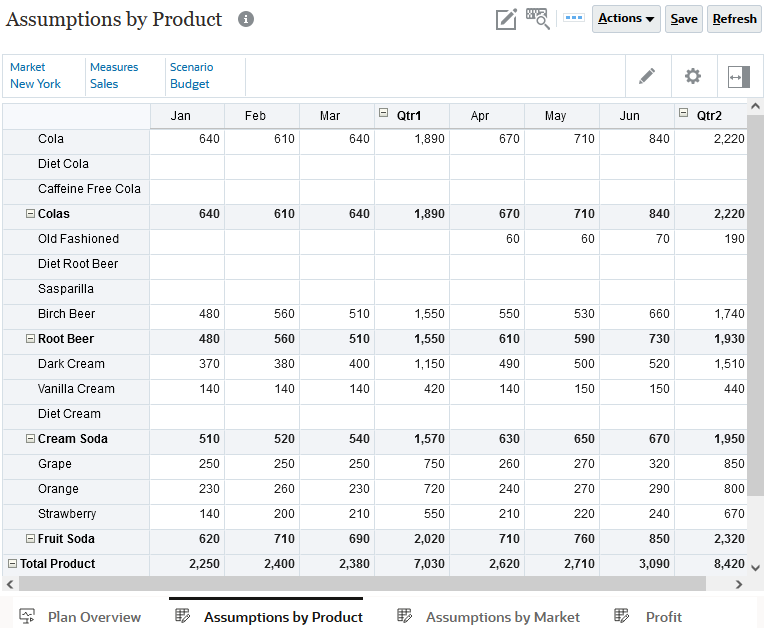
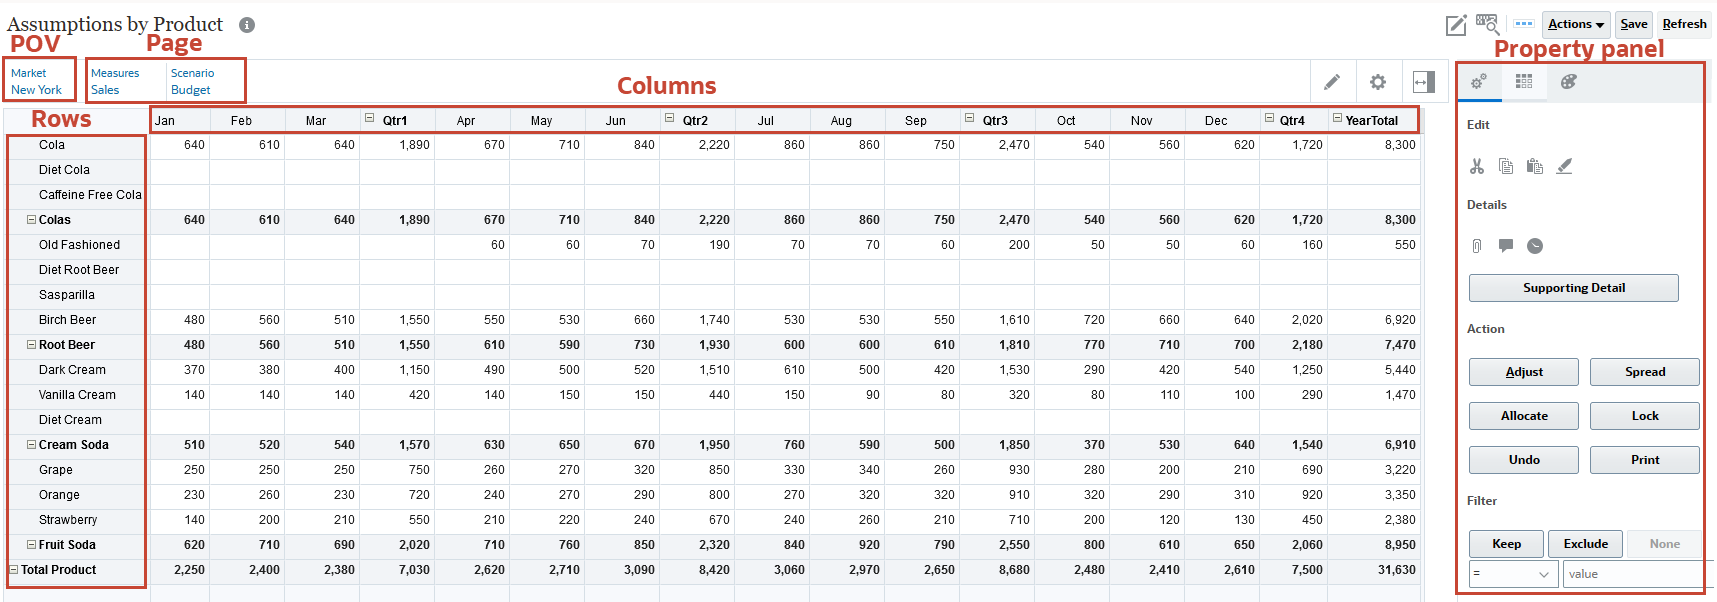
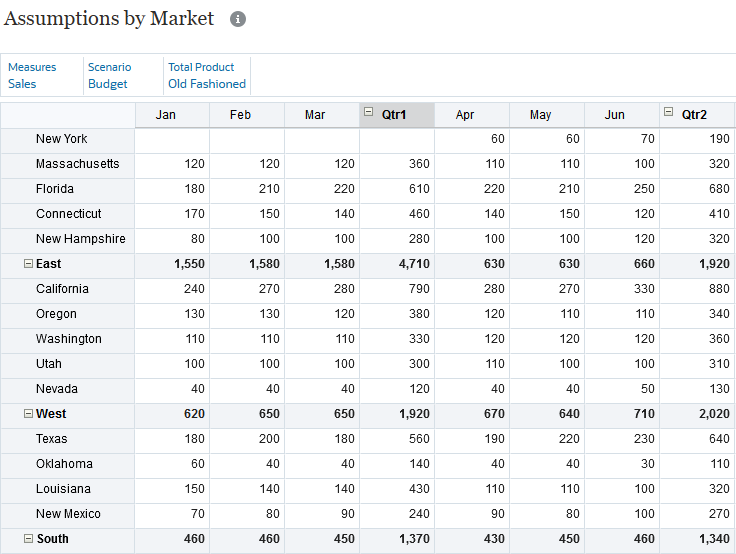
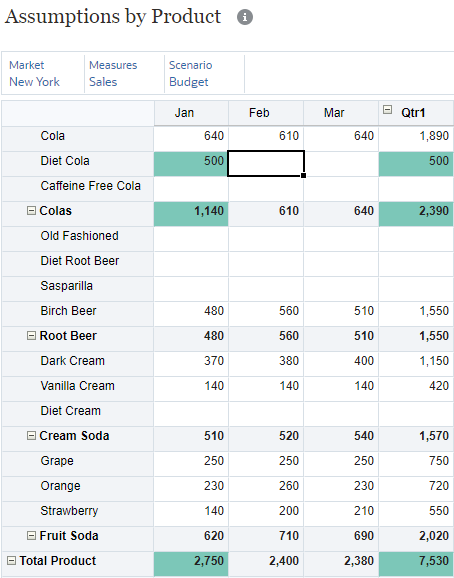
The following example shows a form for reviewing and entering assumptions for product sales by market:
You can review existing data, and make changes to data only in cells for which you have access. Your administrator sets up forms for you, and sets up who can view and change which data.
Form Context
You set the Point of View (POV) before you review or enter data. The members displayed in the POV show the context of the data in the pages, rows, and columns. You select page members from one or more dimensions for data entry. The rows and columns on the form show values for the currently selected page members. Row and column headings show the members that are available on the form.
Tip:
In this example, to work with a different group in the Product dimension, you can click the link under Total Product at the top of the form, and select a different product.Typically, forms include the following sections:
- Icons -
 (Form Designer; only for Administrators and Power Users),
  (Find icon), buttons to access the Actions menu, Save data, and Refresh form data
 - A POV, that allows you to select the member data intersection to work with
- Data cells or a grid similar to a spreadsheet
- A Property panel with a Data tab, Ad Hoc tab, and Format tab to make data more meaningful by adding data details, focusing your analysis with Ad Hoc Grids, and formatting data to define the font, size, and color
Actions Menu on Forms
Service Administrators can create right-click (or action) menus and associate them with forms, enabling users to click rows or columns in forms and select menu items to:
- Launch a URL
- Launch a business rule, with or without runtime prompts
- Move to another form
You can display the right-click menu by right-clicking in rows, columns, POV, or cells.
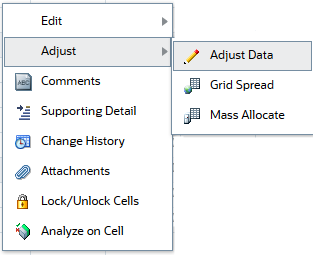
The context of the right-click is relayed to the next action: the POV and the Page, the member the user clicked on, the members to the left (for rows), or above (for columns).
Automatically Saving Data
Your administrator can set up a form so that when you move out of a cell, your changes are automatically saved, with no prompt or message. Cell values are totaled and the affected cells are displayed with a green background. If the structure of the form has not changed since you started working in it, when you save your data, your changed or new data is instantly saved.
If the form is not set to automatically save, then after you enter data, you can revert to the data on the form before you changed it, by clicking Refresh.
Navigating FreeForm
When you access FreeForm in Cloud EPM, you can easily navigate to pages for common tasks from the Home page.
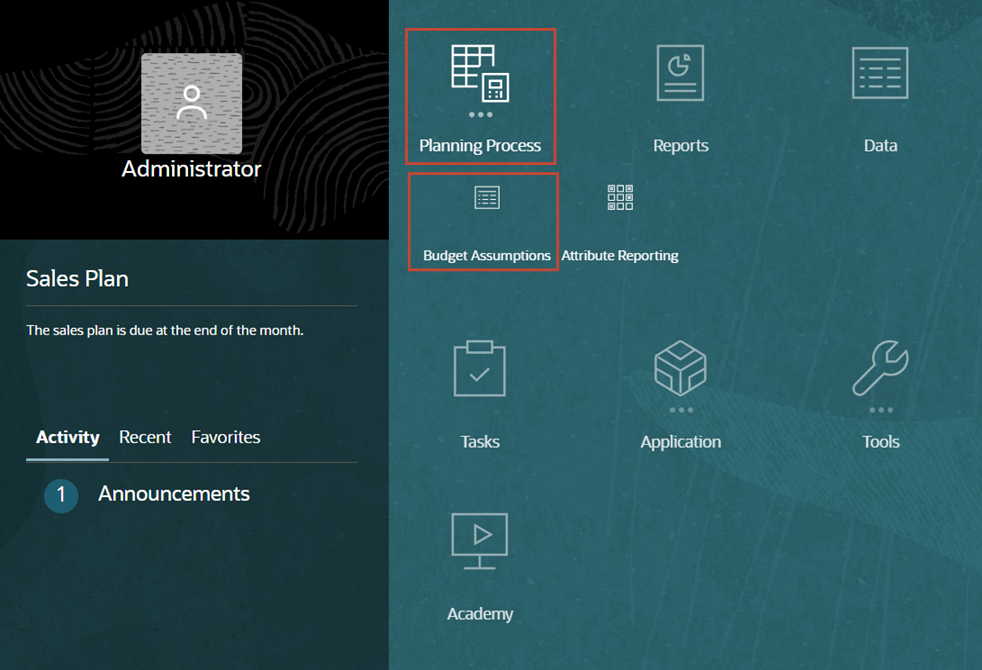
- From the Home page, click Planning Process, then Budget Assumptions.
Note:
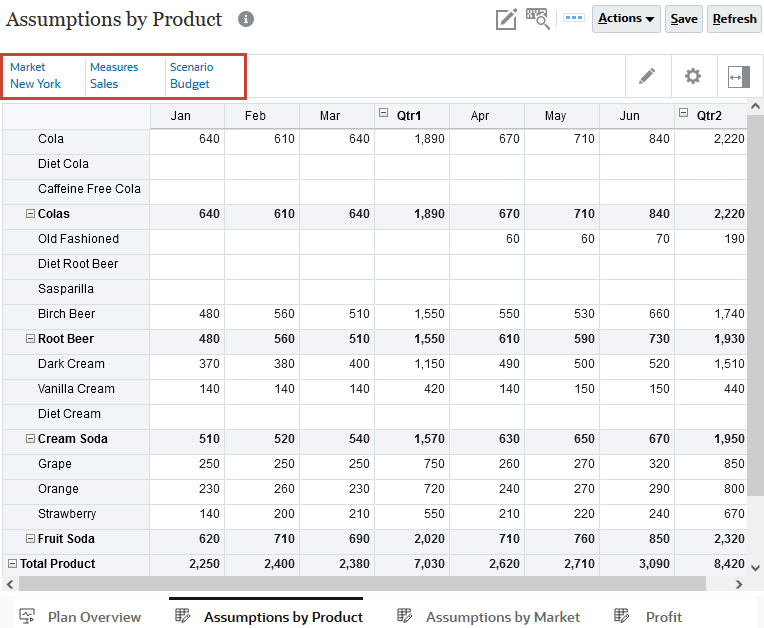
This home page is specific to the snapshot and navigation flow mentioned in the Prerequisites. - At the bottom, click Assumptions by Product.
The Assumptions by Product form is displayed. This form displays data by product for the specified market, measure, and scenario. In this example, budgeted sales assumptions for the specified market are displayed for the listed products for the months, quarters and year.
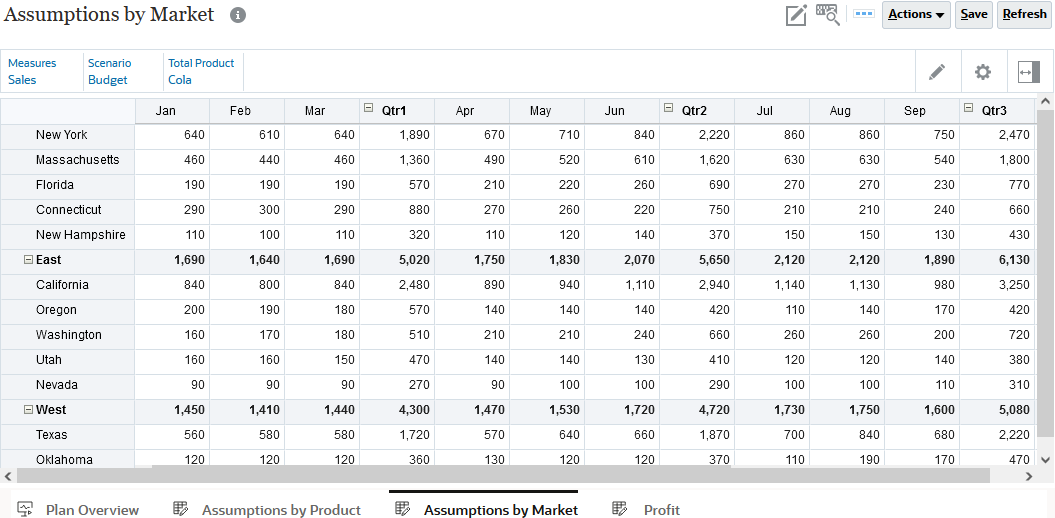
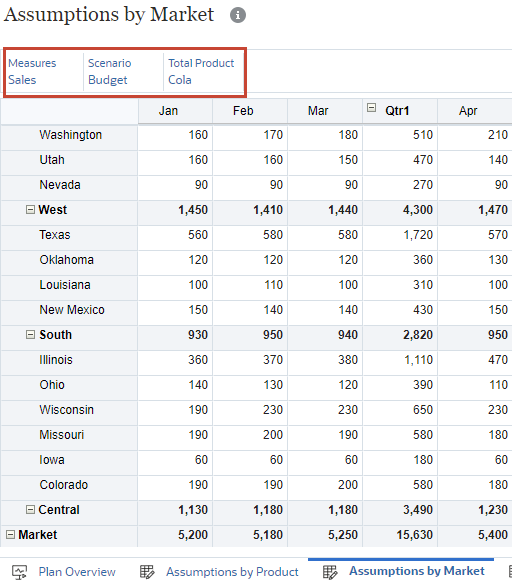
- Click Assumptions by Market.
The Assumptions by Market form is displayed. This form displays data by market for the specified measure, scenario and product. In this example, budgeted sales assumptions for Cola are displayed for the listed markets for the months, quarters and year.
Selecting Different Data to Work With
In this section, you learn about form sections such as the POV, pages, columns, and rows and learn about navigation keys to aid with form navigation.
Setting the POV on Forms
When reviewing or modifying data, you use form elements to navigate between different views of data and perform different actions on data.
You set the POV before you enter data.
- The members displayed in the POV show the context of the data in the pages, rows, and columns.
- You select page members from one or more dimensions for data entry.
- The rows and columns on the form show values for the currently selected page members.
- Row and column headings show the members that are available on the form.
If your administrator sets up a form with at least one user variable and enabled dynamic user variables, then you can select and change user variable values directly in that form. For example, for a variable called Department, you can select Sales members to plan sales expenses and then select Marketing members to plan marketing expenses. You can also set values for user variables in user preferences.
If the form was defined with the Use Context option, then user variables can be used in the POV. With this setting, the value of the user variable changes dynamically based on the context of the form.
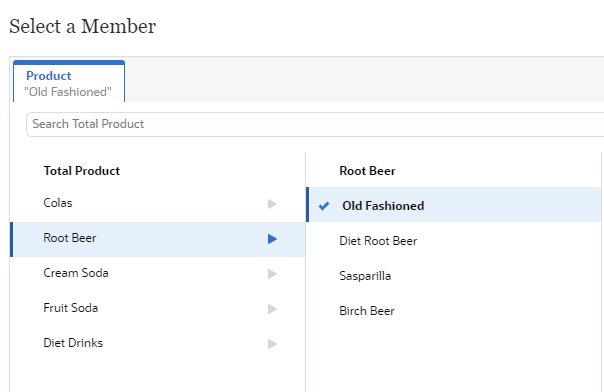
- On the Assumptions by Market form, click Total Product.
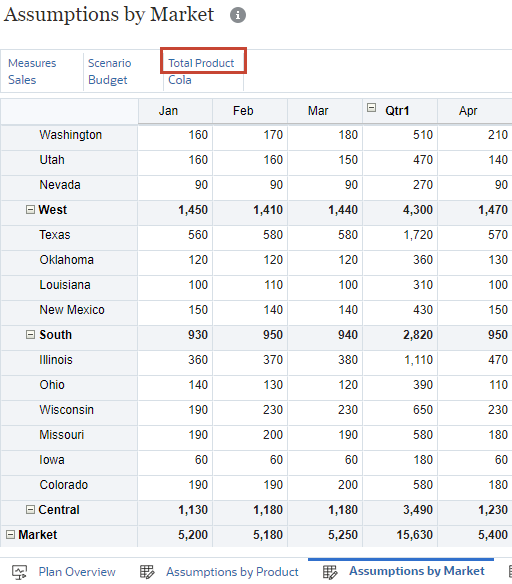
- In Member Selector, select Root Beer, then Old Fashioned, and click OK.
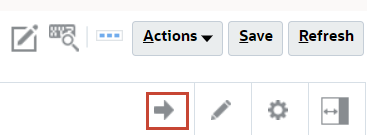
- In Assumptions by Market, click
 (Go).
(Go).
- Compare the assumptions for the Central market to those in the East, West, and South markets.
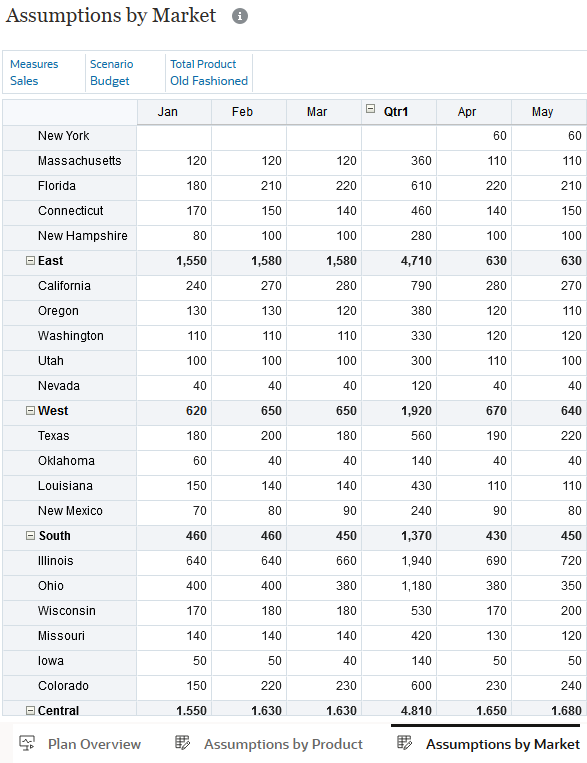
The Old Fashioned product is budgeted to have greater sales in the Central region than any other region.
Expanding and Collapsing Summary Level Members on Planning Forms
You can hide the children of parent members so that you can navigate forms more easily when forms contain a large number of members in the rows and columns.
- For West, click
 (Collapse).
The West region is collapsed and the western markets are no longer visible on the form.
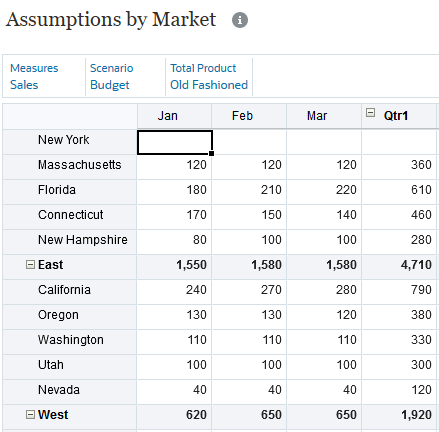
- For Qtr1, click (Collapse).
The first quarter is collapsed and January, February, and March are no longer visible on the form.
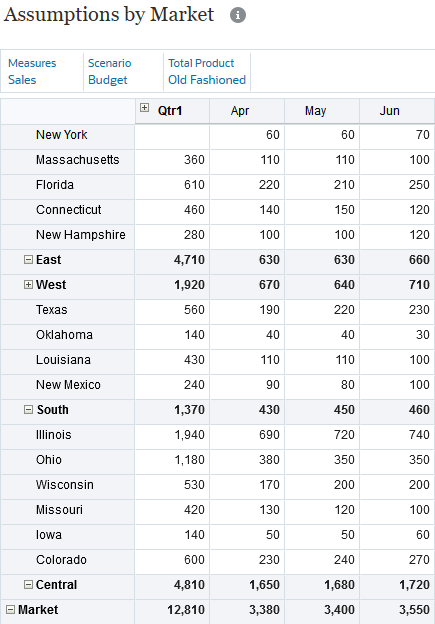
- For West, click
 (Expand).
The western markets are visible on the form.
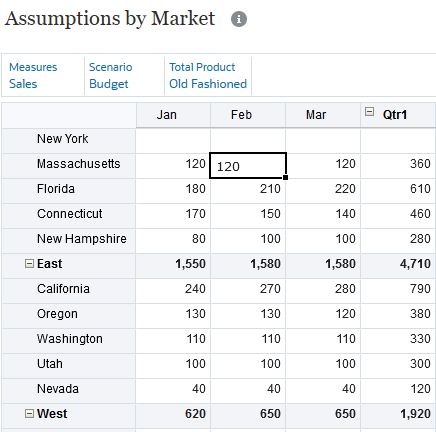
- For Qtr1, click (Expand).
January, February, and March are visible on the form.
Navigation Keys for Forms
You navigate between cells, similar to a spreadsheet. The following table describes navigation key options:
| Key | Result |
|---|---|
| Enter | Enters a value and moves the cursor to the cell below the current cell in the column. |
| Tab | Enters a value and moves the cursor to the next cell in the row. |
| Shift + Tab | Enters a value and moves the cursor to the previous cell in the row. |
| Shift + Enter | Moves to the previous cell in the column. |
| Up Arrow, Down Arrow | Moves up or down to the previous or next row. |
| Ctrl + Home | Moves to the first cell in the form. |
| Ctrl + End | Moves to the last cell in the form. |
| Ctrl + Left Arrow | Moves to the first cell in the current row. |
| Ctrl + Right Arrow | Moves to the last cell in the current row. |
| Shift + End | Moves to the last cell Of the first row. |
| Ctrl + A | Selects all cells. |
| Shift + Space | Selects the row. |
| Ctrl + Space | Selects the column. |
| Ctrl + Alt + E | Moves out of the form to the previously selected item. Use Tab to return to the form. |
| Esc | Discards the current changes in the cell, restoring the previous state. |
- On the Assumptions by Market form, within the sales budget for Old Fashioned, ensure your cursor is in the January cell for New York, and press Enter.
The cursor is moved to the cell below the New York cell which is January for Massachusetts.
- Press the Tab key.
The cursor is moved to the next cell, the February cell for Massachusetts.
- Press Shift + Tab.
The cursor is moved to the previous cell in the row, January for Massachusetts.
- Press Control + Home.
The cursor is moved to the first cell in the form.
Distinguishing Form Data with Visual Cues
In this section, you learn about visual cues that distinguish types of data. Forms use colors to indicate cell conditions.
Visual Cues Overview
- White means that you can enter data in these cells.
- Yellow cells indicate that you have changed values but haven't yet saved them. We call these dirty cells.
- Gray cells indicate that you can see, but not change, their values. They are read-only.
- Locked cells are also grayed out with a lock icon.
- Teal cells have supporting detail.
- Cells with validation rules may also change colors depending on what color was selected when the rule was defined.
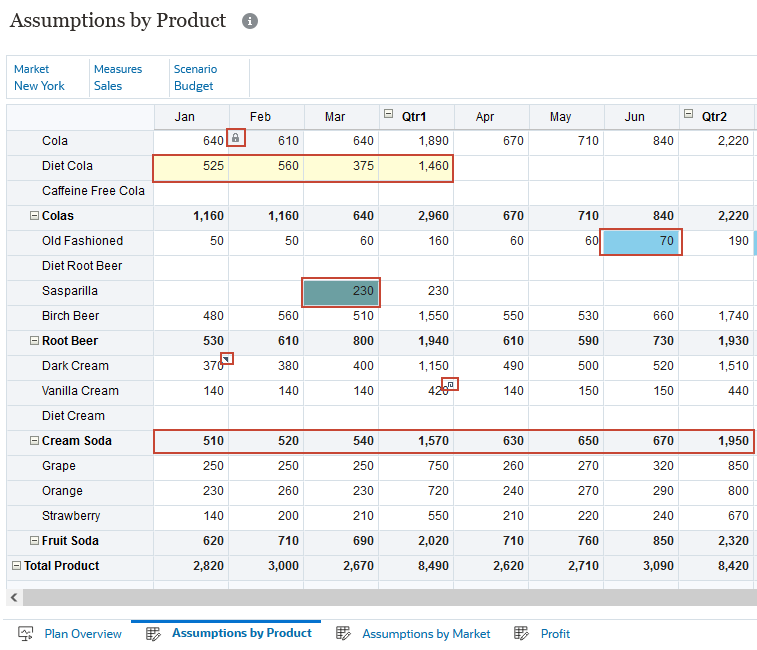
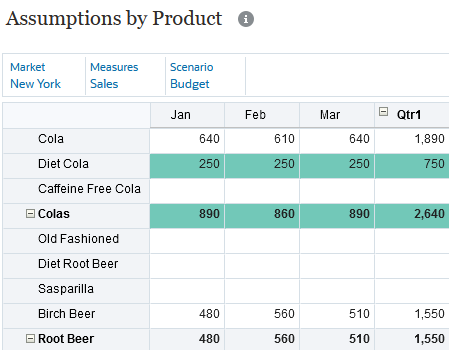
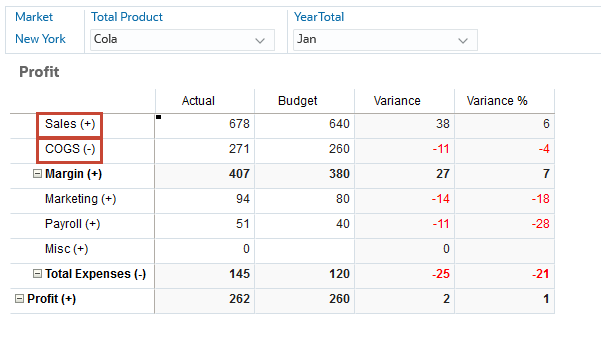
In the form example, notice the following visual cues::
- Cola for February is locked. There is a padlock on the February cell.
- Data was changed for Diet Cola. Those cells are yellow.
- June for Old Fashioned has met criteria for a data validation rule so the color is changed to blue.
- March for Sasparilla has supporting detail which is indicated in a Teal color.
- January for Dark Cream has a comment indicated by an icon in the upper right corner of the cell.
- Qtr1 for Vanilla Cream has an attachment and an icon representing the attachment is displayed.
- The Cream Soda row is read-only. Those cells are gray.
Viewing Consolidation Operators on Forms
The member consolidation operators control the way data values are rolled up, from child members in the hierarchy to their parents.
Consolidation (aggregation) operators are:
- + Addition
- - Subtraction
- * Multiplication
- / Division
- % Percent
- ~ Ignore
- ^ Never (don't aggregate, regardless of hierarchy)
Consolidation operators are shown on forms if included in the form design.
Identifying Date Fields, Text Fields, and Smart Lists on Forms
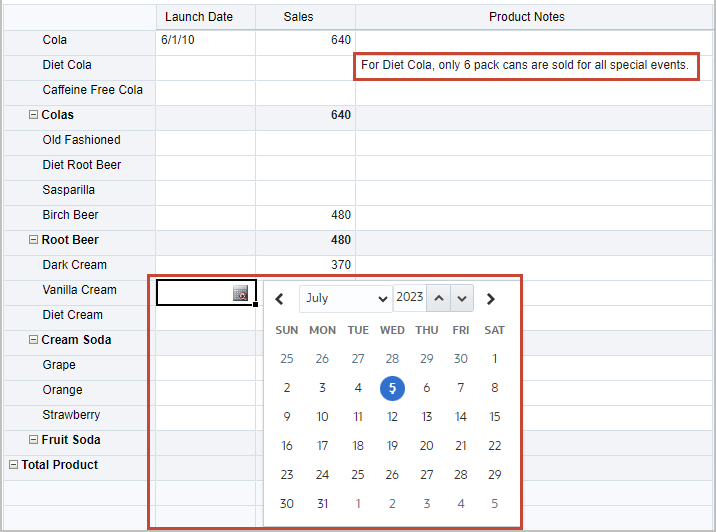
For a date field, you can either enter a date, or click on the calendar and then select a date. For text fields, you can enter alphanumeric data.
For some fields, you can select an option from a predefined Smart List.
Entering Different Types of Data
In this section, you learn about entering data in level zero and summary time periods. You enter numeric data, Smart List data, dates, and text data.
You can enter data in many ways, depending on how your administrator set up the form:
- Enter data directly in the cell.
- If a data cell displays the Down Arrow, you select a value from a list, called a Smart List. You can skip to a value by typing its first one or two letters. For example, in a list of accounts, skip to Inventory by typing I.
- When you click into a cell that is set up as a ate, you can enter the date or click on the calendar icon to select a date.
- When you click into a cell that is set up for text data, a box is displayed. Enter your text into the box.
Tip:
When you enter text in cells, don’t use angle brackets (< >). The maximum length of text data you can enter is 4000 characters.For forms, you can use shortcuts to enter numeric data. Enter the keys or symbols, and press Enter.
| Keys or Symbol | Result | Example |
|---|---|---|
| K | Enters the value in thousands. | Enter 5K for 5,000. |
| M | Enters the value in millions. | Enter 5M for 5,000,000. |
| Add or + | Adds a number to the cell value. | If the cell value is 100, entering Add10 after 100 results in 110. |
| Sub or ~ | Subtracts a number from the cell value. | If the cell value is 100, entering Sub10 after 100 results in 90. |
| Percent or per | Multiplies the cell value by the percentage you enter. | If the cell value is 100, entering per10 after 100 results in 10% of the current cell value, or 10. |
| Increase or inc | Increases the cell value by the percentage you enter. | If the cell value is 200, entering inc10 after 200 increases the cell value by 10% of 200 (20), to 220. |
| Decrease or dec | Decreases the cell value by the percentage you enter. | If the cell value is 200, entering dec10 after 200 decreases the cell value by 10% of 200 (20), to 180. |
| Power or pow | Changes the cell value to the number, added as an exponent. | If the cell value is 100, entering pow2 after 100 multiplies the cell value by an exponent of 2, to 10,000. |
| gr | Grows a cell by a percentage. | If the cell value is 200, entering gr50 after 200 increases the cell value by 100, to 300. |
Entering Numeric Data
- At the bottom, click Assumptions by Product.
- Ensure the POV and Page members include the following:
- Market: New York
- Measures: Sales
- Scenario: Budget
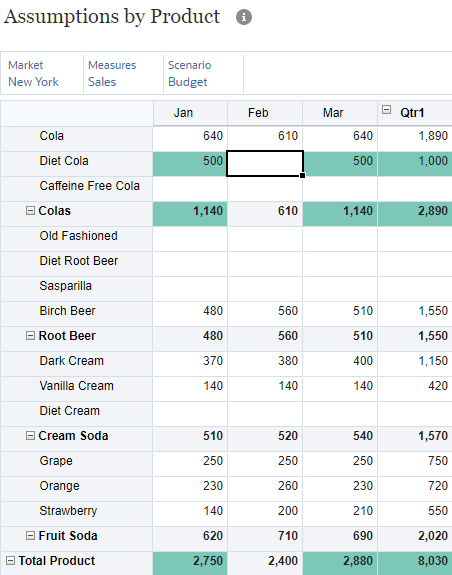
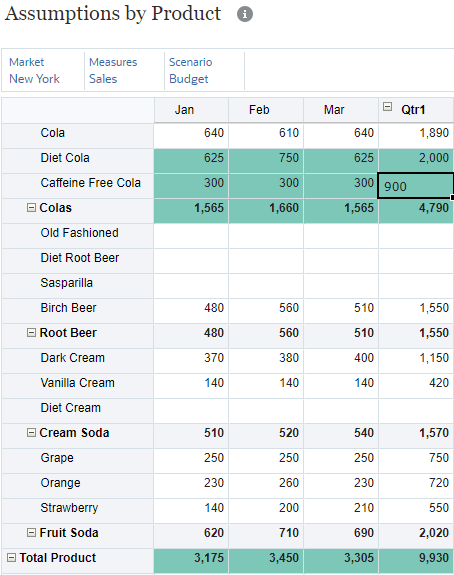
- For Diet Cola, in January, enter 500, and press Tab.
Since this form is set up to save data automatically, values are saved after entering them and the background color of the cells turn green. The data on the form is automatically calculated, including the parent members. In this example, Qtr1, Colas, and Total Product for January are calculated.
- Click in the March cell for Diet Cola, enter 500, and press Shift + Tab.
The Qtr1, Colas, and Total Product for March are calculated.
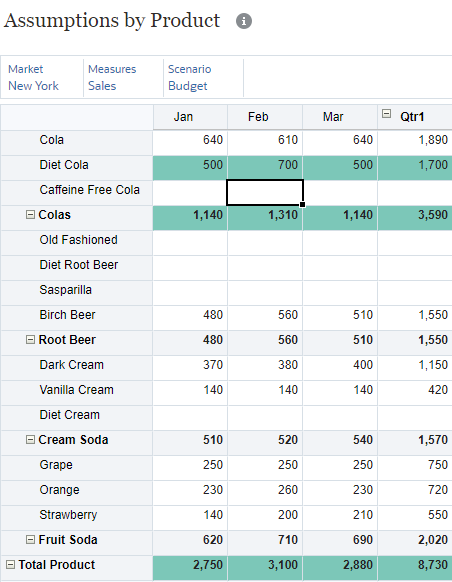
- In February for Diet Cola, enter 700, and press Enter.
The Qtr1, Colas, and Total Product for February are calculated.
- Press Control + Z.
The value for February is deleted. Control + Z executes an undo action.
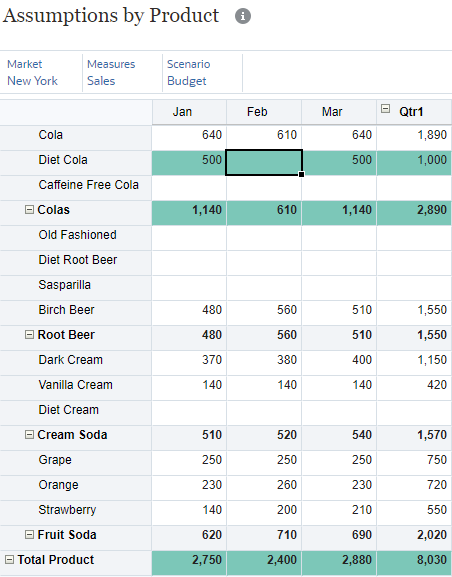
- In February for Diet Cola, enter 600, and press Enter.
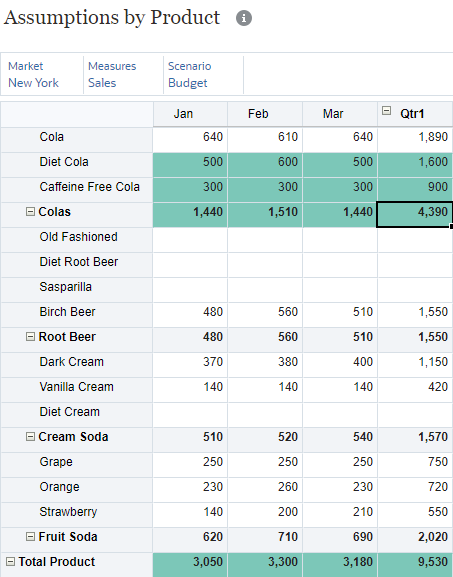
- In Qtr1 for Caffeine Free Cola, enter 900, and press Enter.
The data is spread evening to the months in the first quarter. Colas and Total Product are calculated.
- In Qtr1 for Diet Cola, enter 2000, and press Enter.
The data is spread proportionally to the months in the first quarter. Colas and Total Product are calculated.
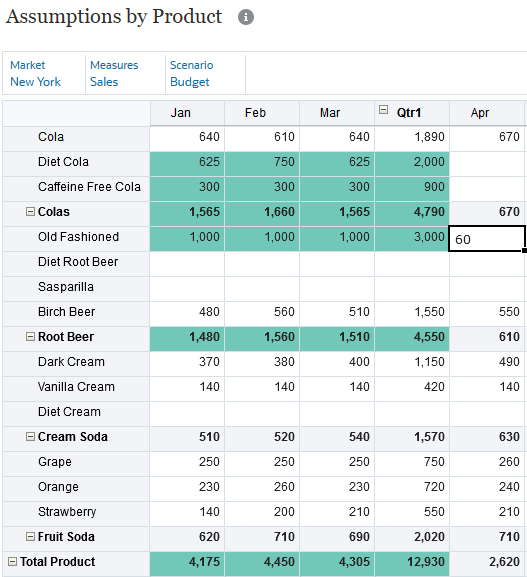
- For Old Fashioned, in Qtr1, enter 3k, and press Tab.
The updated data is saved and spread equally between the months in Qtr1.
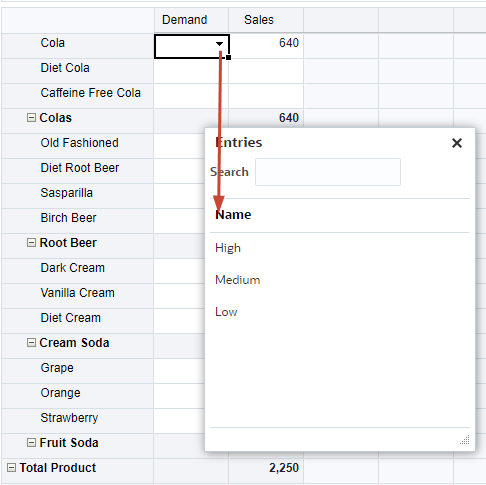
Entering Data Using Smart Lists
In this section, you enter form data by selecting a value from a Smart List.
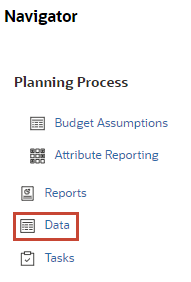
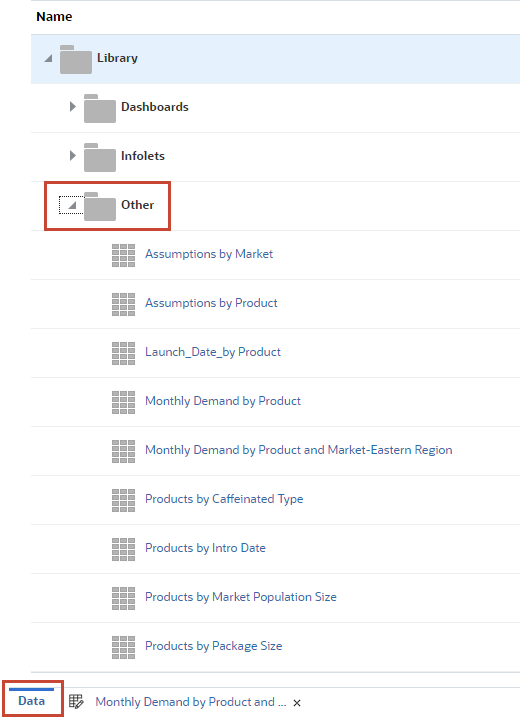
- Click (Navigator) and under Planning Process, select Data.
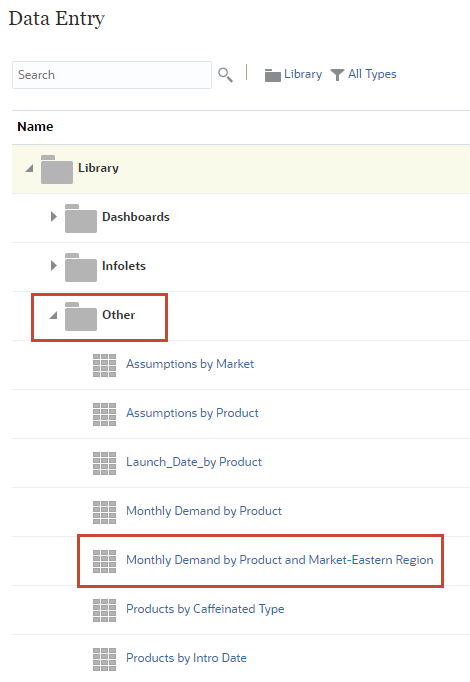
- In Data Entry, click
 (Expand) for Other.
 - Click Monthly Demand by Product and Market-Eastern Region to open it.
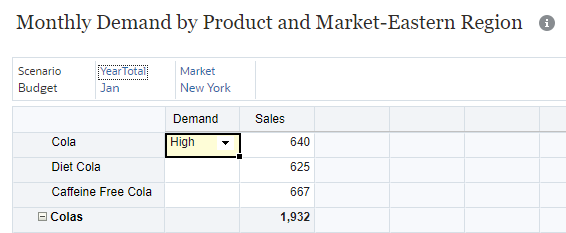
- For Cola, in Demand, click the down arrow, and select High.
Note:
You can skip to a value by typing its first one or two letters. For example, in the list, skip to High by typing h.The form is not set up to save automatically. The cell's background color changed to yellow indicating that the data was changed but not yet saved.
- For Diet Cola, in Demand, click the down arrow, and select Medium.
- For Strawberry, in Demand, click the down arrow, and select Low.
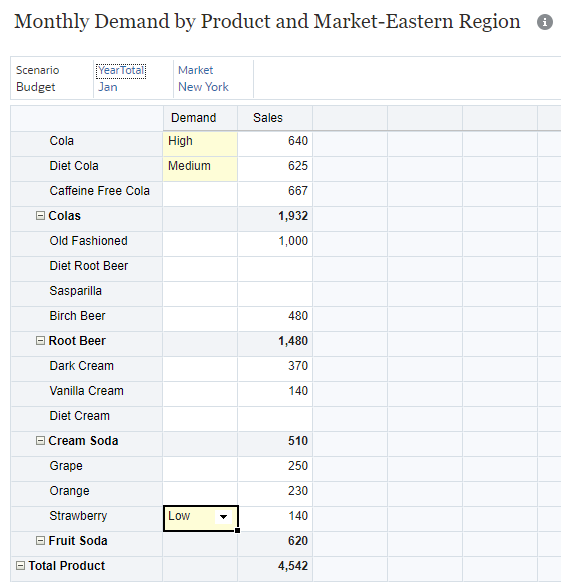
- Click Save.
- For Strawberry, in Demand, click Low.
- On your keyboard, press Delete to remove the value in the cell.
The value is deleted and the cell background color turns yellow.
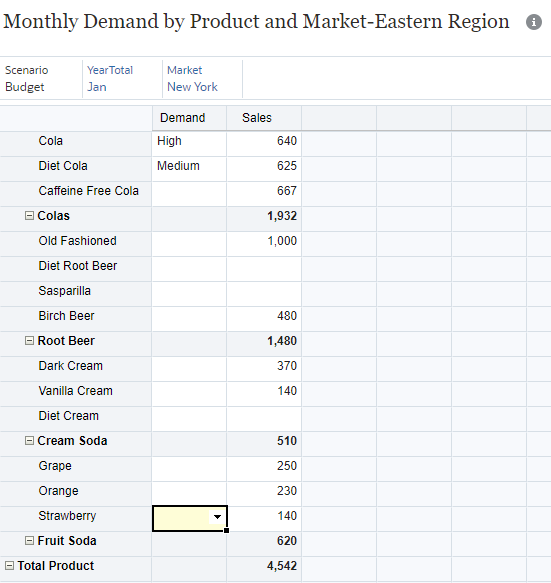
- Click Save.
Entering Text Data, and Dates
In this section, you enter text data, and dates.
- At the bottom, click Data.
- Click (Expand) for Other.
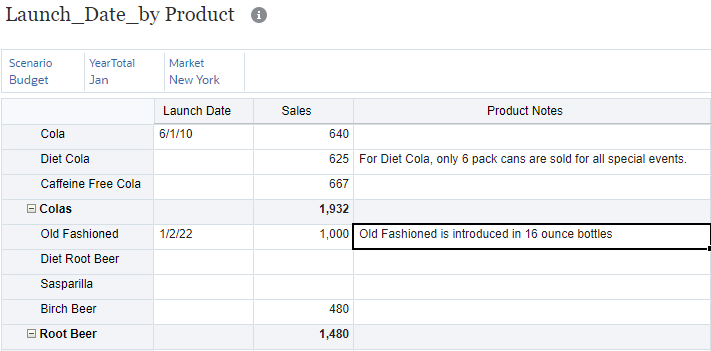
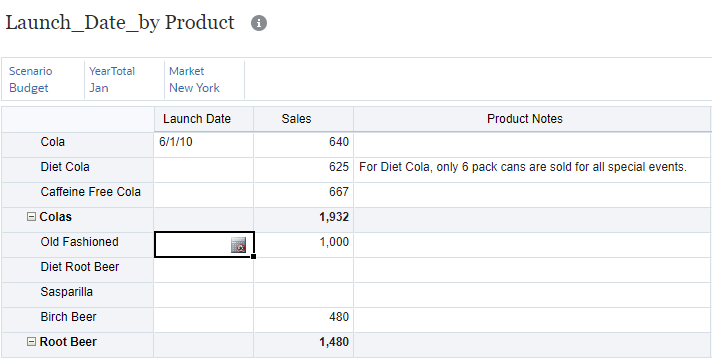
- Click Launch_Date_by_Product to open it.
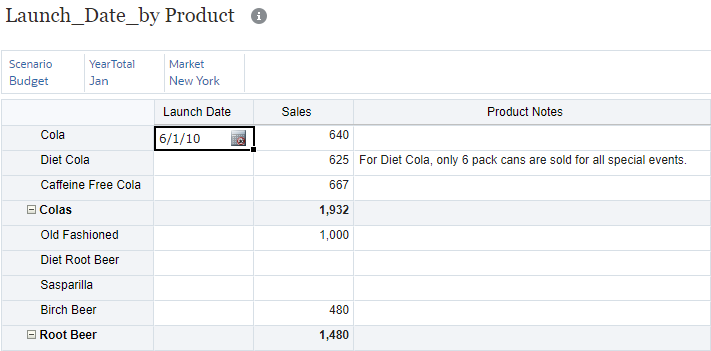
- For Old Fashioned, click the Launch Date cell.
The calendar icon is displayed for the cell.
- Click
 (Calendar).
 - Select a date of January 2, 2022.
- For Old Fashioned, click the Product Notes cell.
- Enter the following: Old Fashioned is introduced in 16 ounce bottles, and in the dialog box click Save.
- In Launch_Date_by_Product, click Save.
The form data is saved.