Introduction
This 25-minute hands-on tutorial shows you how to run simulations to help improve forecast accuracy in Strategic Modeling, a solution provided by Oracle EPM Enterprise Planning. Running simulations allows you to visualize scenarios in your model using a range of results for each uncertain input. The sections build on each other and should be completed sequentially.
Background
Strategic Modeling Simulations use the Monte Carlo method to automatically generate hundreds of “what if” scenarios for your model. Each “what if” scenario is considered one trial of the simulation.
Before running simulations, you must first identify the uncertain inputs in your model. These are called “assumptions” and you describe the uncertainty for each one by selecting a probability distribution from a gallery. You then identify the key outputs of interest in your model. These are called “forecasts”.
During each trial of the simulation, random numbers are generated for each of the assumptions according to the range you defined. The model is recalculated, and the output values are retrieved and added to the forecast charts. This process repeats until either the maximum number of trials is reached, or until you stop the simulation.
In general, the more trials you run in a simulation, the greater the accuracy of the statistics and percentiles information shown in the forecasts. The final forecast chart reflects the combined uncertainty of the assumption cells on the forecast cell.
In Strategic Modeling, two types of simulations are supported:
- Monte Carlo sampling generates natural, “what-if” type scenarios where each assumption is sampled randomly.
- Latin Hypercube sampling generates more accurate statistics and percentiles by sampling each assumption more evenly across its range.
Prerequisites
Cloud EPM Hands-on Tutorials may require you to import a snapshot into your Cloud EPM Enterprise Service instance. Before you can import a tutorial snapshot, you must request another Cloud EPM Enterprise Service instance or remove your current application and business process. The tutorial snapshot will not import over your existing application or business process, nor will it automatically replace or restore the application or business process you are currently working with.
Before starting this tutorial, you must:
- Have Service Administrator access to a Cloud EPM Enterprise Service instance. The instance should not have a business process created.
- If you haven't already, register for a free Oracle Cloud Customer Connect account so you can
access the required files.
- Download the latest EPBCS Sample Application LCM snapshot from this idea page.
- Upload and import the latest EPBCS Sample Application LCM snapshot into your Planning instance.
Note:
Data in the sample application may vary due to changes over time and across financial years.
Note:
If you run into migration errors importing the snapshot, re-run the migration excluding the HSS-Shared Services component, as well as the Security and User Preferences artifacts in the Core component. For more information on uploading and importing snapshots, refer to the Administering Migration for Oracle Enterprise Performance Management Cloud documentation.Preparing the strategic model
Navigating to Strategic Modeling
- On the Planning home page, click Strategic Modeling then
Models.
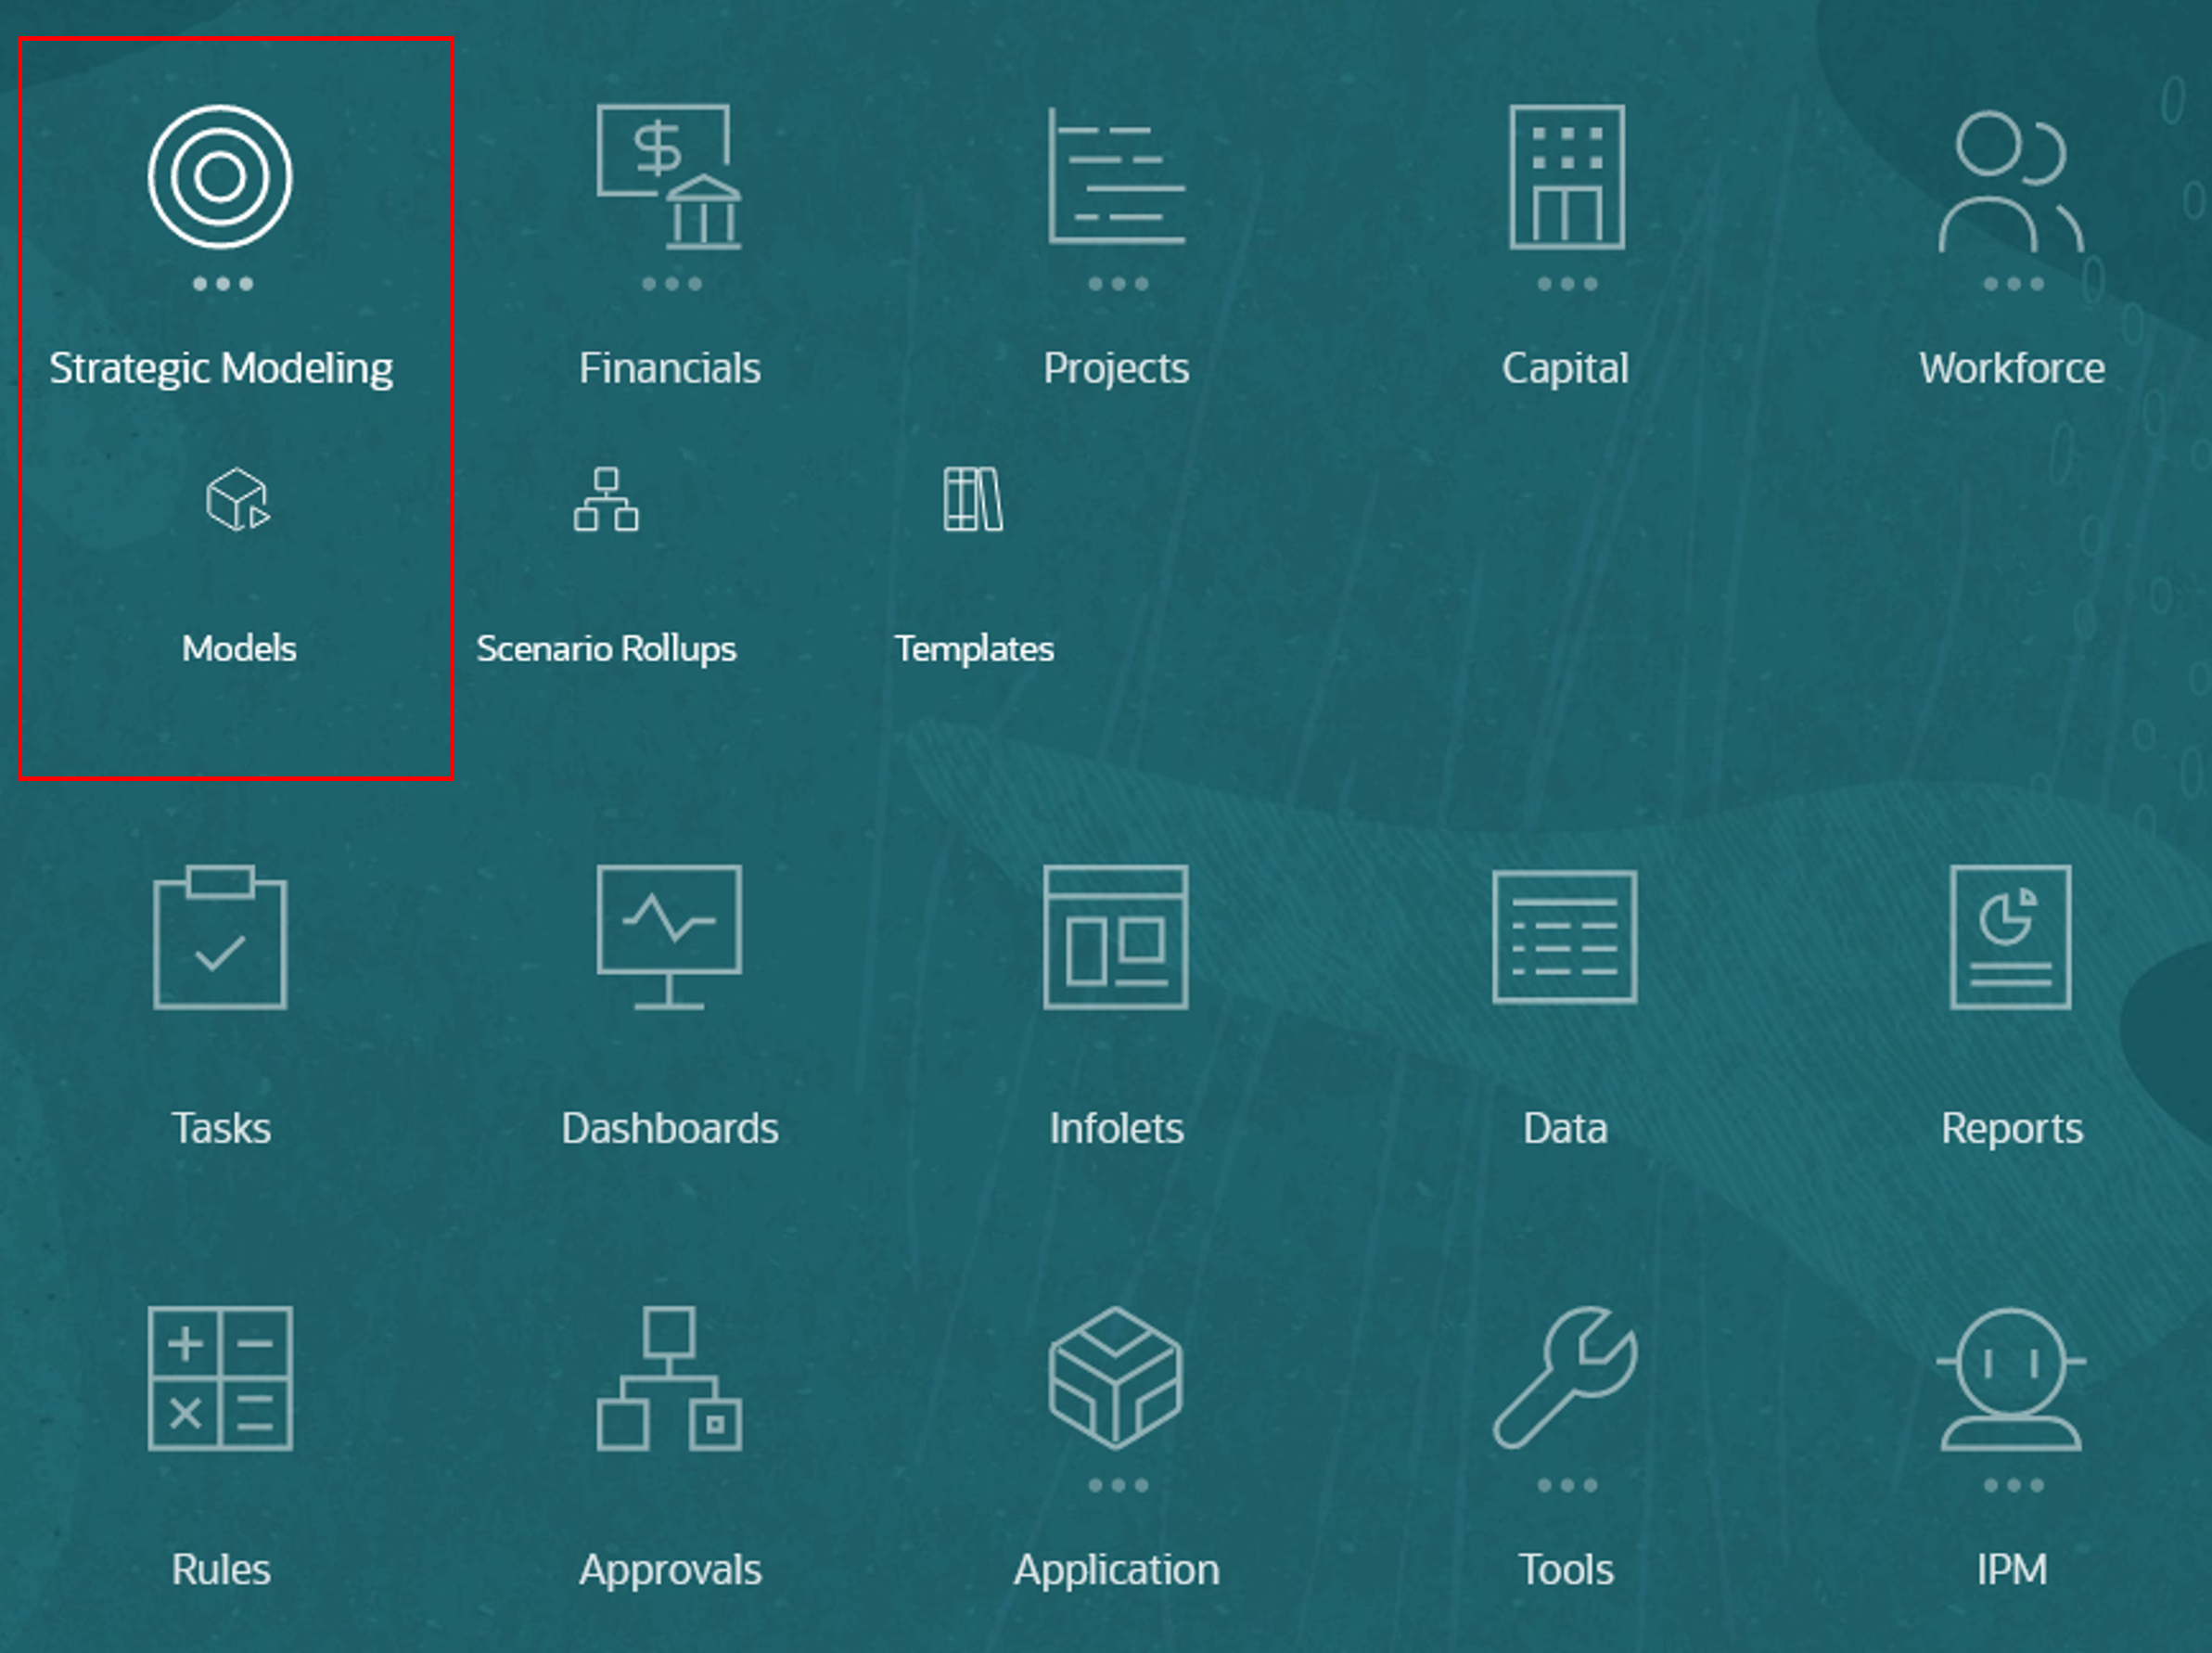
The Models page is displayed.
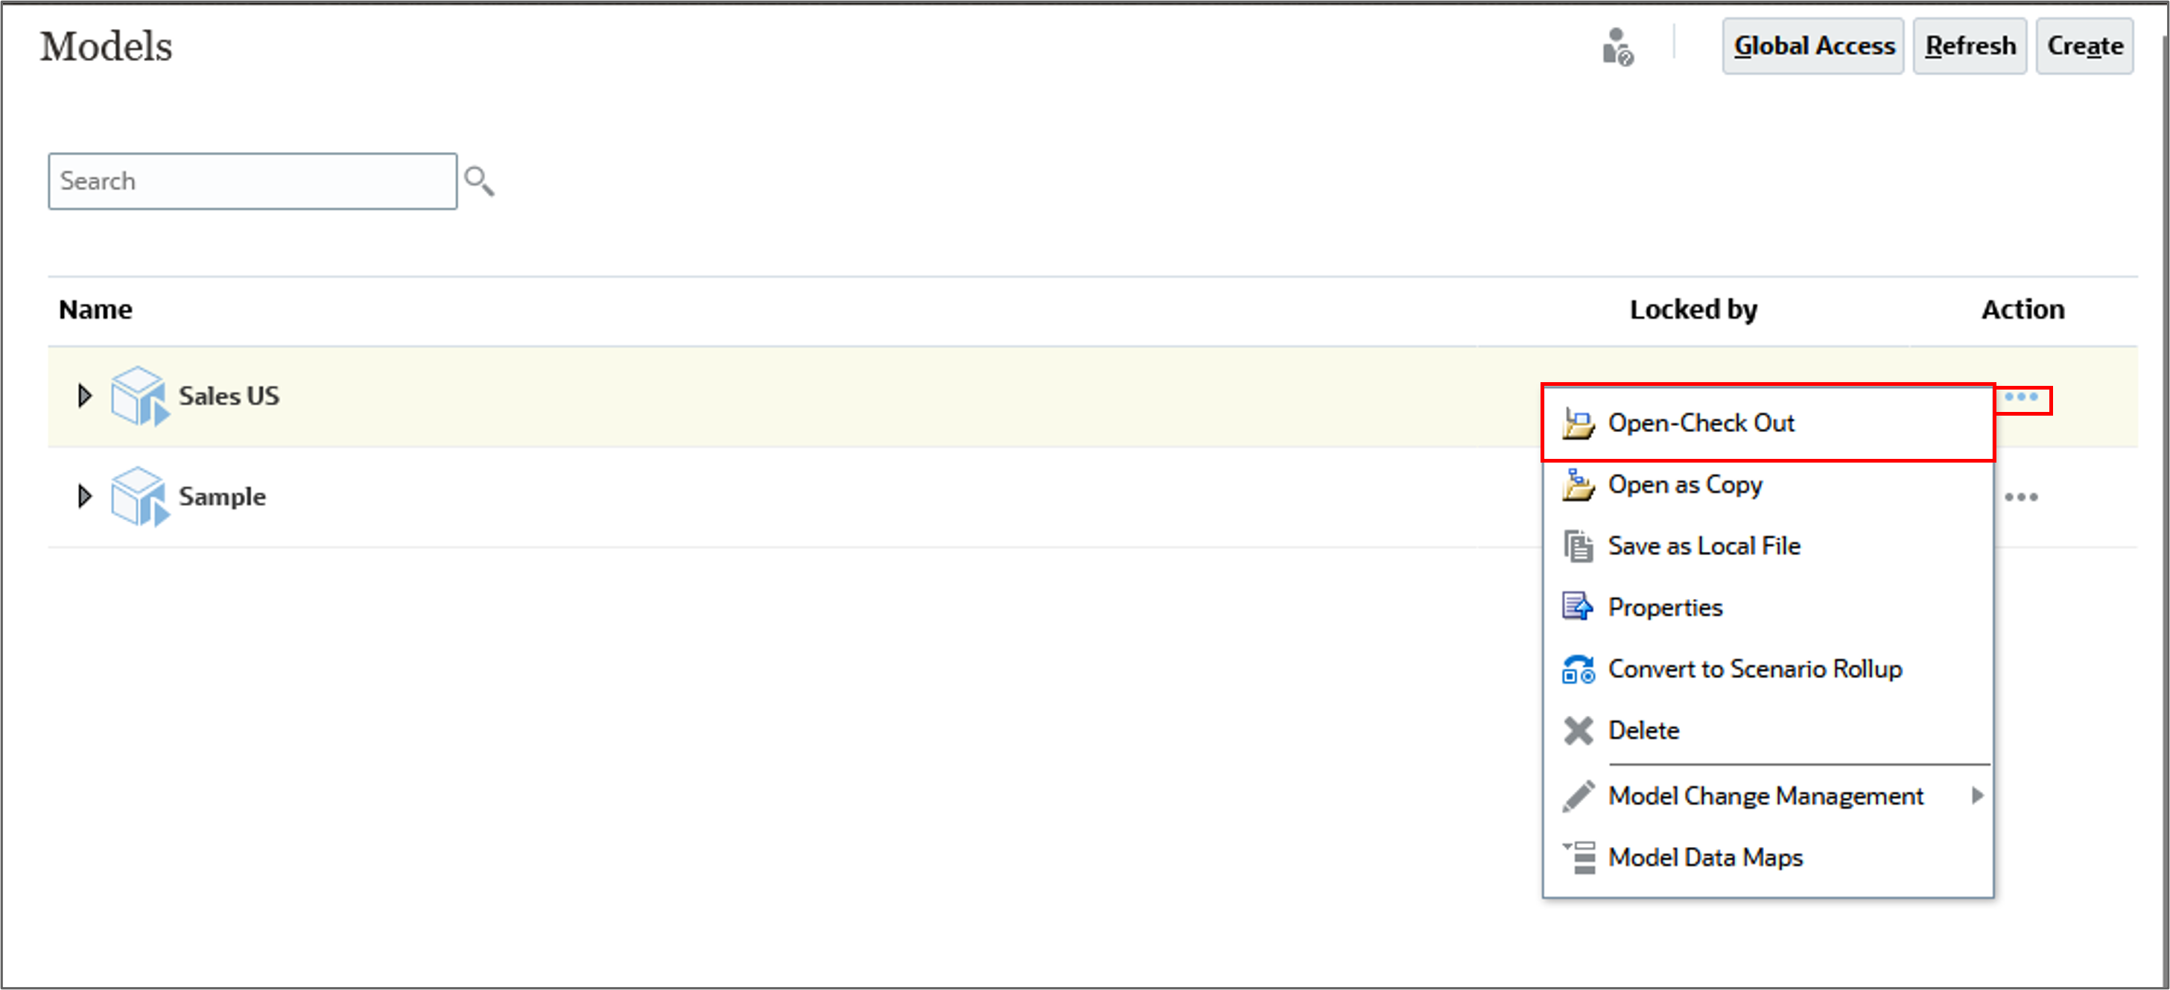
Opening the model
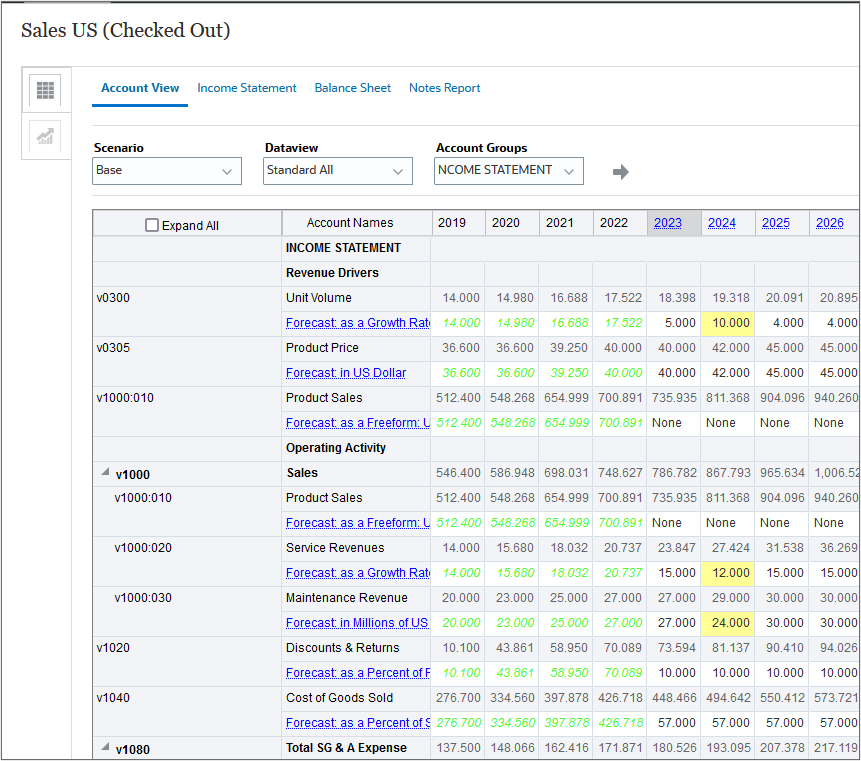
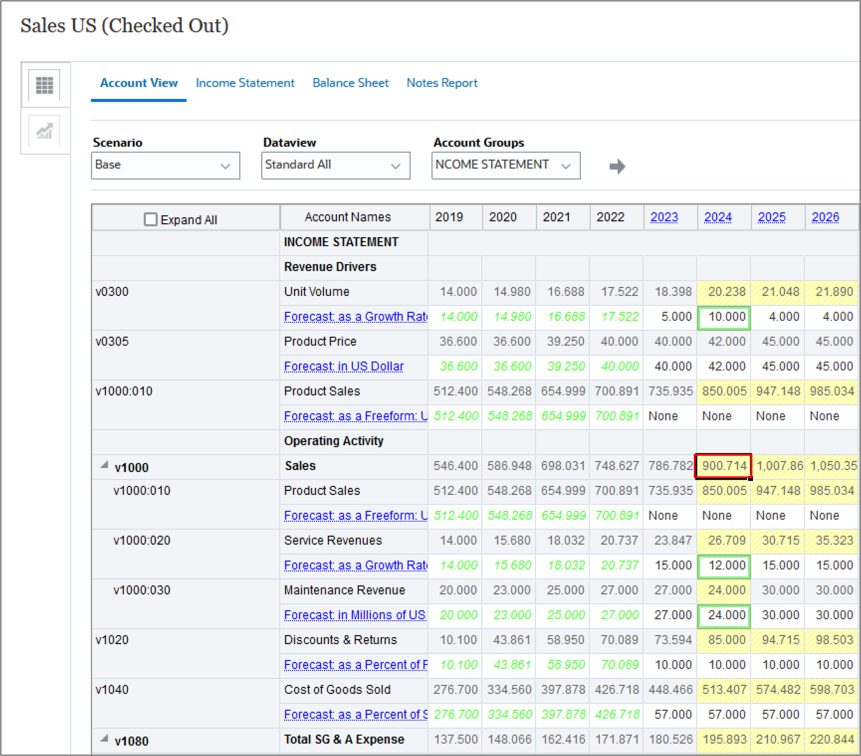
The Sales US model includes accounts used to track several revenue drivers and key expenses impacting the bottom line. In this tutorial, you review the profitability of the company’s expansion plans to add several more high-end retail stores. The goal is to forecast overall sales for the company in the coming year, and the likelihood of achieving certain targets.
- On the Models page, for Sales US, click (...) Action and select Open–Check Out.
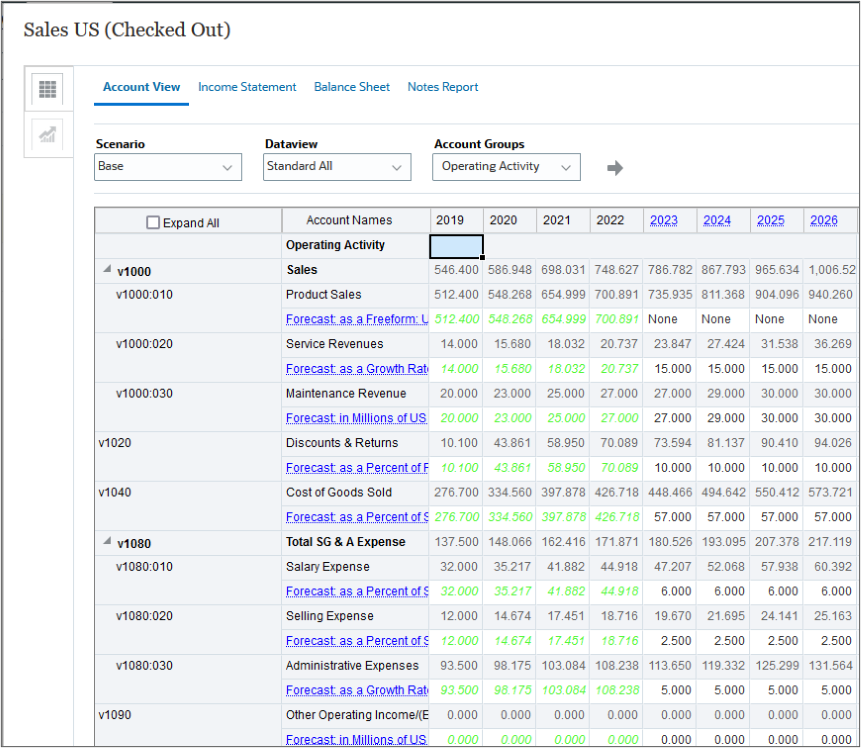
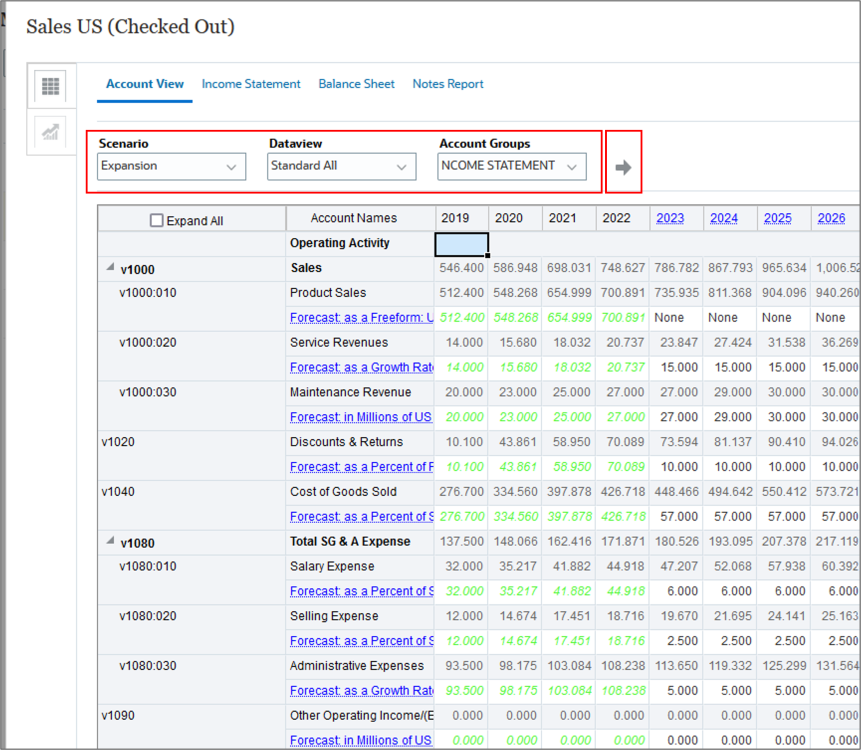
- Verify that the data point-of-view (POV) is set to:
- Scenario: Expansion
- Dataview: Standard All
- Account Groups: INCOME STATEMENT
Tip:
When you check out a model, you can save changes to the data and the model. When you work with a copy of a model, you can't save changes to the data or the model.The model is opened in Account View.
Note:
If you need to change the POV, make sure to clickSetting assumptions
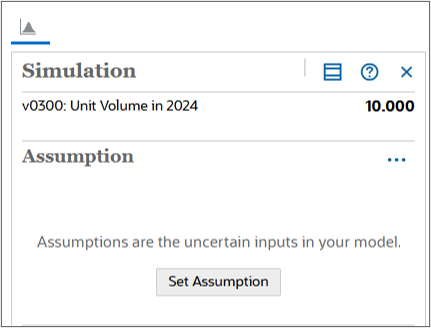
To define a simulation, first determine your key input cells and define them as assumptions.
In this section, for uncertain input accounts, “what if analysis” is done by entering different values based on best guesses. After recalculating data, the updated Sales value becomes the new base case for the “what if” analysis.
When you set an assumption, you select a distribution type. The type of distribution you select depends on the conditions surrounding the input. To select the correct probability distribution:
- Evaluate the input in question and list the conditions surrounding this input.
- Review the descriptions of the probability distributions.
- As you review the descriptions, look for a distribution that features the conditions you have listed for your input.
Note:
The Probability Distribution Descriptions for Strategic Modeling Simulations section in the Working with Planning Modules documentation describes available distribution types in detail.Determining key input cells
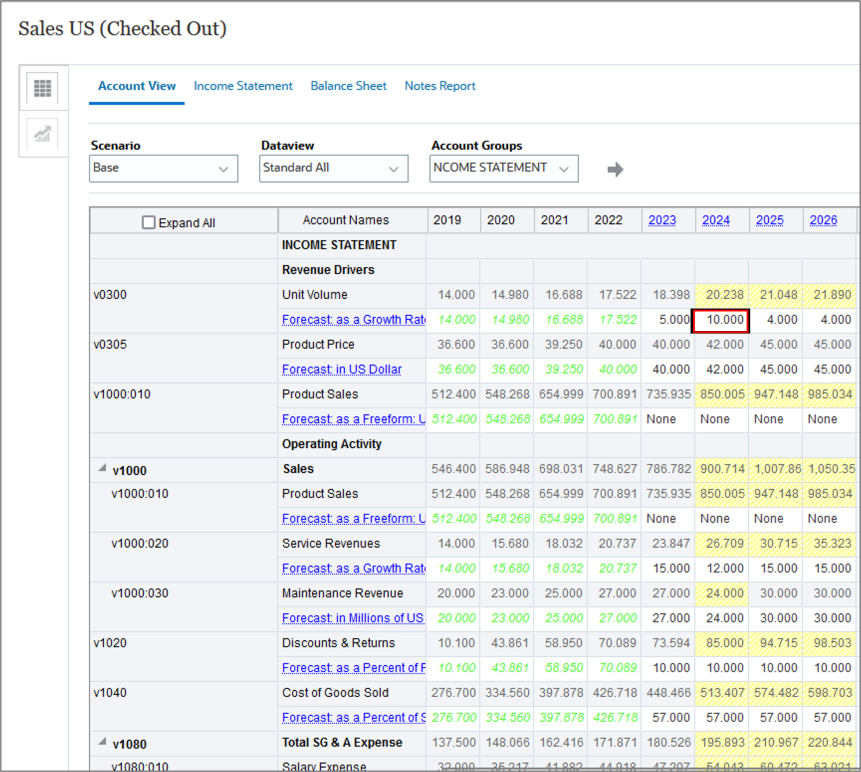
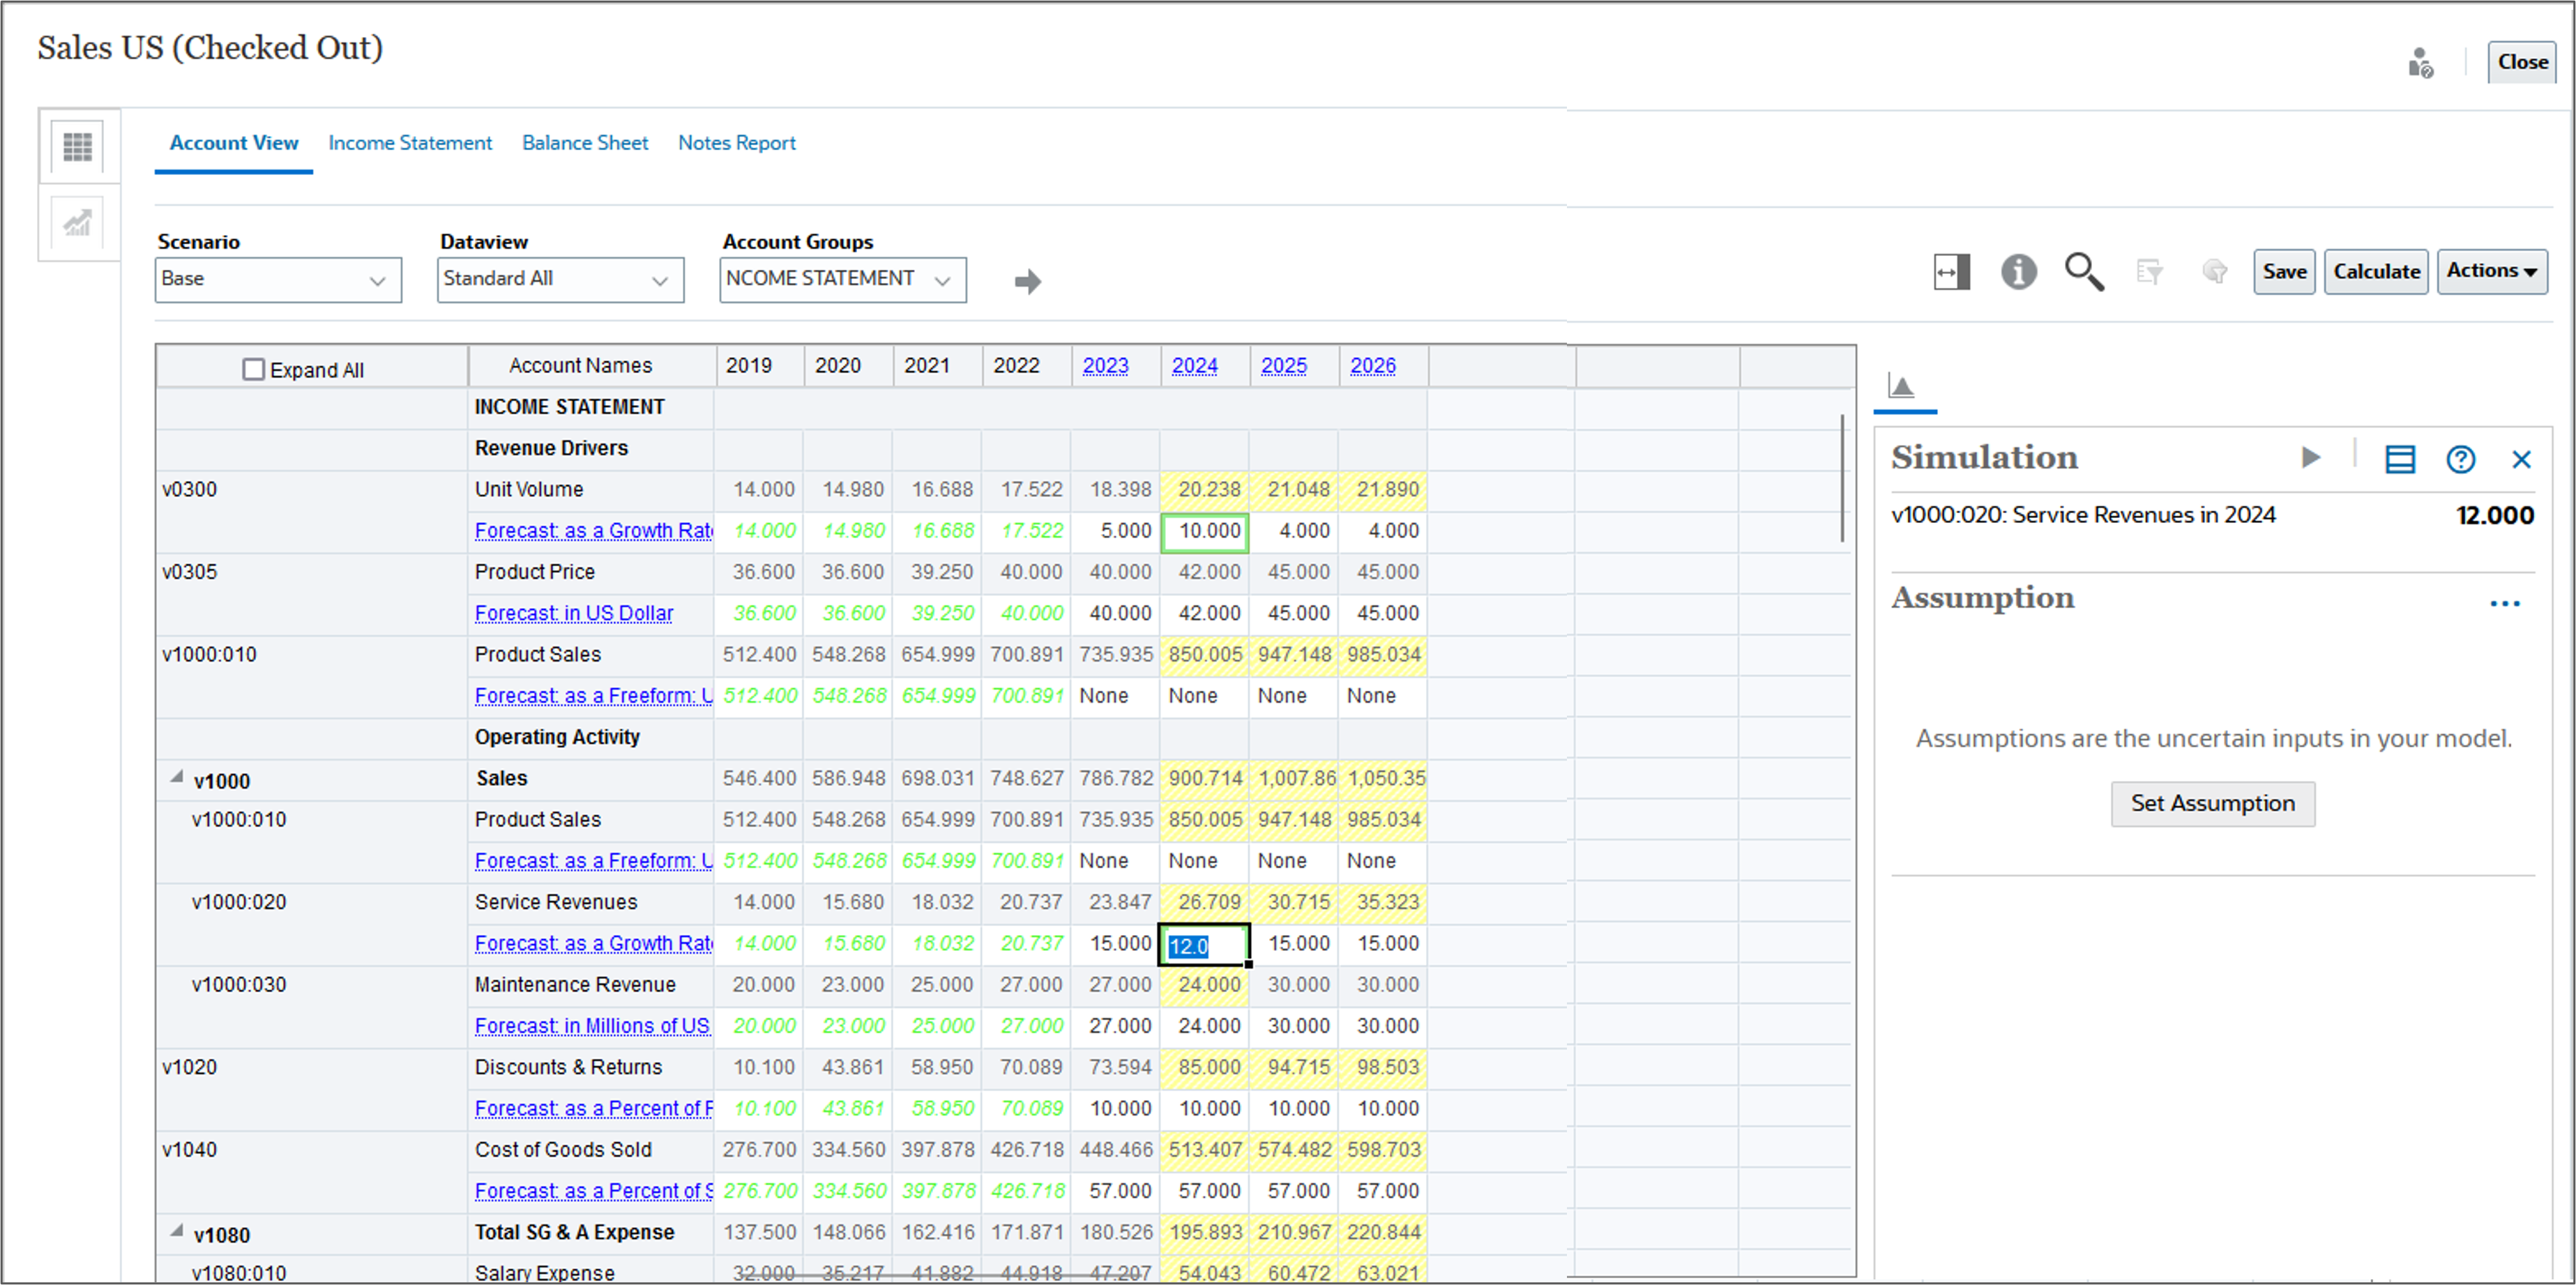
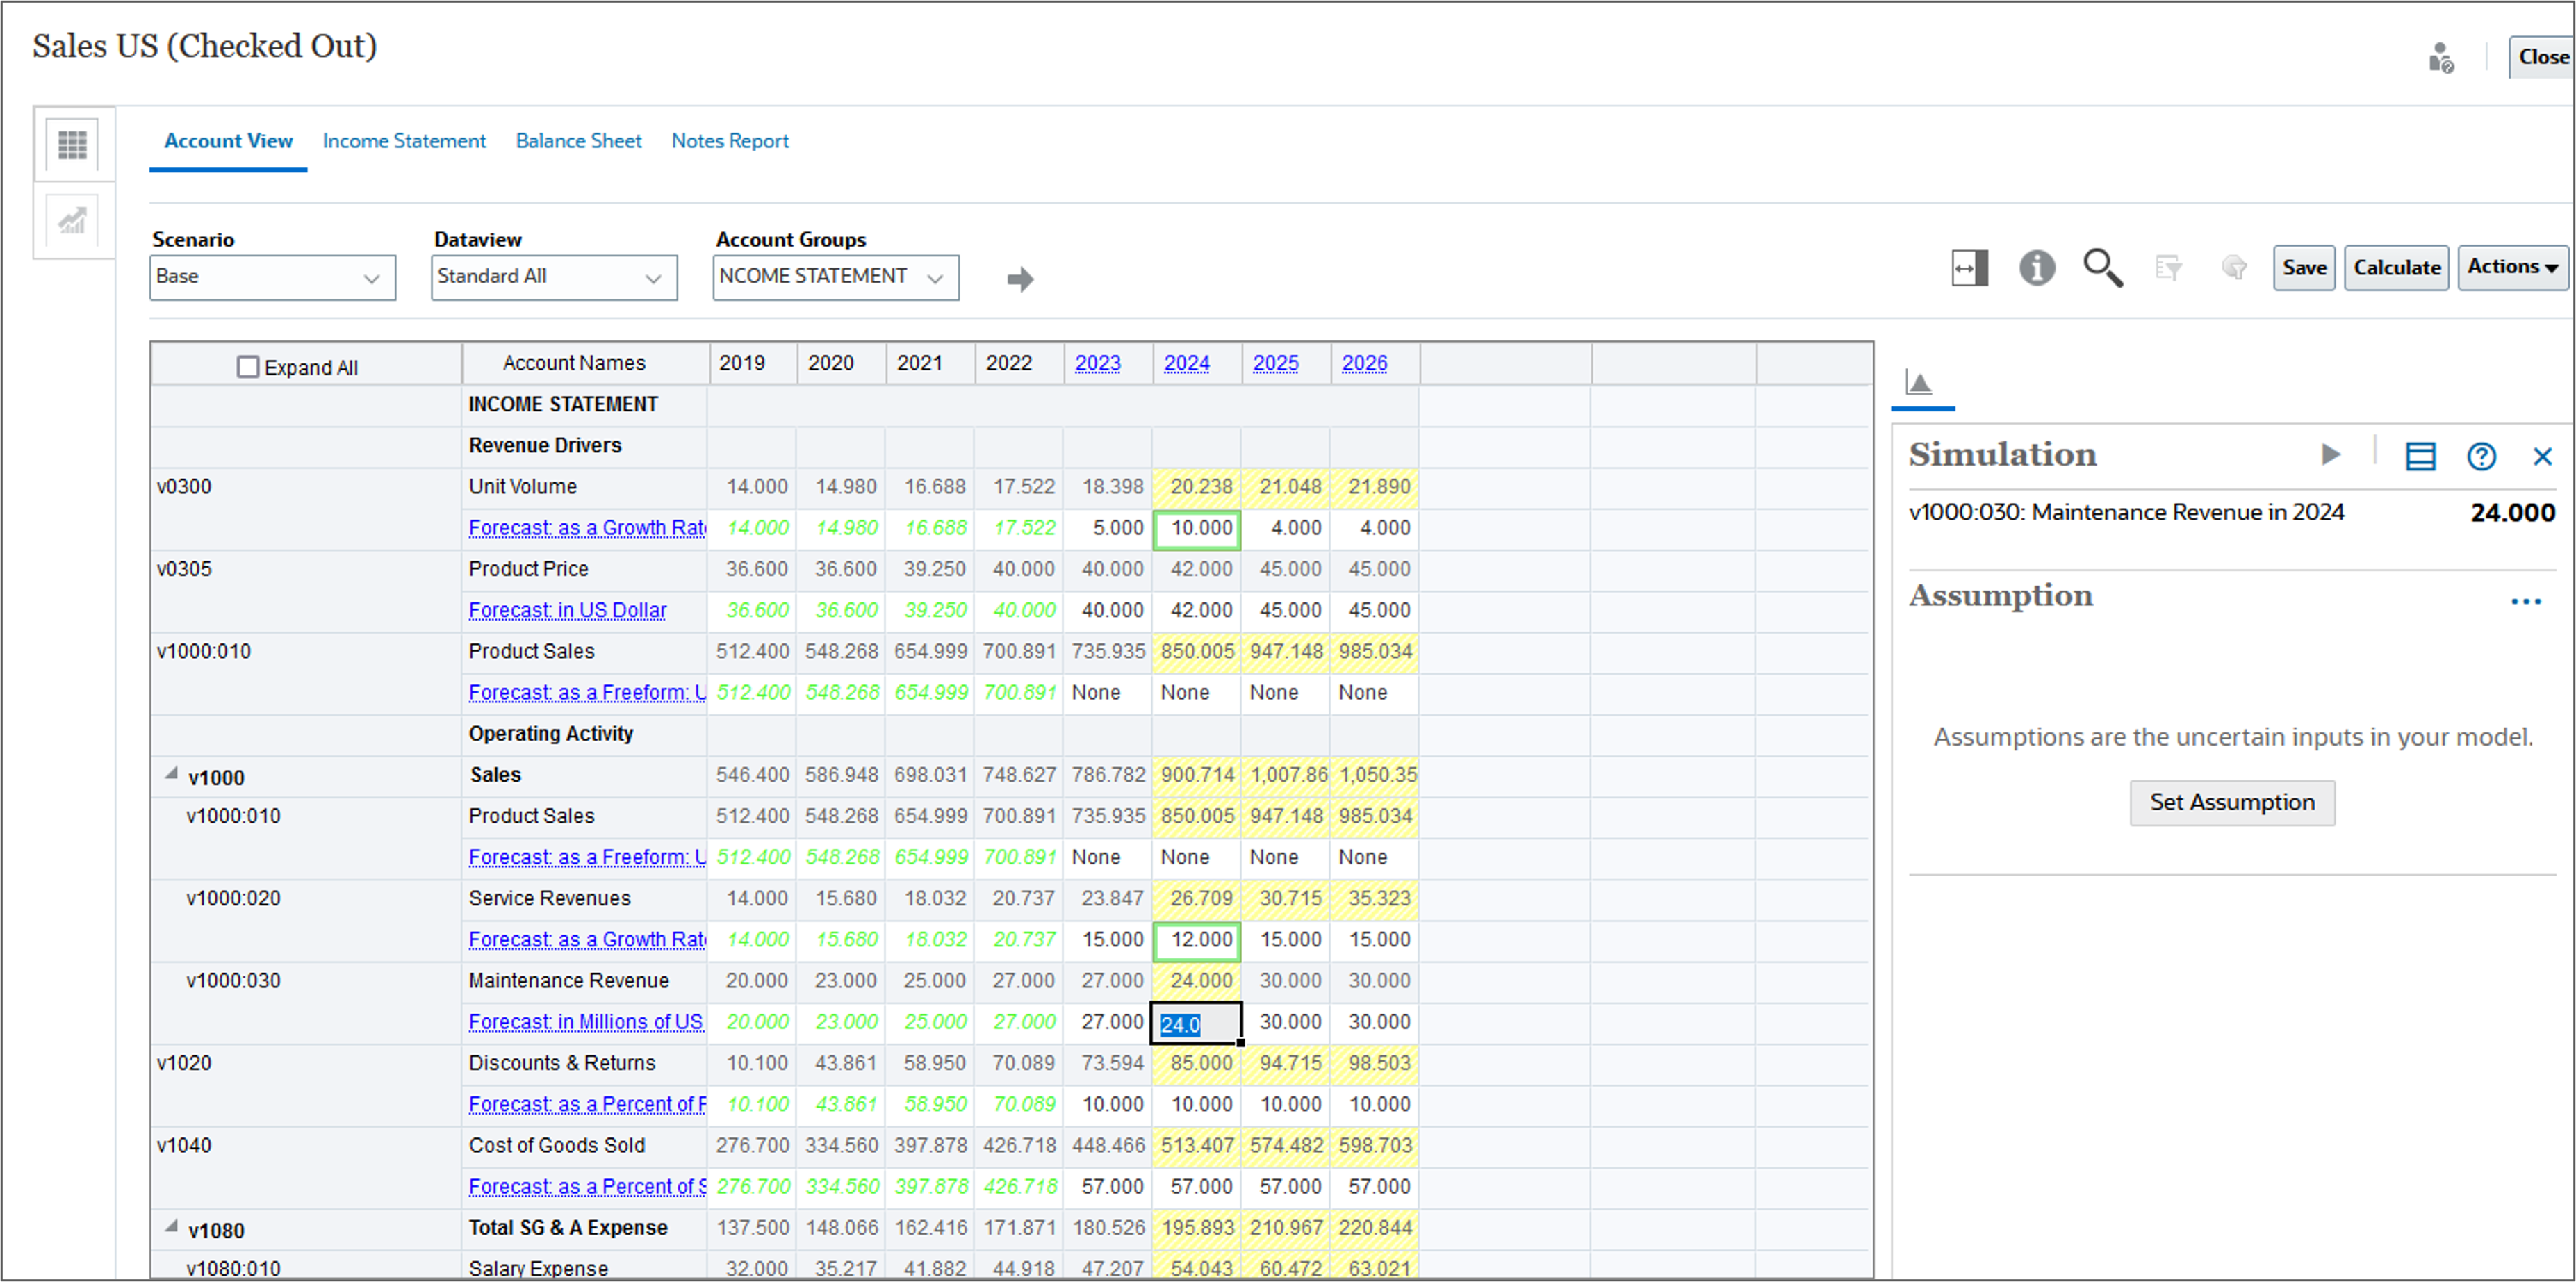
- In the grid, modify the following account values for 2024:
- v0300 Unit Volume - Forecast as a Growth: 10
- v1000:020 Service Revenues - Forecast as a Growth: 12
- v1000:030 Maintenance Revenue - Forecast in Millions of US Dollar: 24
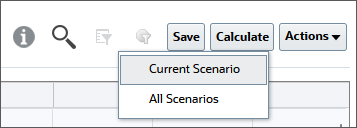
- Click Save.
- Click Calculate and select Current Scenario.
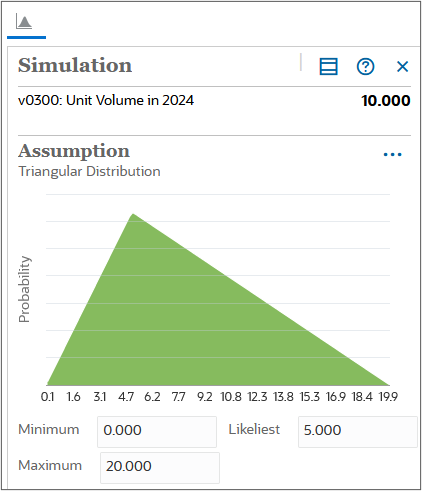
Selecting the triangular distribution type
Decision-makers can use the triangular distribution type to describe uncertain inputs when the minimum and maximum are known, but most values will occur around a likeliest point.
- Select the data cell for 2024 v0300 Unit Volume - Forecast as a Growth.
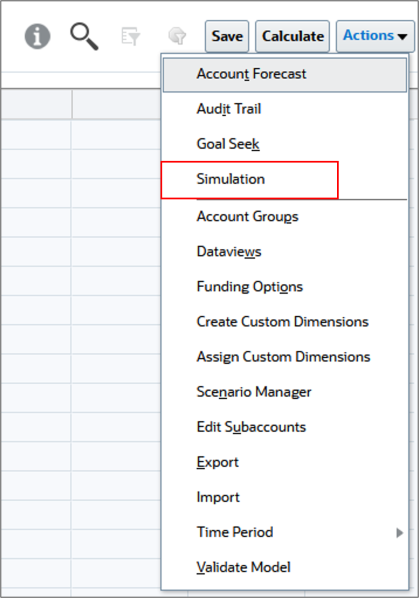
- Click Actions and select Simulation.
- On the Simulation panel, click
 (Simulation Main Menu) and select
Settings.
(Simulation Main Menu) and select
Settings.
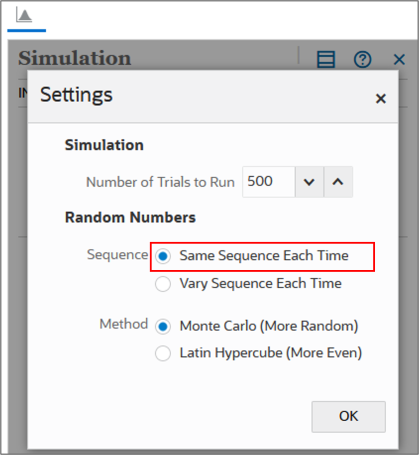
- In Settings, under Random Numbers, set the Sequence to Same Sequence Each Time and click OK.
- On the Simulation panel, click Set Assumption.
- From the types of assumptions, click Triangular
- Set the parameter values based on the following historical data:
- Minimum: 0.0
- Likeliest: 5.0
- Maximum: 20.0
The Forecast as a Growth Rate cell for Unit Volume contains an uncertain value that drives the value of Total Sales Revenue, an account you want to evaluate.
Tip:
If Set Assumption is not shown on the Simulation panel, make sure that you have 2024 v0300 Unit Volume - Forecast as a Growth selected in the grid.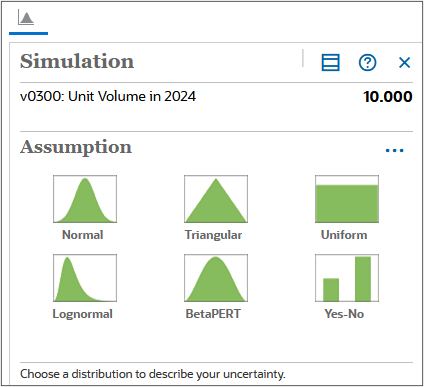
This creates a positively skewed distribution.
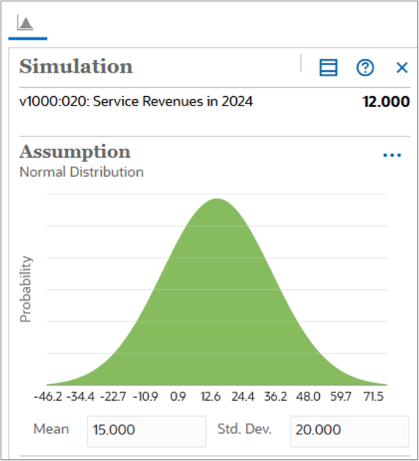
Selecting the normal distribution type
Decision-makers can use the normal distribution type to describe uncertain inputs such as the inflation rate or periodic returns on assets.
- Select the data cell for 2024 v1000:020 Service Revenues - Forecast as a Growth.
- On the Simulation panel, click Set Assumption.
- From the types of assumptions, click Normal.
- Set the parameter values based on the following historical data:
- Mean: 15.000
- Std. Dev.: 20.000
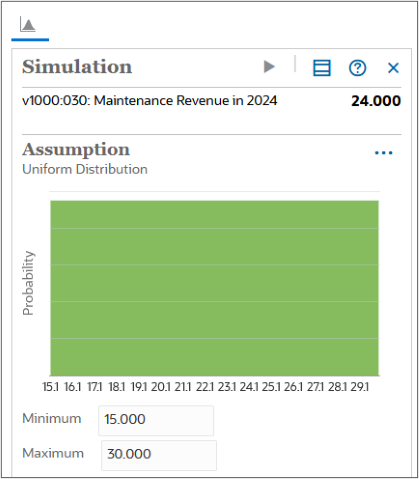
Selecting the uniform distribution type
The Uniform distribution describes situations where you know the minimum and maximum values and all values are equally likely to occur.
In this section, the minimum and maximum values are based on the worse and best case data.
- Select the data cell for 2024 v1000:030 Maintenance Revenue - Foreacast in Millions of US Dollar.
- On the Simulation panel, click Set Assumption.
- From the types of assumptions, click Uniform.
- Set the parameter values based on the following historical data:
- Minimum: 15.000
- Maximum: 30.000
Defining forecast cells
Forecast cells are output cells that contain formulas that refer to one or more assumption cells. These are the accounts for which you want to see the effects of the uncertainty.
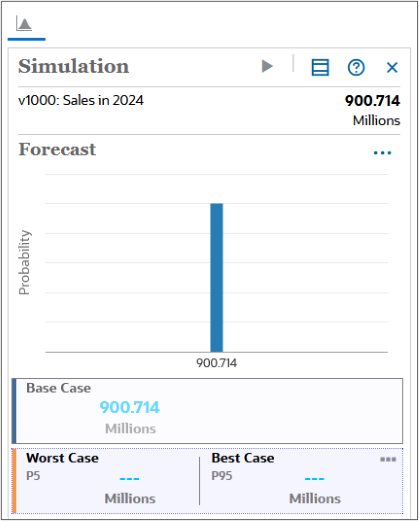
- Select the data cell for 2024 v1000 Sales.
- On the Simulation panel, click Set Forecast.
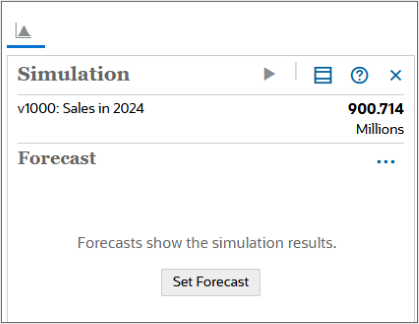
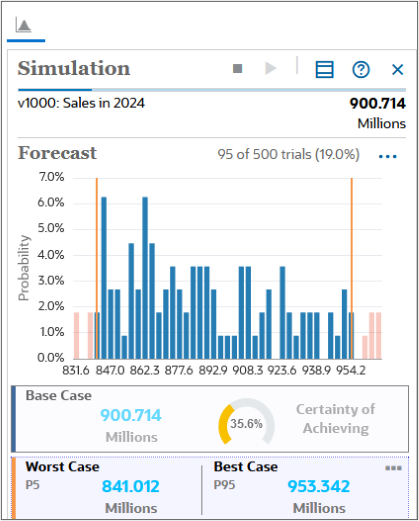
A forecast chart with a single point estimate is shown.
Running simulations
Simulation results are available as long as the model is open and the session hasn't expired.
Tip:
Your data may vary slightly from what is shown in this tutorial because each time you run a simulation, the system randomly generates the results.- Click
 (Run).
 - When prompted that the simulation is complete, click OK.
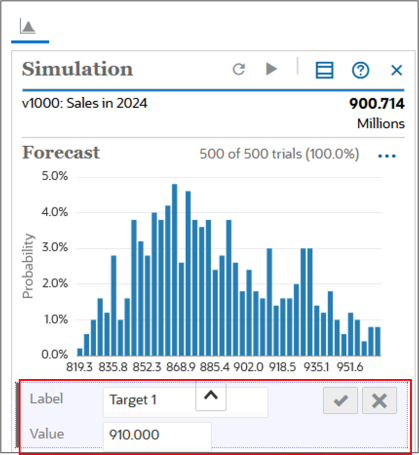
- Add a stretch goal as a second target value. On the Simulation panel, towards the bottom right
area, click
 (Add Metric) and select Target Value.
 - Add a stretch goal as a second target value. Enter the following information:
- Label: Stretch Goal
- Value: 910
- Click
 (OK).
(OK). - When finished reviewing, click Close.
When the simulation runs, random numbers are generated for each of the assumptions. This simulates how different scenarios of values can occur for these variables in the real world.
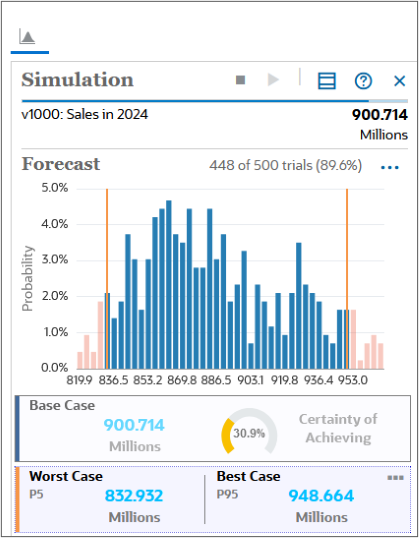
For each scenario, the model is recalculated and the results are shown in the forecast chart.
Note:
Simulation results are not saved when you save the model or check it in.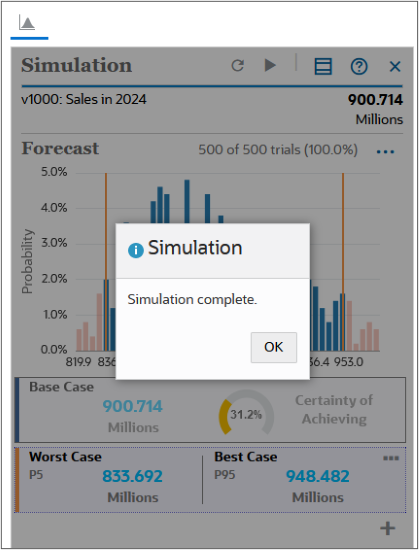
After running the simulation for a few hundred trials, the results start to converge. Below the forecast chart are key metrics.
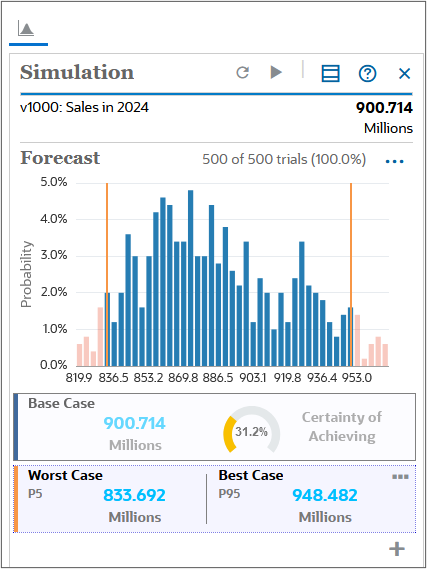
The results show that there is only a 31% chance of exceeding the base case of $900 million, as based on the value in Sales for 2024.
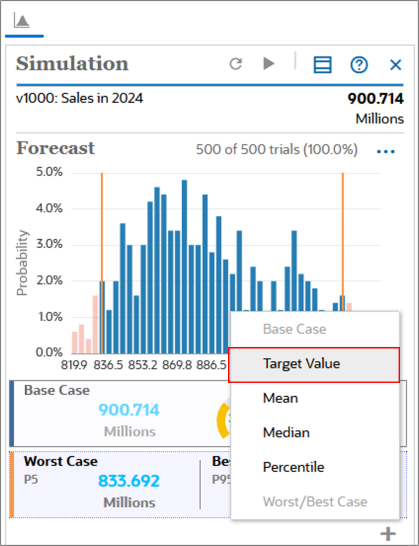
Adding metrics can help determine the chances of success for expansion plans. The updated chart shows the higher risk of meeting the stretch goal target.
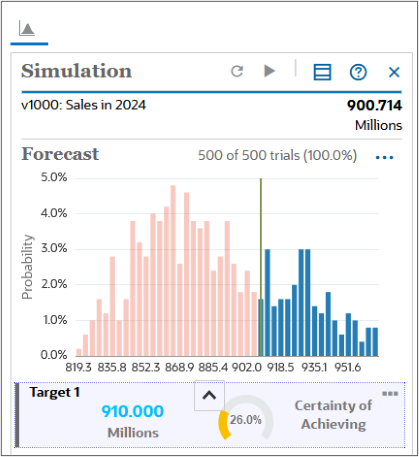
The stretch goal displays a 26% chance of reaching the goal.
With information from simulations, you can better understand the uncertainties surrounding our strategic plans.
Related Links
Improving Forecast Accuracy using Simulations in Strategic Modeling
F95953-03
March, 2026