Introduction
This tutorial shows you how to analyze insights and take action on them. The sections build on each other and should be completed sequentially.
Background
Insights empowers finance and operational users with data science optimized for multidimensional planning and forecasting use cases. Insights analyzes past data and predicted data, helping you find patterns and insights into data that you might not have found on your own. You can evaluate those insights and take action on them.
You use the Insights dashboard to review the insights your administrator configured for you. The dashboard includes all available insights based on your user security. Each row on the Insights dashboard represents an insight, which can help you find patterns to analyze. Insights are displayed in the order of magnitude of the deviations to help you prioritize the order in which to evaluate them. For example, if the deviation is higher, it's more important for you to evaluate it.
In this tutorial, you analyze insights and take action on them.
Prerequisites
Cloud EPM Hands-on Tutorials may require you to import a snapshot into your Cloud EPM Enterprise Service instance. Before you can import a tutorial snapshot, you must request another Cloud EPM Enterprise Service instance or remove your current application and business process. The tutorial snapshot will not import over your existing application or business process, nor will it automatically replace or restore the application or business process you are currently working with.
Before starting this tutorial, you must:
- Have Service Administrator access to a Cloud EPM Enterprise Service instance.
- Upload and import this snapshot into your instance.
Note:
If you run into migration errors importing the snapshot, re-run the migration excluding the HSS-Shared Services component, as well as the Security and User Preferences artifacts in the Core component. For more information on uploading and importing snapshots, refer to the Administering Migration for Oracle Enterprise Performance Management Cloud documentation.Reviewing the Insights Dashboard
In this section, you review insights on the Insights Dashboard. You can search and filter the Insights dashboard to focus your analysis.
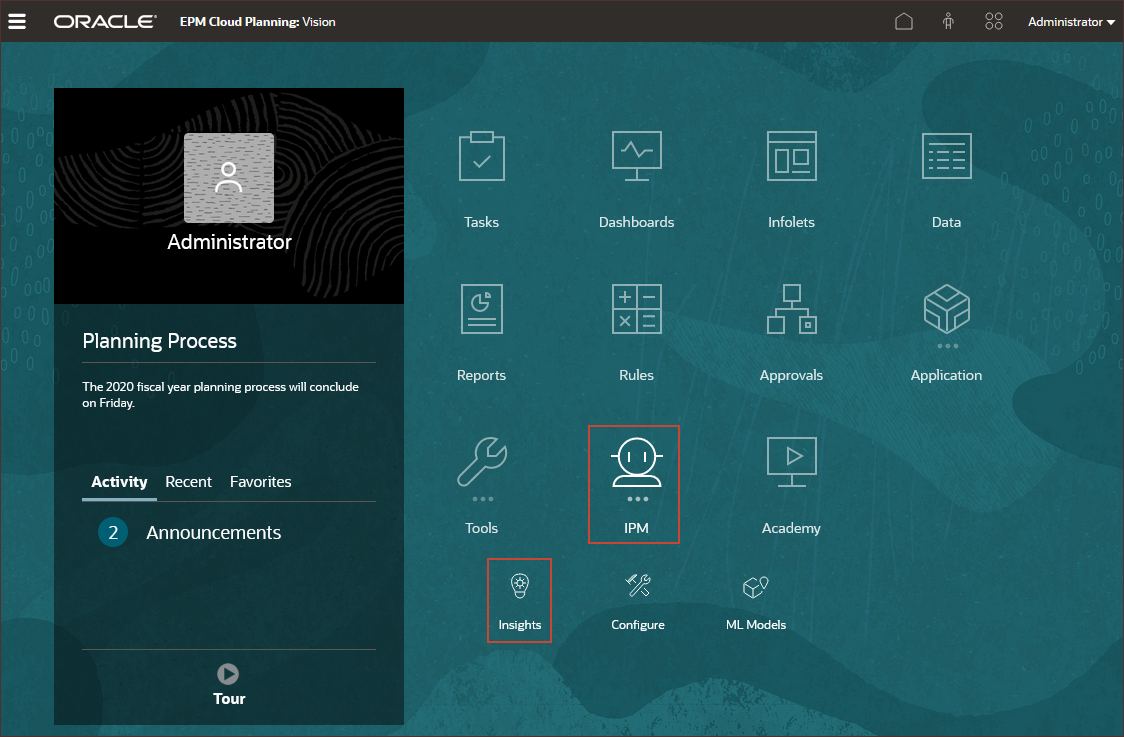
- From the home page, click IPM, and then click Insights.
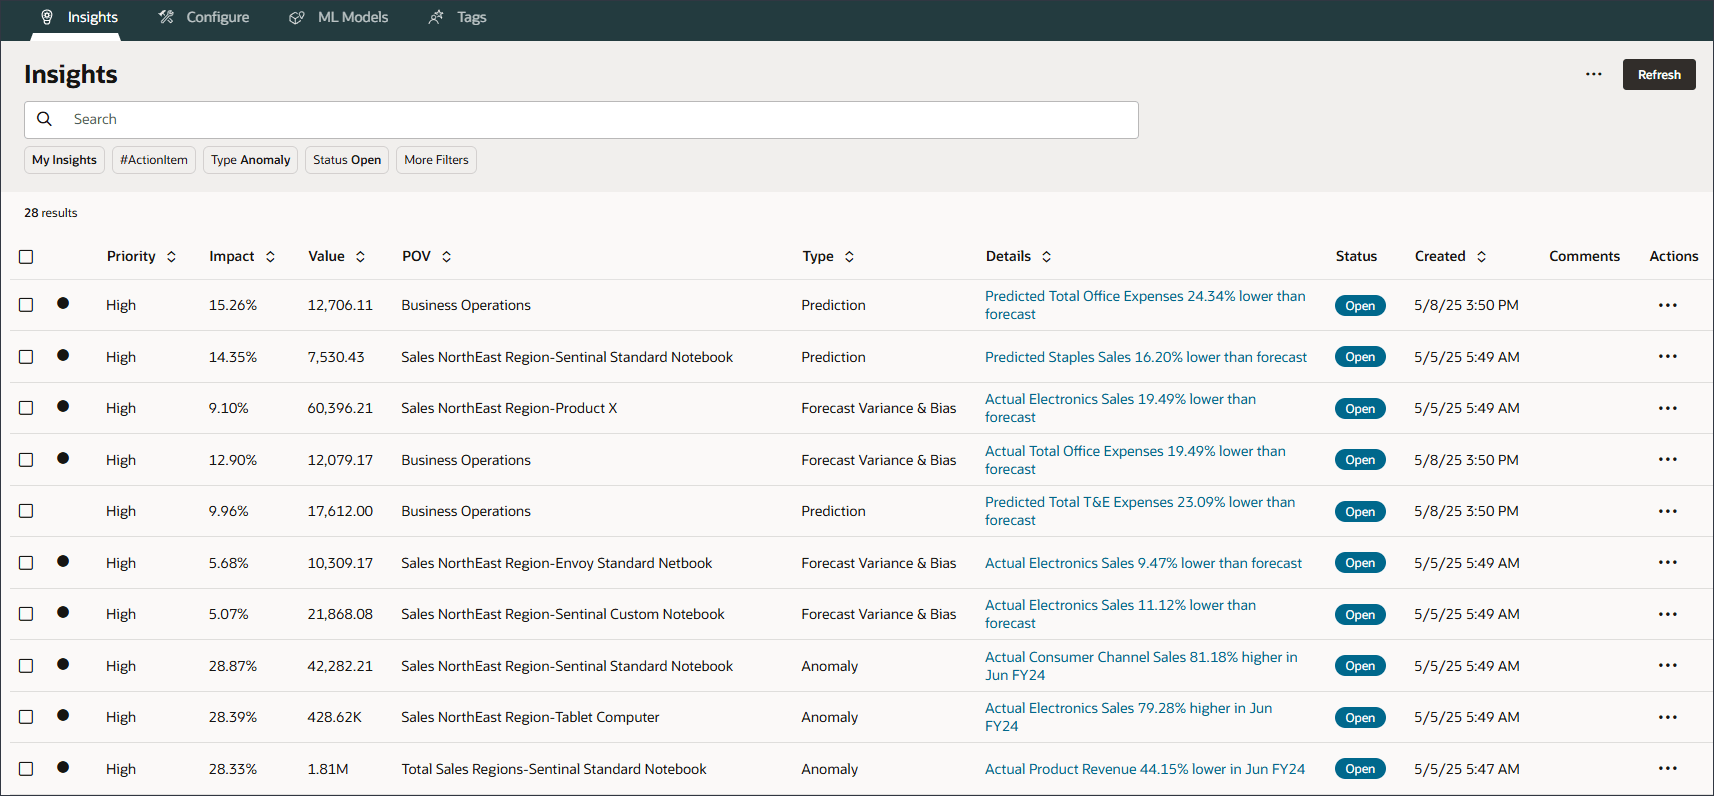
- Review your insights on the dashboard.

The columns include the following attributes:
- Priority: Represents a categorization of insights based on the magnitude of impact (how significant the variance is)
- Impact: Shows the magnitude of impact in relative terms
- Value: Shows the magnitude of impact in absolute terms (the amount)
- POV: Provides information on the intersection for which the insight was generated and is based on the configured display dimensions
- Type: Either Prediction, Anomaly, or Forecast Variance & Bias
- Details: Includes a brief description of insight and a link to a detailed view
- Status: Either Opened or Closed
- Created: The date the insight was created
- Comments: Includes insight comments
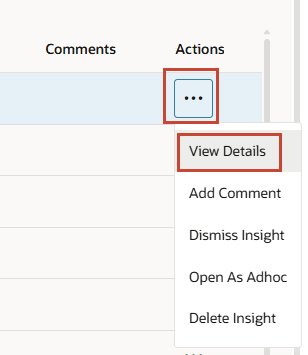
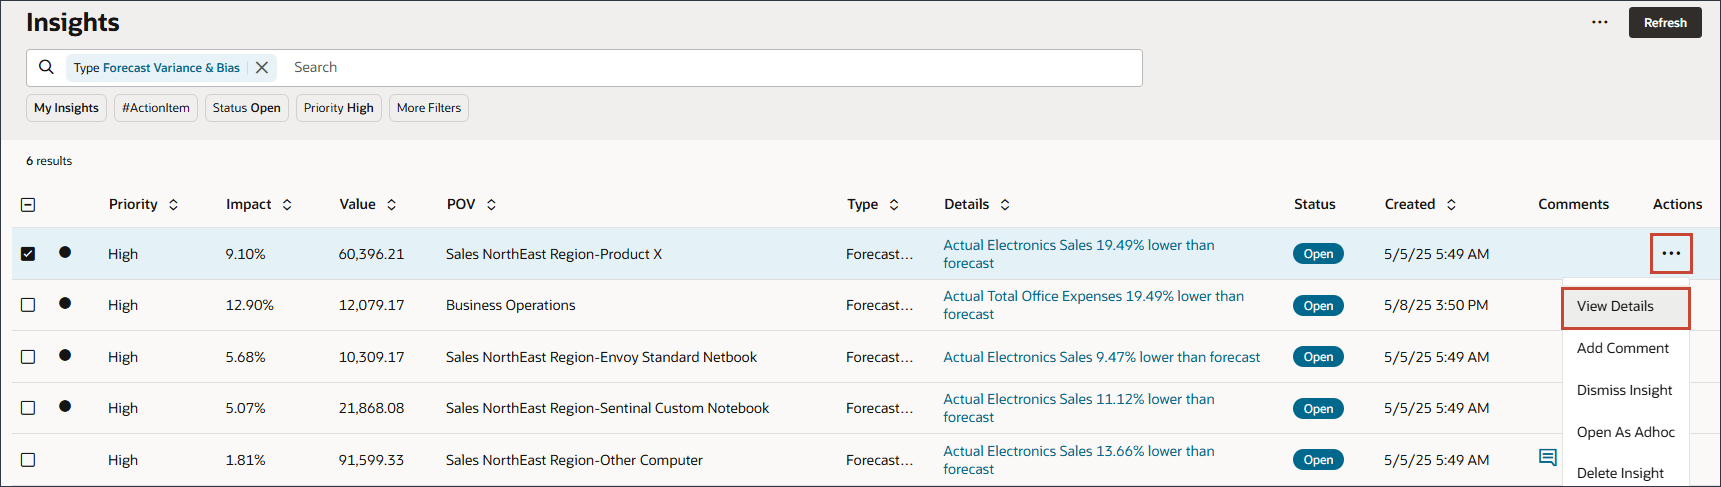
- Actions: Select to perform insight actions to view insight details, accept or dismiss insights, add comments to insights, or open as Adhoc
Each row on the Insights dashboard represents an insight; the columns represent attributes for each insight. Unread insights are flagged with an indicator:
 (Unread Insight Indicator). Your insights are listed in order of magnitude with High priority listed first followed by Medium priority and then Low priority.
 Key criteria you can use to sort insights include these options:
- Priority categorizes insights into High, Medium, and Low priority, using magnitude thresholds defined by your administrator.
- Impact indicates the relative amount of deviation. You can focus your attention on the insights that have more extreme variations, or a higher magnitude.
- Value displays the absolute value of the deviation for this insight.
You can also sort insights by the POV, type, details, status, and creation date.
Searching by Key Words
The dashboard displays all available insights for the user (based on user security) and allows users to search for specific items using the search bar at the top.
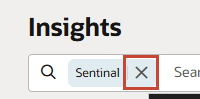
- In Search, enter Sentinal.
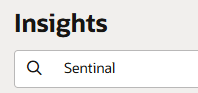
Only Insights for Sentinal are displayed.
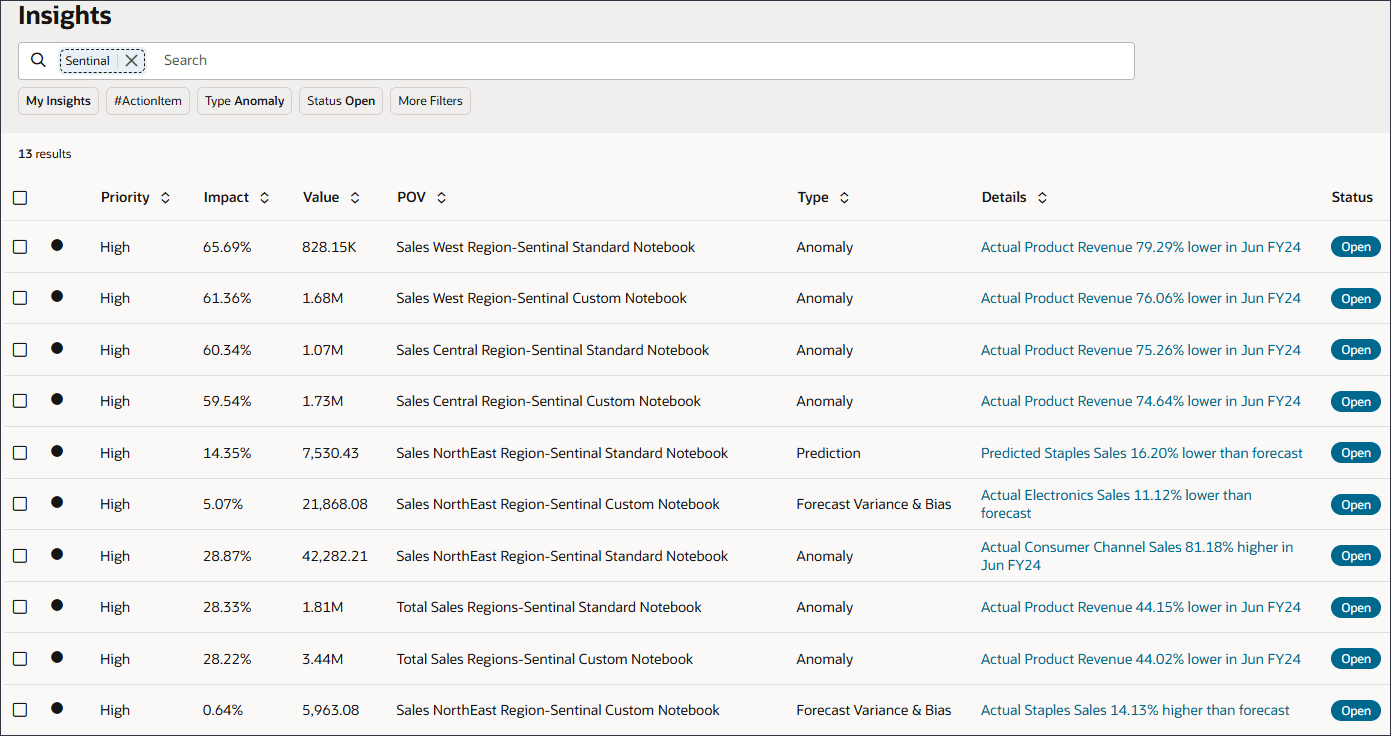
- Clear the Search by clicking X.
- In Search, enter Business Operations.
Only Insights for Business Operations are displayed.
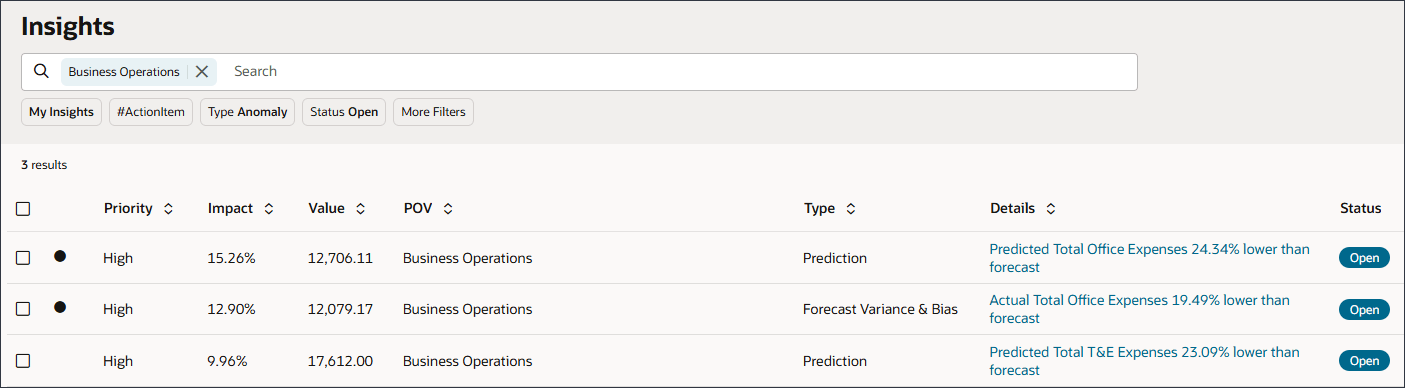
- Clear the Search by clicking X.
Filtering Insights
You can filter the Insights dashboard to show only the insights you want to evaluate. Filters are displayed below the Search Bar.
You can collaborate with your colleagues more effectively and leverage the power of automated analysis by using tags.
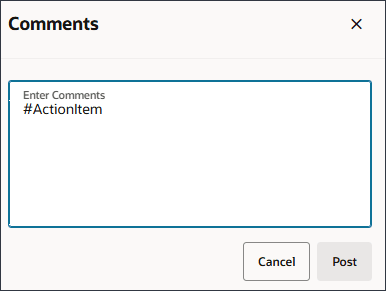
- Use # to tag insights with a custom label. For example, you can tag a set of insights for team review by adding #TeamReview.
- Use @ to tag a user or group.
Then you can filter your Insights dashboard to see tagged insights. The most frequently used tag is highlighted with a chip in the Filter area. Select it to see all insights associated with that tag.
You add tags in the Comments box for an insight.
- In Filters, click More Filters and select Priority High.
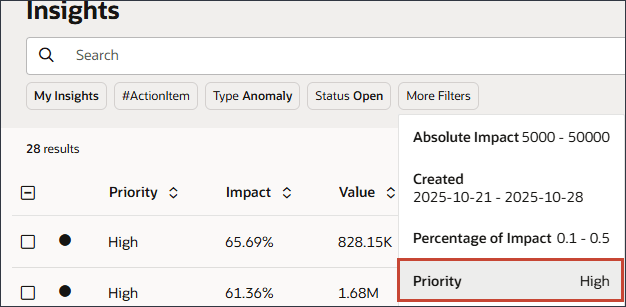
- In the Priority list, select Medium and click High to clear that selection as shown here:
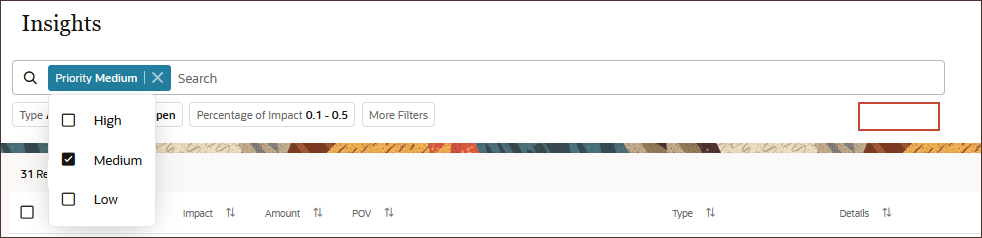
- Click on the white-space outside the search bar to close the selection.
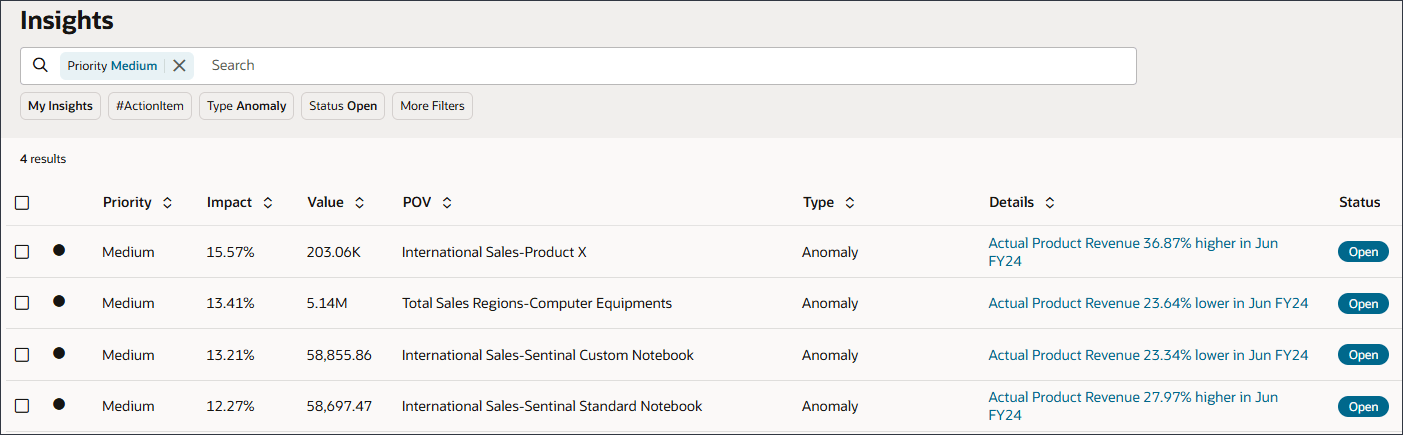
Insights with a medium priority are displayed.
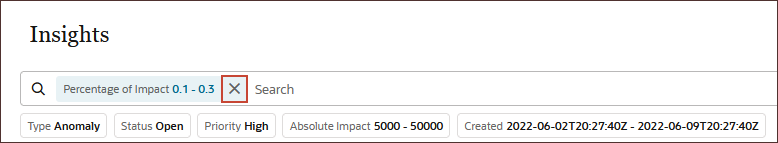
- Click More Filters and select Percentage of Impact.
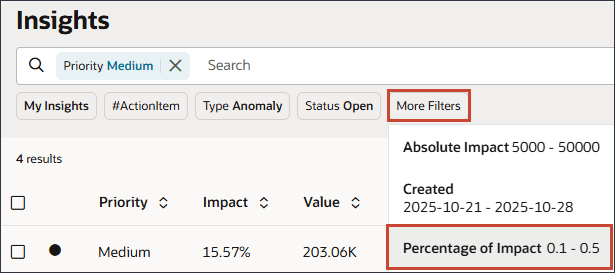
- Change the higher percentage to 30%.
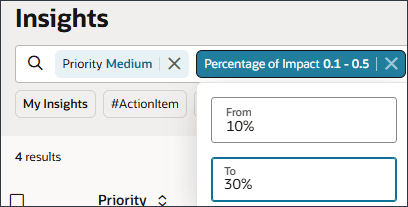
- Click on the white-space outside the search bar to close the percentage of impact selection.
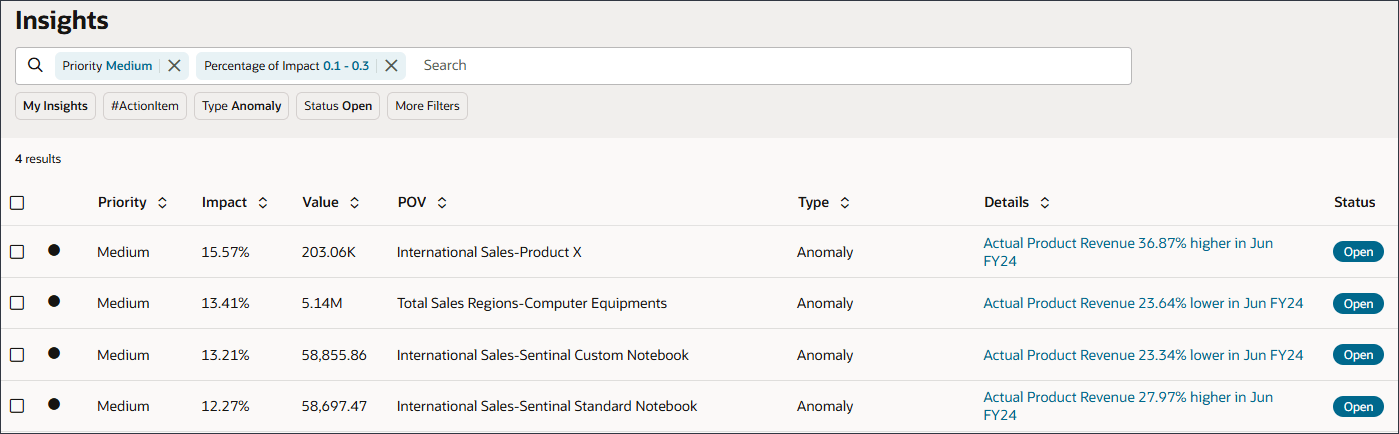
Insights with a medium priority and impact from 10% to 30% are displayed.
- Clear the Priority filter by clicking X.
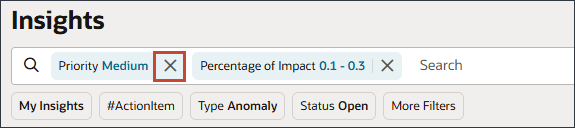
- Clear the Percentage of Impact filter by clicking X.
- Click on the white-space outside the search bar to close the percentage of impact selection.
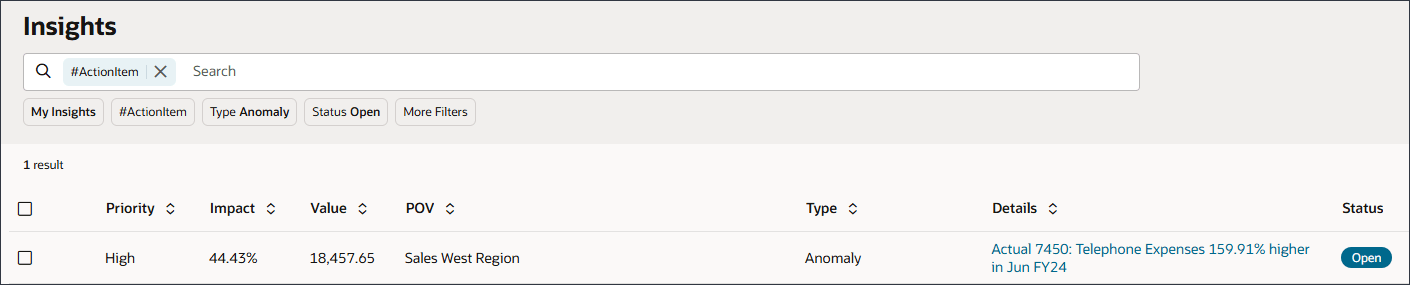
- Filter by Action Item by clicking #ActionItem.
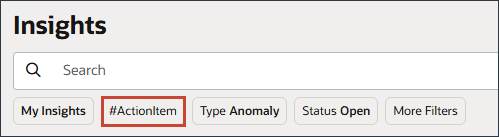
Insights with the tag Action Item are displayed.
- Clear the Action Item filter by clicking X.
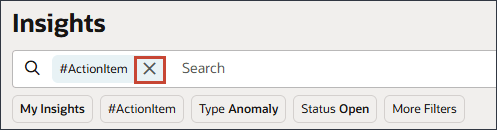
- Click on the white-space outside the search bar to close the percentage of impact selection.
Performing Actions on Insights
In this section, you perform actions on insights. You can view insight details, accept or dismiss an insight, or add a comment to an insight. You can also examine the data by opening the details in ad hoc analysis.
Viewing Insight Details
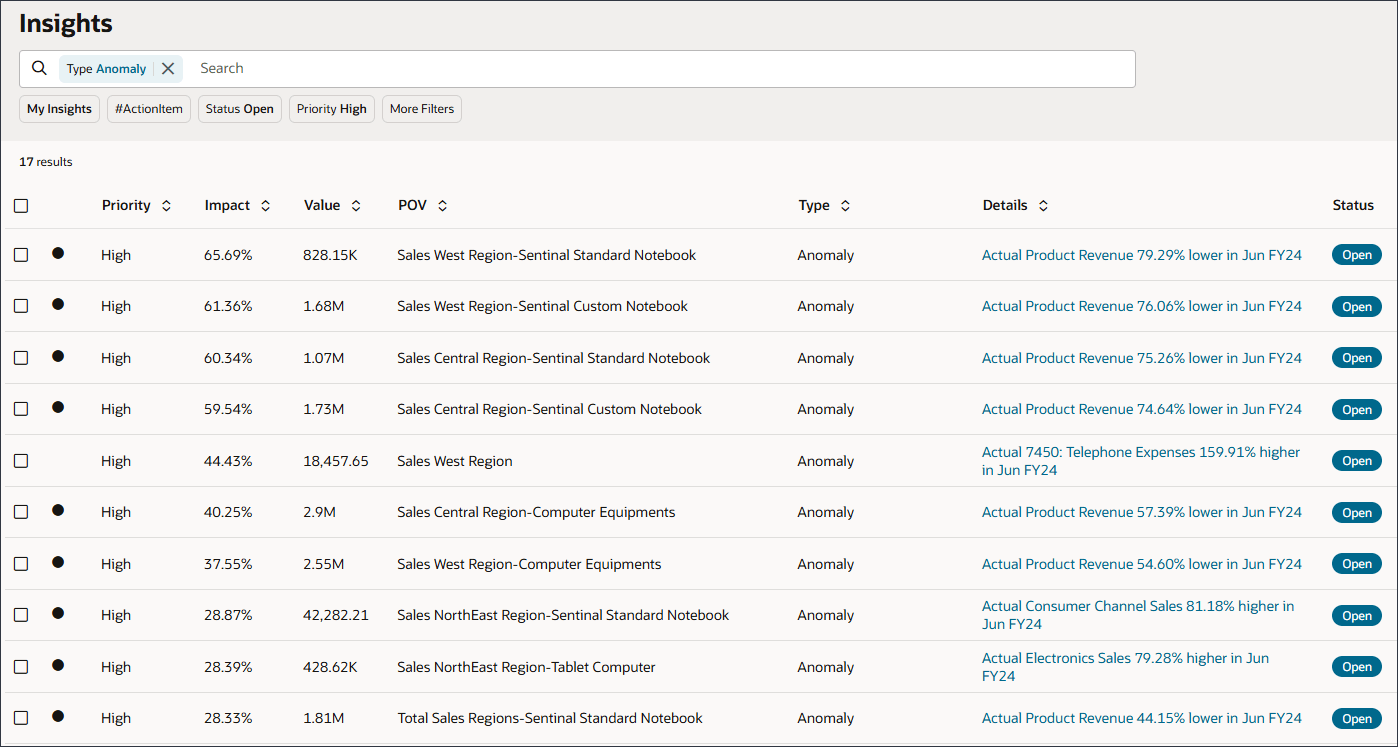
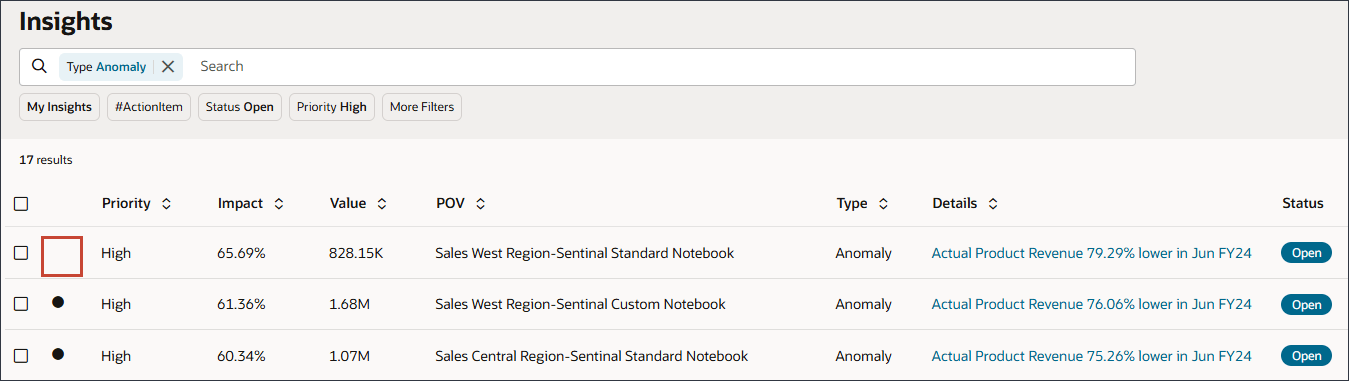
- In the Filter, click Anomaly.
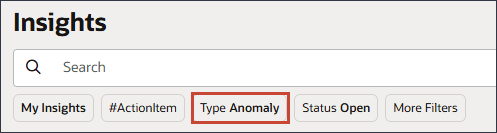
Anomaly insights are displayed. Anomaly insights detect unusual patterns in data that deviate from expected results.
- For Sales West Region-Sentinal Standard Notebook, click
 (Actions), and select View Details.
- Review information about this insight.
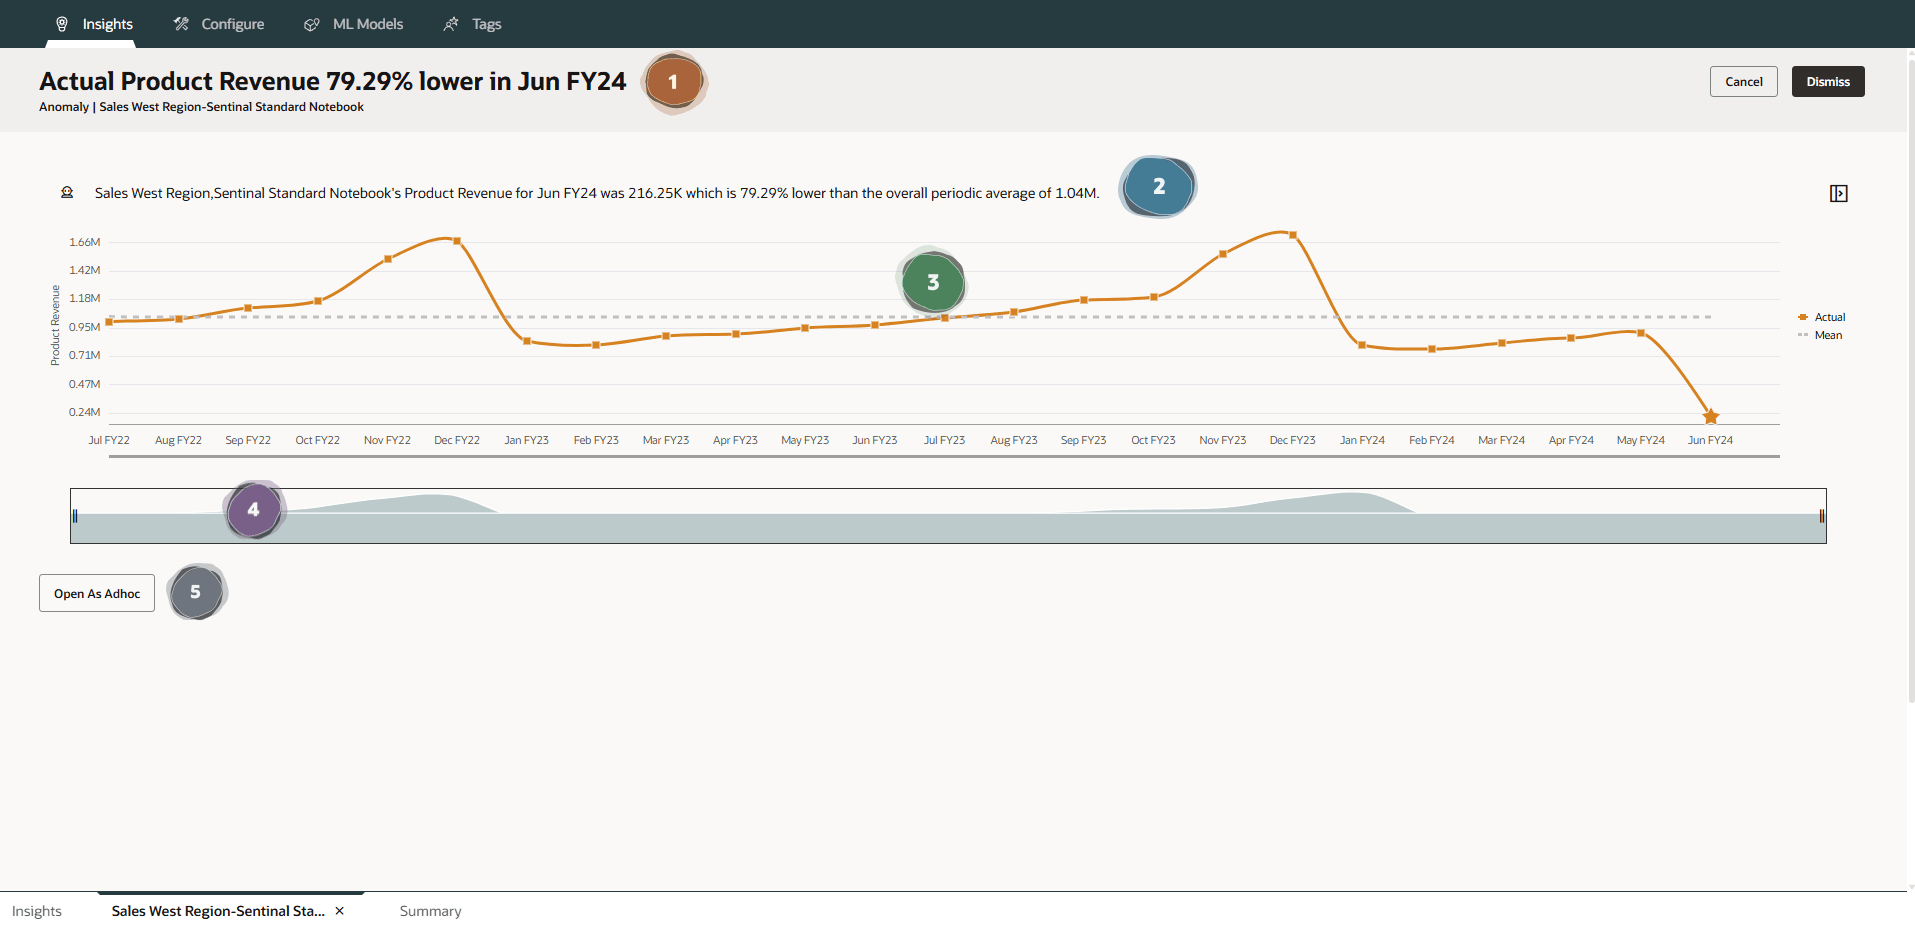
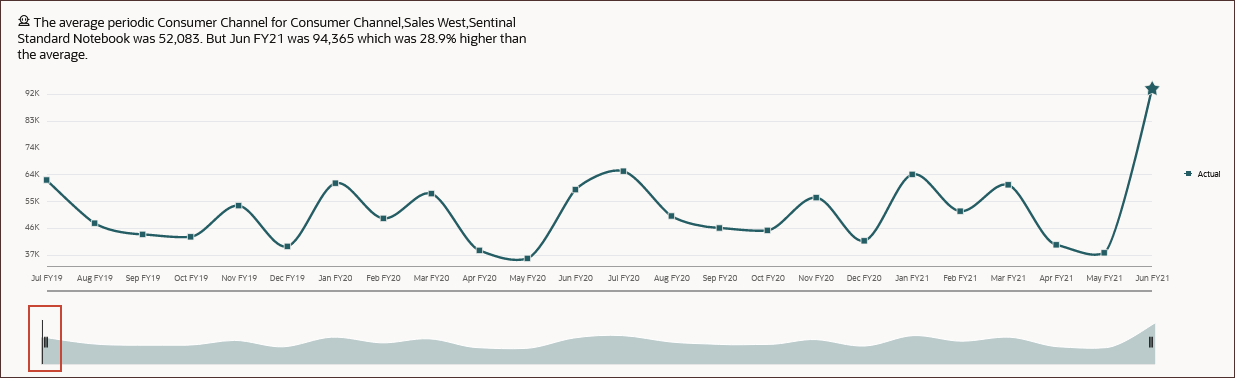
 The title of the insight is displayed. It provides information about the insight.
 The description at the top of the page provides more details about the insight in a narrative format including the POV and time period for the outlier value. It adds more details by comparing the absolute value of the anomaly with the average value for the historical time period.
 This section includes the chart with the underlying data which was used to determine the anomaly - indicated with a star.
  There is a horizontal slider where you can change the time period shown in the chart.
 Click Open As Adhoc to open the insight for further ad hoc analysis.
 - Click
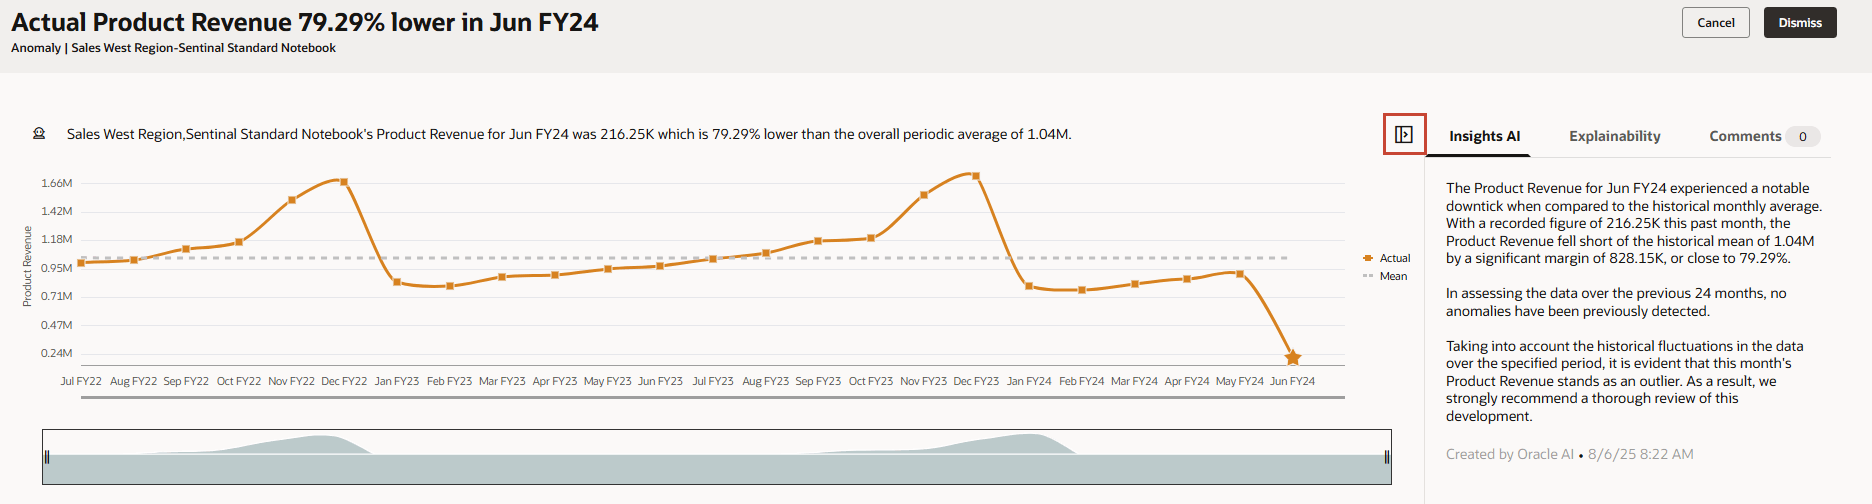
 (Explainability).
-
You can see details about an insight or enter comments here:
- The Insights AI tab uses Generative AI (GenAI) to automatically generate narrative summaries for a single insight or group of insights.
- The Explainability tab shows details about the insight including metrics and methods used in the insight. This detail makes the insight data more prominent and more transparent.
- Click Comments to enter your comments about the insight, for example to explain a variance to a colleague.
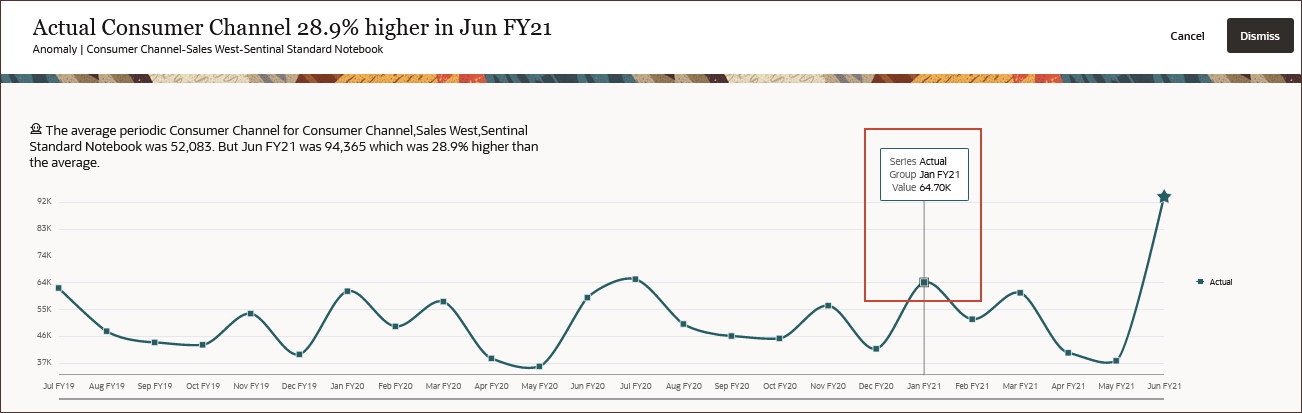
- Hover over any graph point to see details about the value.
- Move the slider to the right.
You can use the slider bar to see more periods, or to zoom in on a time frame or set of values. You can see up to 18 periods at a time on the graph.
- To return to the Insights dashboard, click Cancel.
Notice that this insight no longer has the unread indicator.
Analyzing Insights in Ad Hoc
For Forecast Bias insights, you can review where variances are greatest between historical forecasts and actuals. This can help you recognize any hidden bias in forecasts.
You can review the data in graph and in table form. You can also open the insight for further analysis in ad hoc. Opening insights in ad hoc lets you explore the underlying data directly in the web interface. You can pivot dimensions, drill into intersections and perform interactive analysis without saving changes, ensuring the baseline data remains intact.
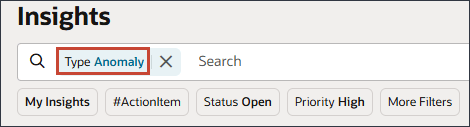
- On the Insights dashboard, for Type click Anomaly.
- Select Forecast Variance & Bias, and click Anomaly to clear that selection as shown below:
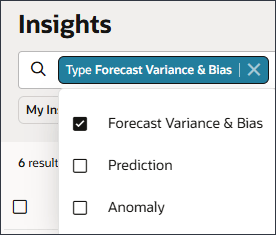
- Click on the white-space outside the search bar to close the selection.
- For Sales NorthEast Region-Product X, click (Actions), and select View Details.
- Review the sections of the insight.
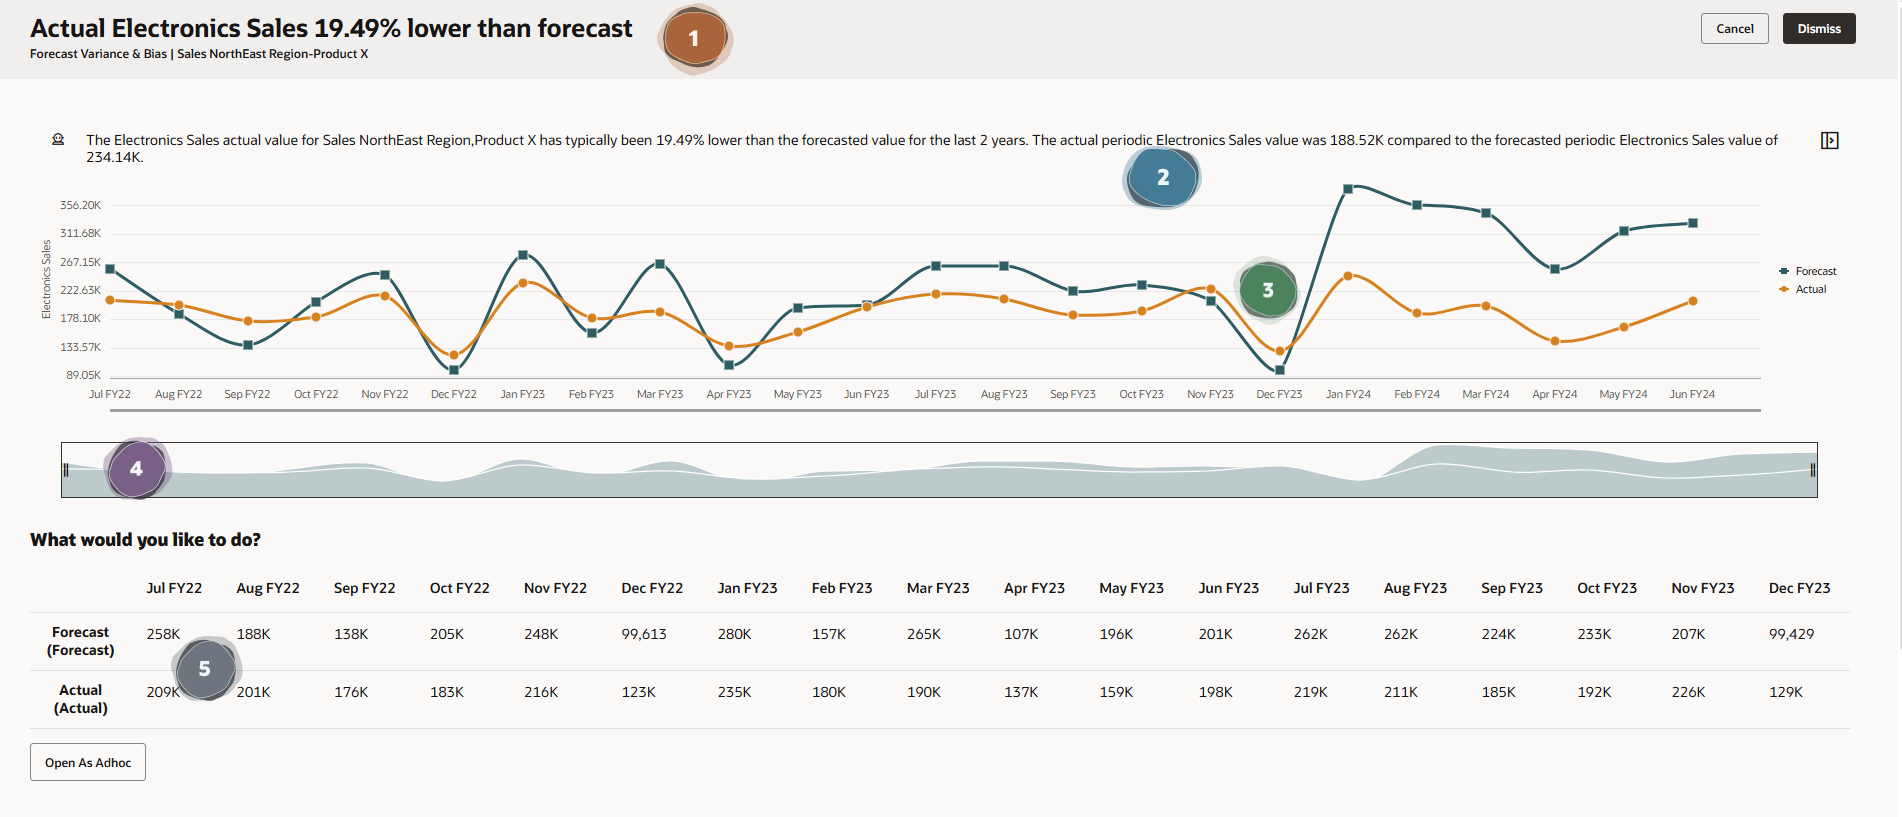
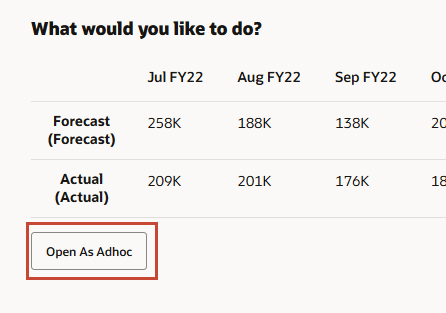
The title of the insight is displayed. It provides information about the insight. The description at the top of the page provides more details about the insight in a narrative format including the POV and time period for the future forecast and predicted data. This section includes the chart with the underlying data used for the analysis. There is a horizontal slider where you can change the time period shown in the chart. This section shows the data used for the analysis (Future Forecast vs Actual) shown in a table. - In the lower left, click Open As Adhoc.
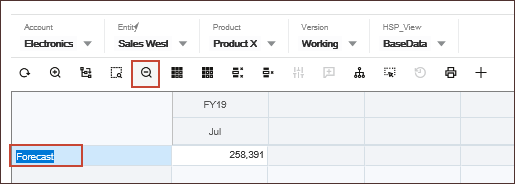
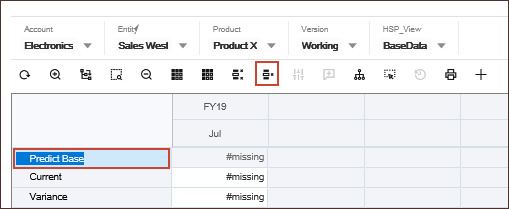
- Click Actual, and click
 (Zoom Out).
- Double-click Scenario.
- Select Current, and click
 (Remove Selected).
- Repeat the previous step to remove each of the following:
- Variance
- Variance Comments
- No Scenario
- Plan
- Adj Plan
- Revised Plan
- Predictive Forecast
- Act vs Plan
- Act vs Plan %
- Act vs Forecast
- Forecast vs Plan
- Forecast vs Plan %
- Plan Adj %
- Revised Forecast vs Prediction %
- Y-O-Y Change
- Y-O-Y Change %
- Scenario
Note:
Do NOT remove Actual and Revised Forecast.Actual and Revised Forecast scenarios are displayed.
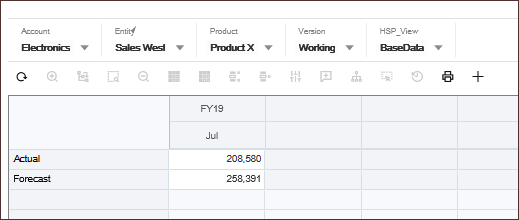
- Select Jul, and click (Zoom Out).
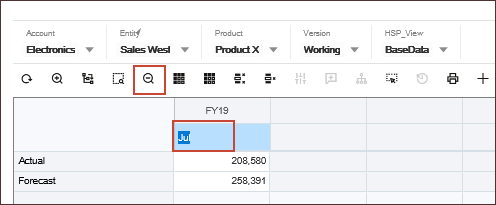
- Select Q3, and click (Zoom Out).
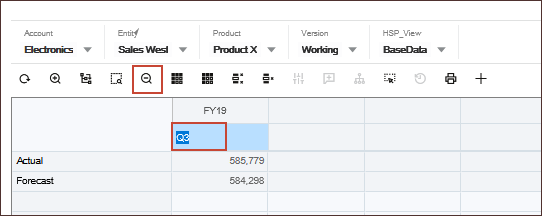
- Select YearTotal, and click (Remove Selected).
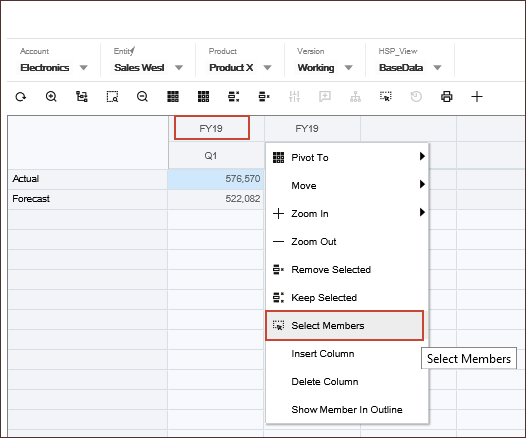
- In the first column, right-click FY24, and select Select Members.
- On the right, for Selections click
 and select Remove All.
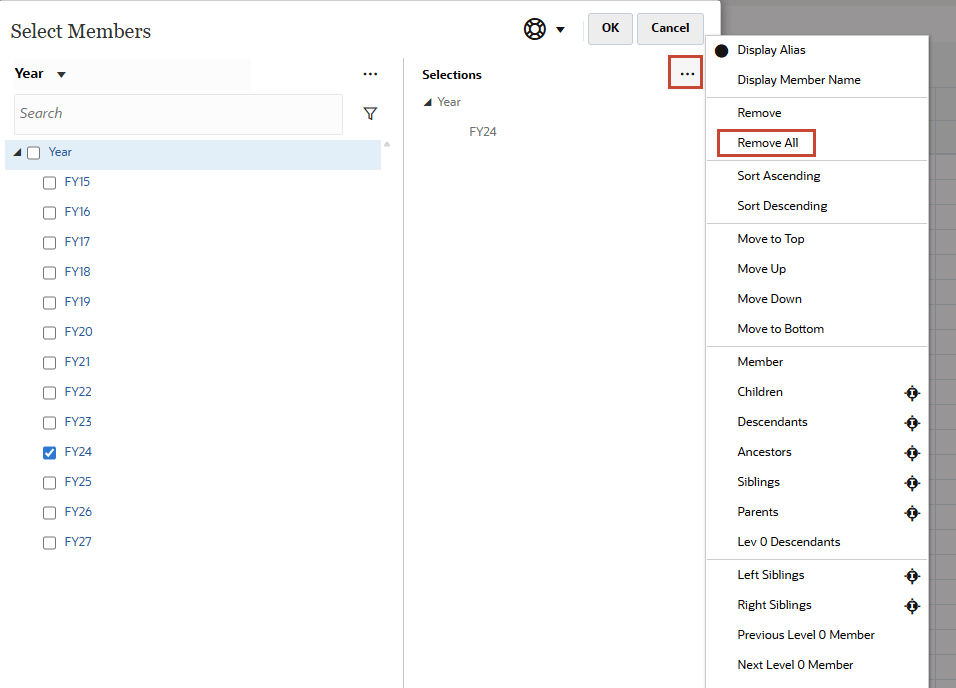
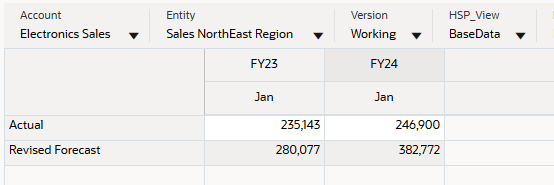
- For the year, select FY23, and click OK.
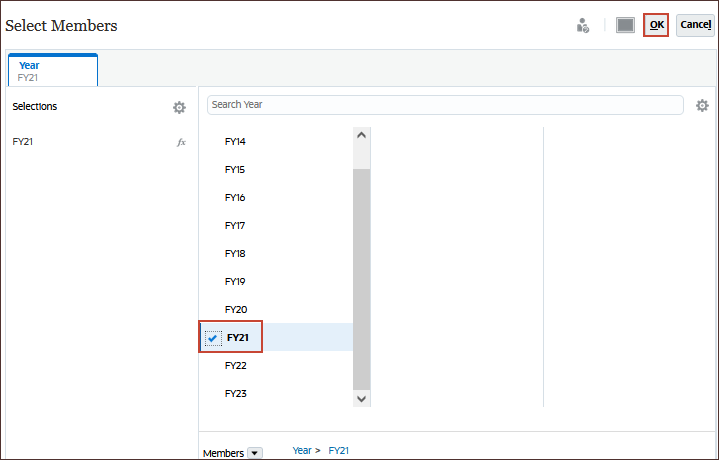
- Repeat the above steps to select as shown here:
Tip:
You can Zoom out or Zoom In for the months.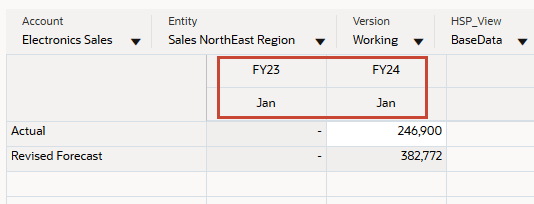
- Click
 (Refresh).
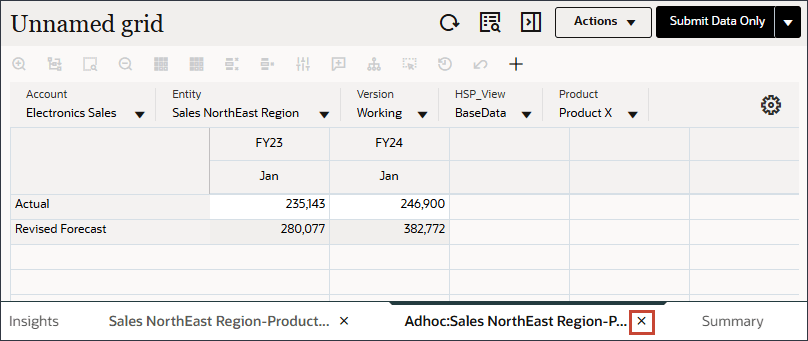
The Actual and Forecast values for the Jan month of both years are displayed.
- Close the AdhocSales NorthEast Region-Product X tab, by clicking the X.
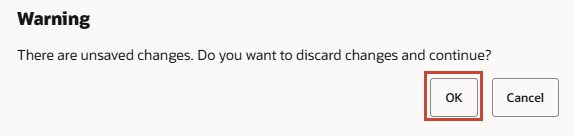
- At the Warning message, click OK.
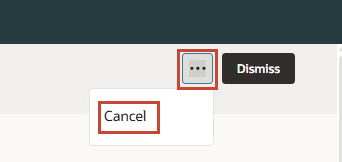
- Click ...(More Actions), and select Cancel to close the insight and return to the Insights Dashboard.
Overriding the Current Forecast
For Prediction insights, you can review where variances are greatest between future forecasts and the predicted values. You can update your forecast to use the predicted values. You can also manually revise any of the predicted values before you update the forecast. You can override the current forecast either with the forecasted numbers or with the predicted numbers.
- In the Search area, for type, click Forecast Variance & Bias.
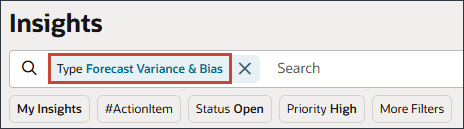
- Click Prediction, and then click Forecast Variance & Bias to clear that selection as shown below:
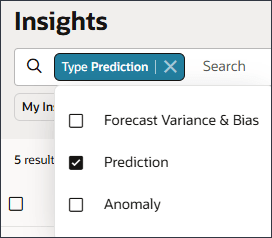
- Click on the white-space outside the search bar to close the selection.
- Scroll down to the bottom and for the Sales NorthEast Region-Sentinal Custom Notebook, under Actions, click (Actions), and select View Details.
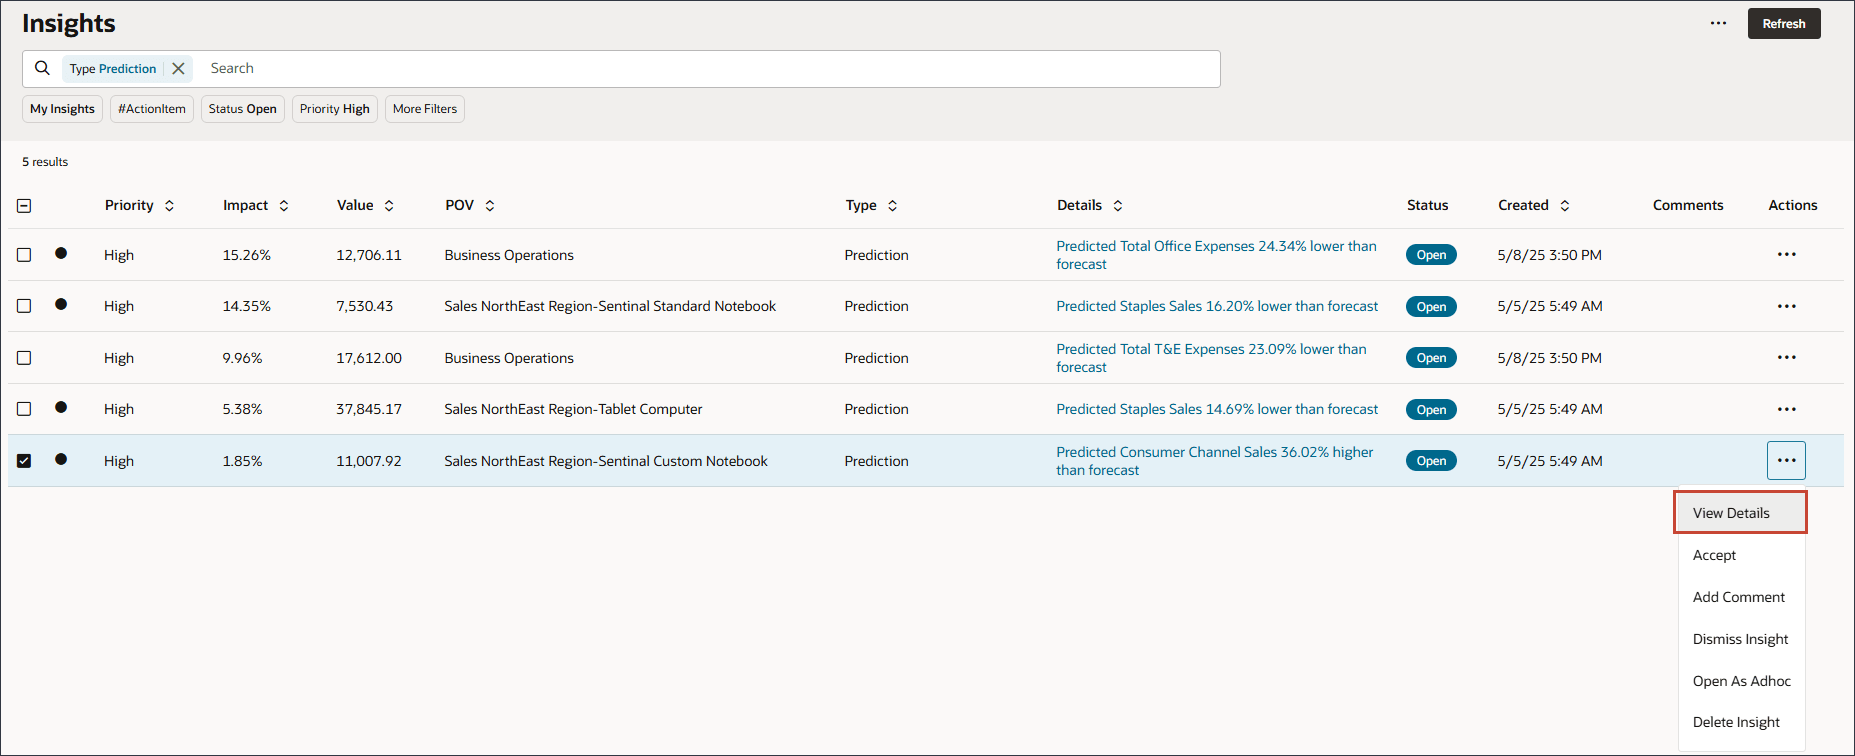
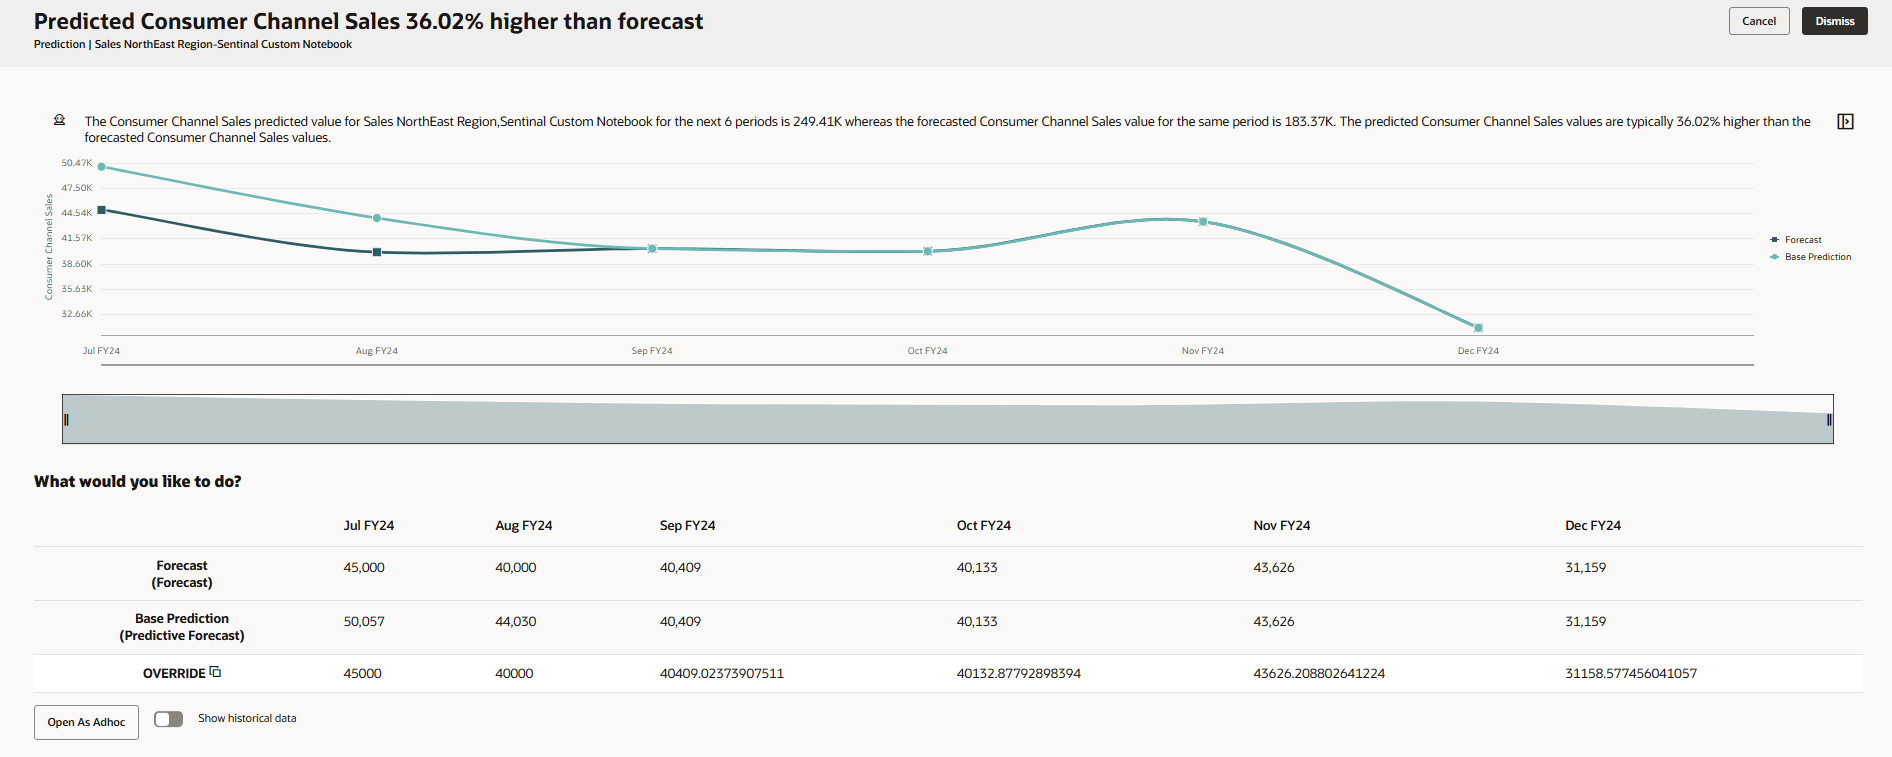
- Review information about this insight.
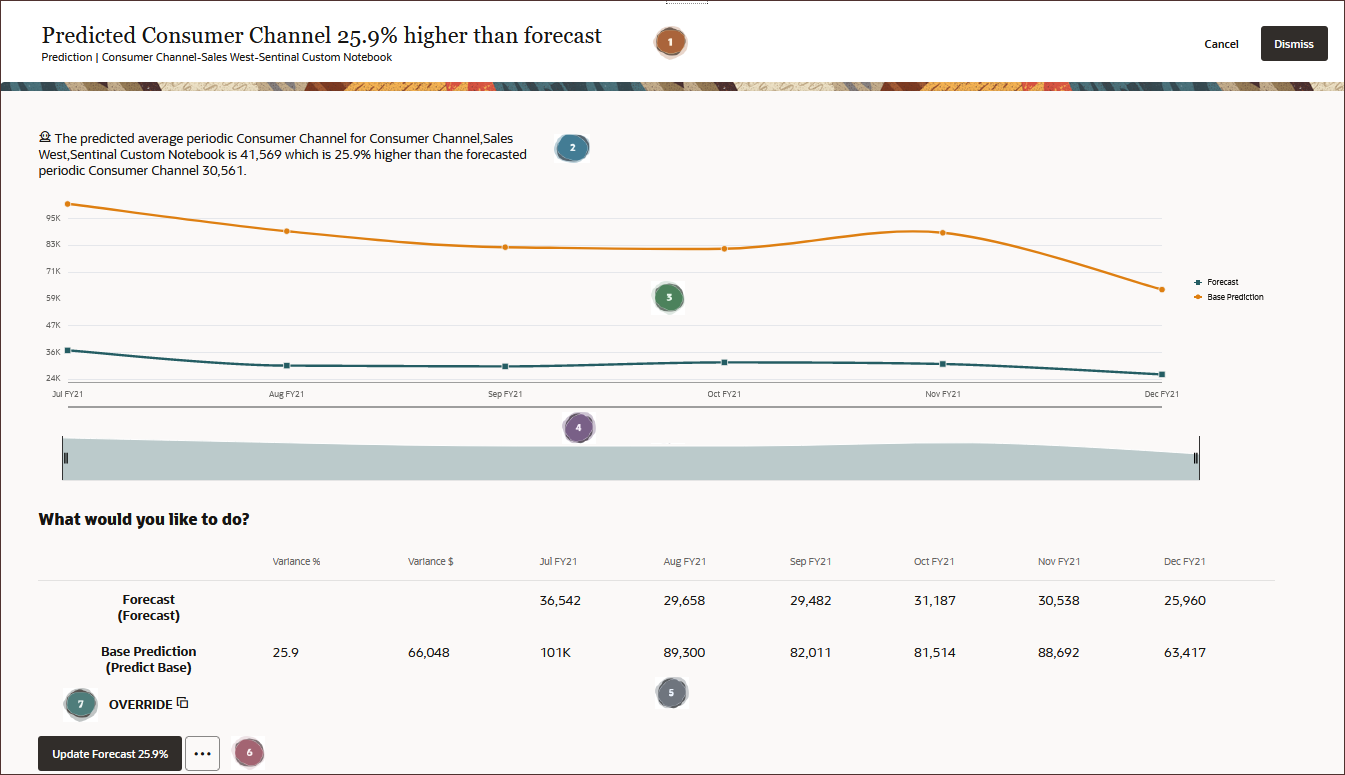
The title of the insight is displayed. It provides information about the insight. The description at the top of the page provides more details about the insight in a narrative format. This section includes the chart with the underlying data used for the analysis. There is a horizontal slider where you can change the time period shown in the chart. This section shows the data used for the analysis shown in a table.  Update - Updates the forecast data with the predicted values. Open As Adhoc - Opens the insight for further ad hoc analysis. Show historical data - Updates the chart to show historical data as well as future data.
 Below the data section, you can override the forecast using either the prediction data or forecast data.
  Show/hide Explainability section - The section on details about an insight or to enter comments.
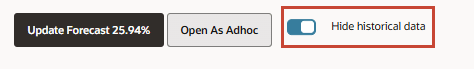
 - Click Show historical data.
The chart is updated to show historical data as well as future data.
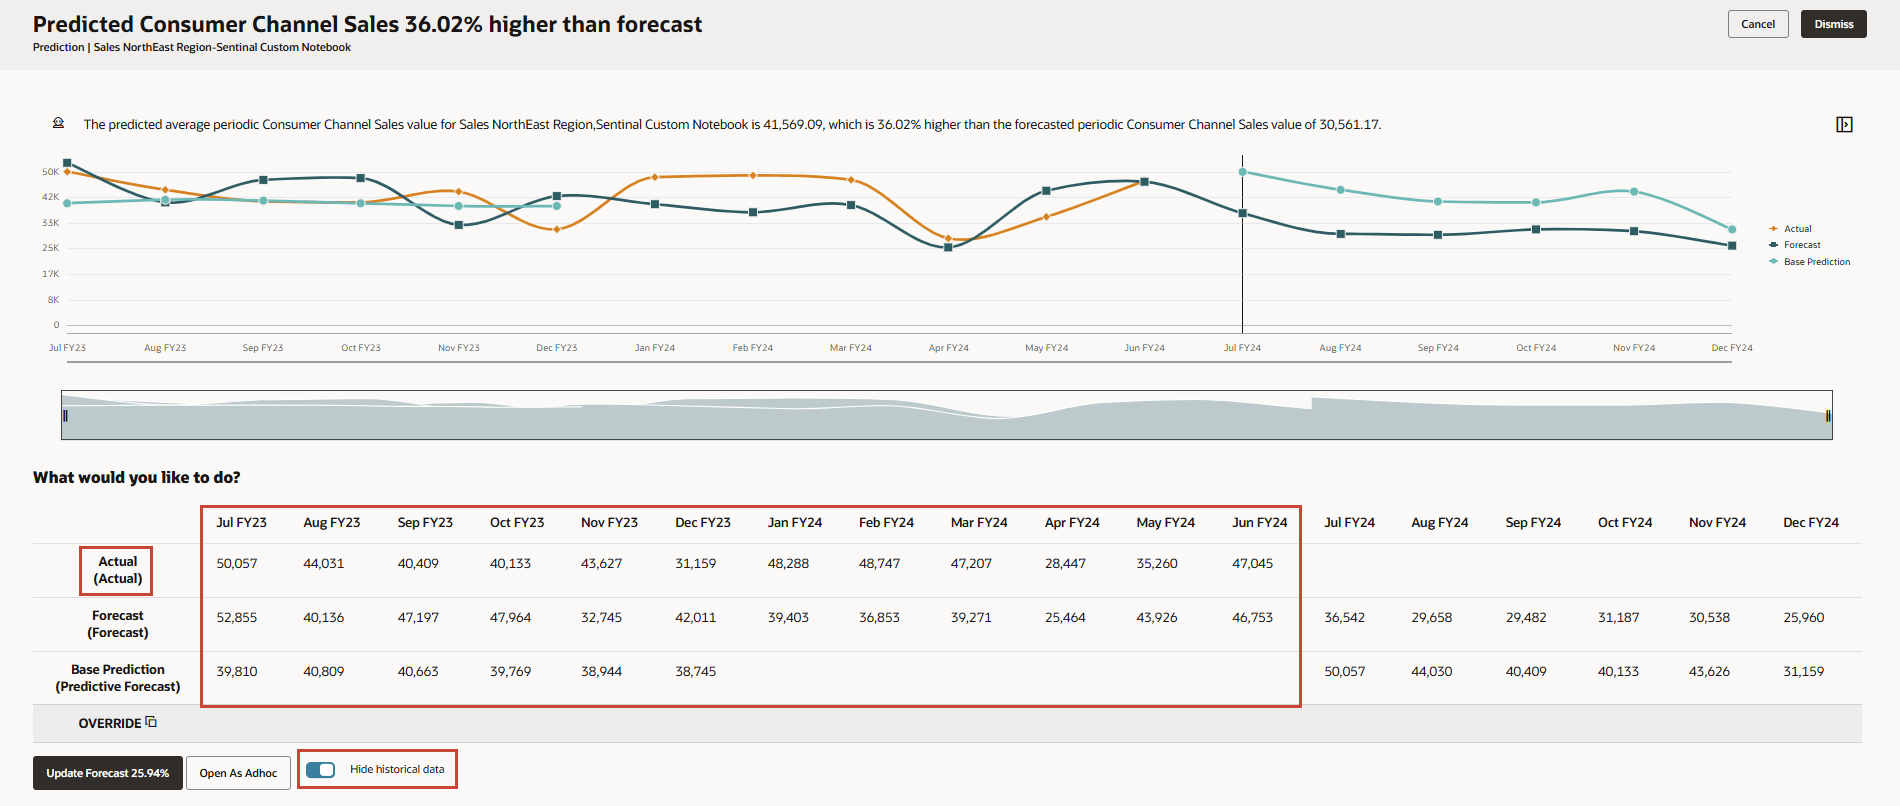
- Click Hide historical data.
- Select the Base Prediction row, and to the right of Override, click
 (Override).
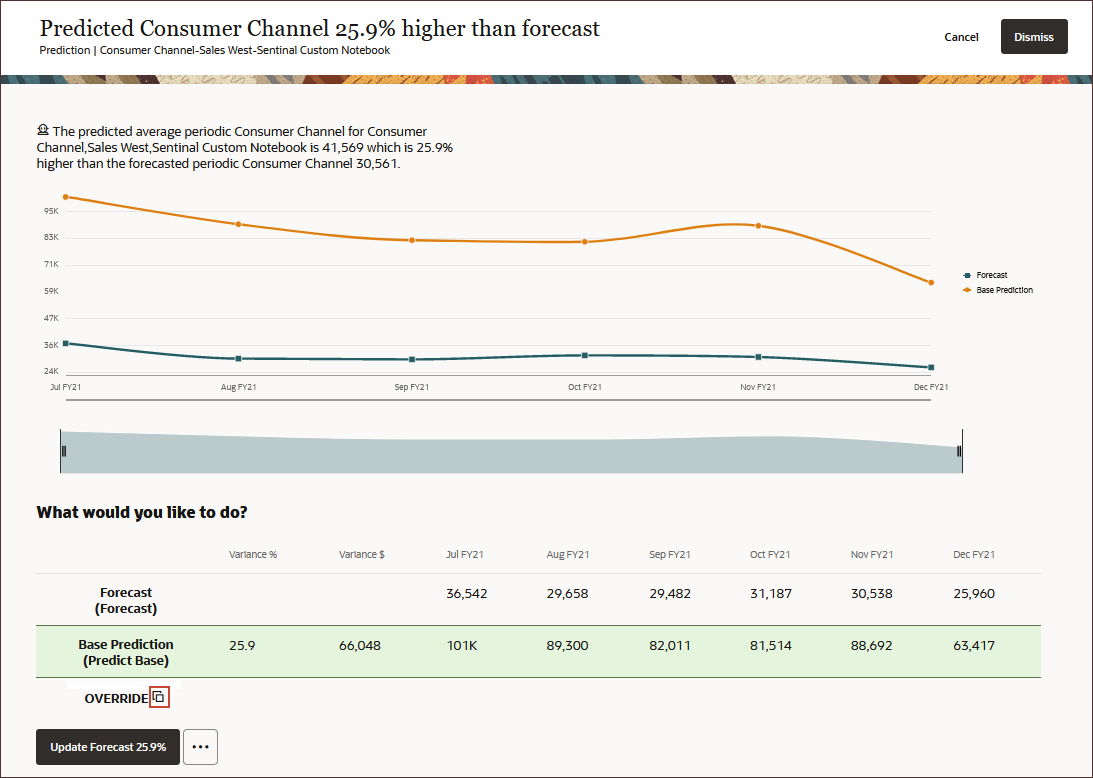
The Base Prediction data is listed in the override row.
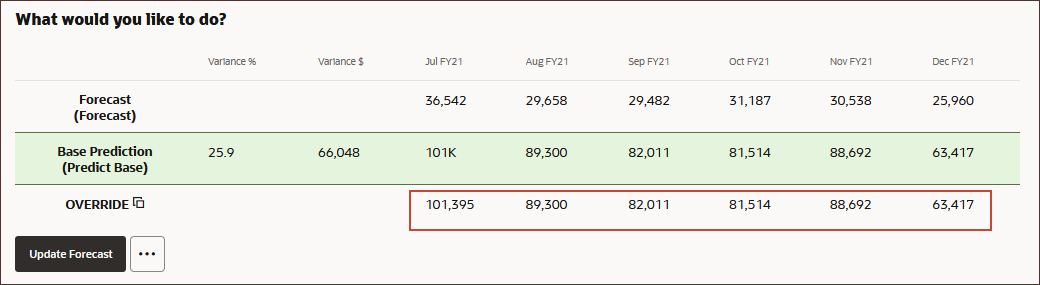
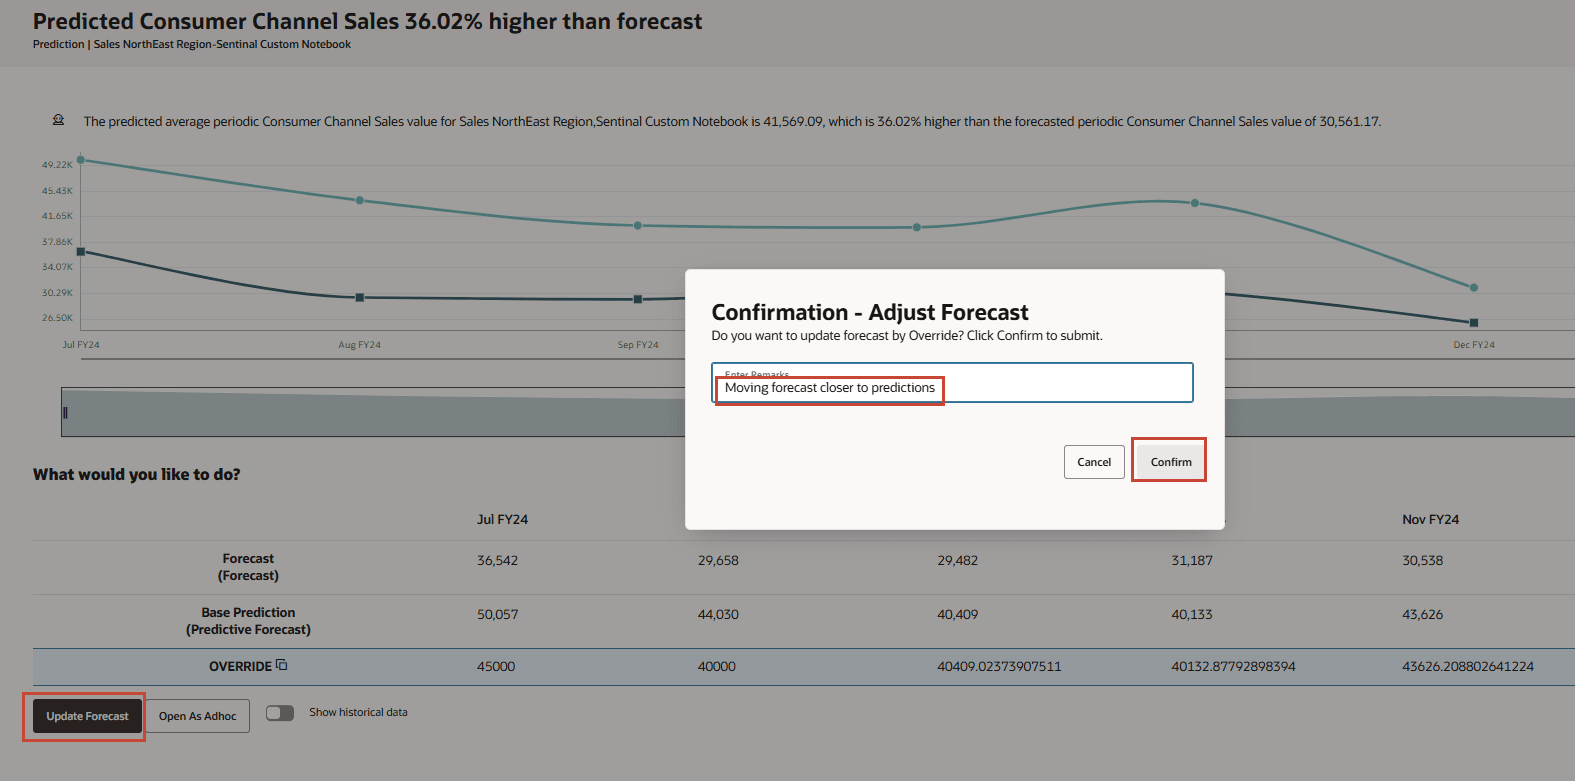
- Change the Override data based on the following:
- Jul FY24: 45000
- Aug FY24: 40000
Tip:
Double-click and type in the field to change the value. Press Enter when done. - Click Update Forecast.
- Add a comment in Confirmation - Adjust Forecast that says "Moving forecast closer to predictions", and click Confirm.
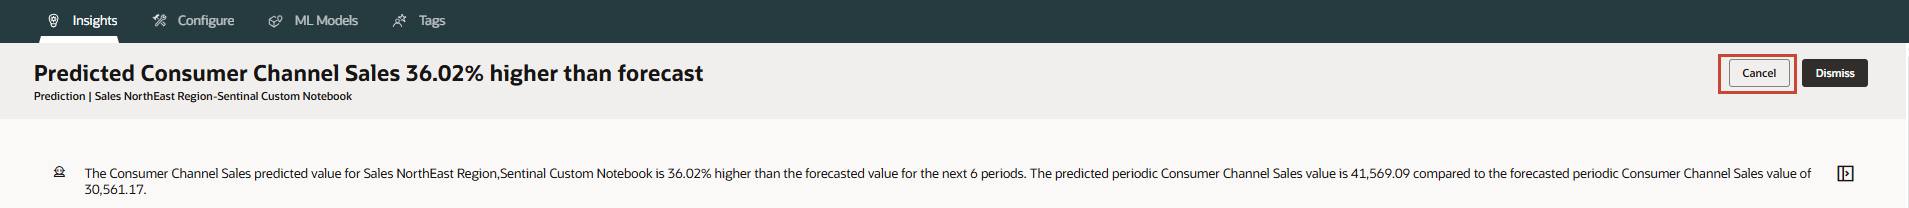
The forecast is adjusted and the chart is updated. With insights you can perform quick action on your forecast based on predicted data values and your own judgement.
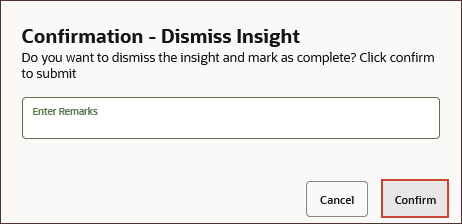
- Click Dismiss to change the status of the insight to Closed.

- In the Confirmation message, click Confirm.
- Click Cancel.
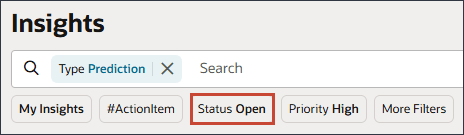
- Click Status Open.
- For Status, click Open.
- Click Closed, and then click Open to clear that selection as shown
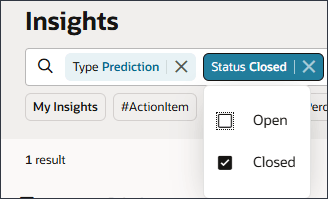
- Click on the white-space outside the search bar to close the selection.
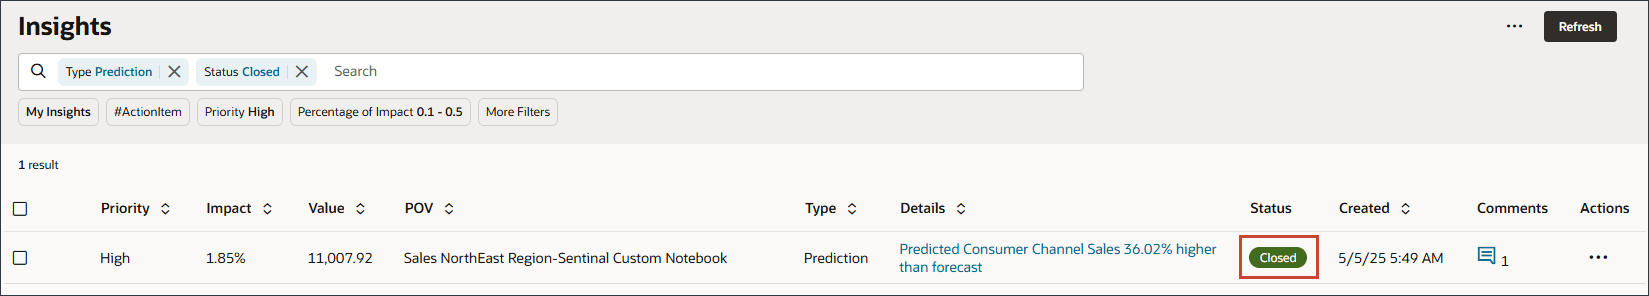
Closed insights are displayed on the Insights dashboard. The status for the insight you dismissed is "Closed".
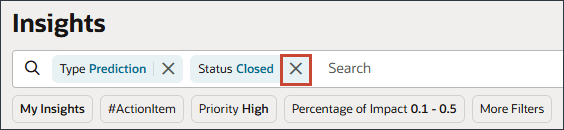
- For Status Closed, click X.
Dismissing Insights
Before generating insights again, you can remove any existing insights so you can clearly distinguish any new insights generated. You remove insights from the insights dashboard by dismissing them. When you dismiss an insight, its status changes to Closed.
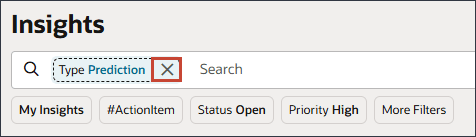
- On the Insights dashboard, in Search, to the right of Prediction, click X.
- For Sales West Region-Sentinal Standard Notebook, click (Actions), and select Dismiss Insight.
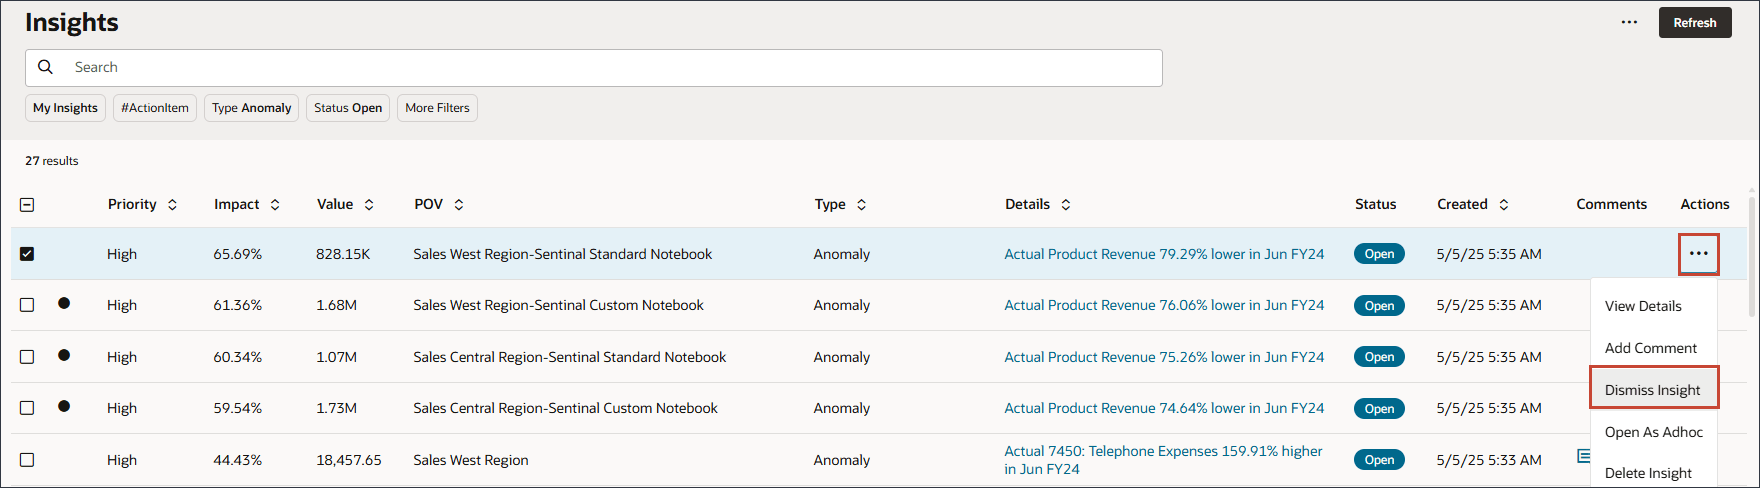
Tip:
You can also dismiss all insights at one time by using the selection box in the top left of the Insights dashboard, and the Dismiss button in the upper right of the dashboard. - At the Confirmation message, click Confirm.
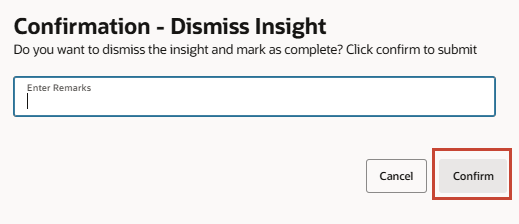
The Insight is removed from the list.
More Learning Resources
Explore other labs on docs.oracle.com/learn or access more free learning content on the Oracle Learning YouTube channel. Additionally, visit Oracle University to view training resources available.
For product documentation, visit Oracle Help Center.
Analyzing Insights and Taking Action
F56999-03
October 2025