Introduction
This tutorial shows you how to configure insights to generate insights that display on the Insights dashboard. The sections build on each other and should be completed sequentially.
Background
IPM Insights analyzes past data and predicted data, helping you find patterns and insights into data that you might not have found on your own. Insights can be trends, anomalies, forecast bias, or variations. With IPM Insights, the insight discovery phase of the planning process is automated with data science and financial pattern recognition, enhancing your forecast effectiveness. Using IPM Insights, you can analyze and explore data across any account. IPM Insights automates processing large amounts of multidimensional data, so that as new actuals come into the system, you quickly detect patterns in your data or hidden correlations, streamlining reporting, improving your forecasting, and strengthening your decision making. You spend less time in analysis, saving time in the overall planning process.
You configure IPM Insights by selecting the type of analysis to perform, specifying the slice definitions for analysis, configuring the analysis, and then defining the settings for the insights displayed on the Insights dashboard. You can define insights for as many data intersections as you need. Planners see insights only for slices of data to which they have access.
You can also define a prediction using Auto Predict to predict future performance based on historical data and schedule a job to run that prediction definition, automating the prediction process. You can use these prediction results as input for generating insights.
Prerequisites
Cloud EPM Hands-on Tutorials may require you to import a snapshot into your Cloud EPM Enterprise Service instance. Before you can import a tutorial snapshot, you must request another Cloud EPM Enterprise Service instance or remove your current application and business process. The tutorial snapshot will not import over your existing application or business process, nor will it automatically replace or restore the application or business process you are currently working with.
Before starting this tutorial, you must:
- Have Service Administrator access to a Cloud EPM Enterprise Service instance. The instance should not have a business process created.
- Upload and import this snapshot into your instance.
Note:
If you run into migration errors importing the snapshot, re-run the migration excluding the HSS-Shared Services component, as well as the Security and User Preferences artifacts in the Core component. For more information on uploading and importing snapshots, refer to the Administering Migration for Oracle Enterprise Performance Management Cloud documentation.Exploring Insights
In this section, you explore Insights with a sample application for Vision. You analyze Revenue data for the Sales NorthEast Region entity and identify areas on which you need to focus in order to improve your forecasting for this entity. Insights can be set up for any data across any account or measure – revenue, expense, balance sheet, cash flow or volumes.
You start by reviewing the underlying data, both historical and future data for the Sales NorthEast Region entity.
- On the home page, click Data.
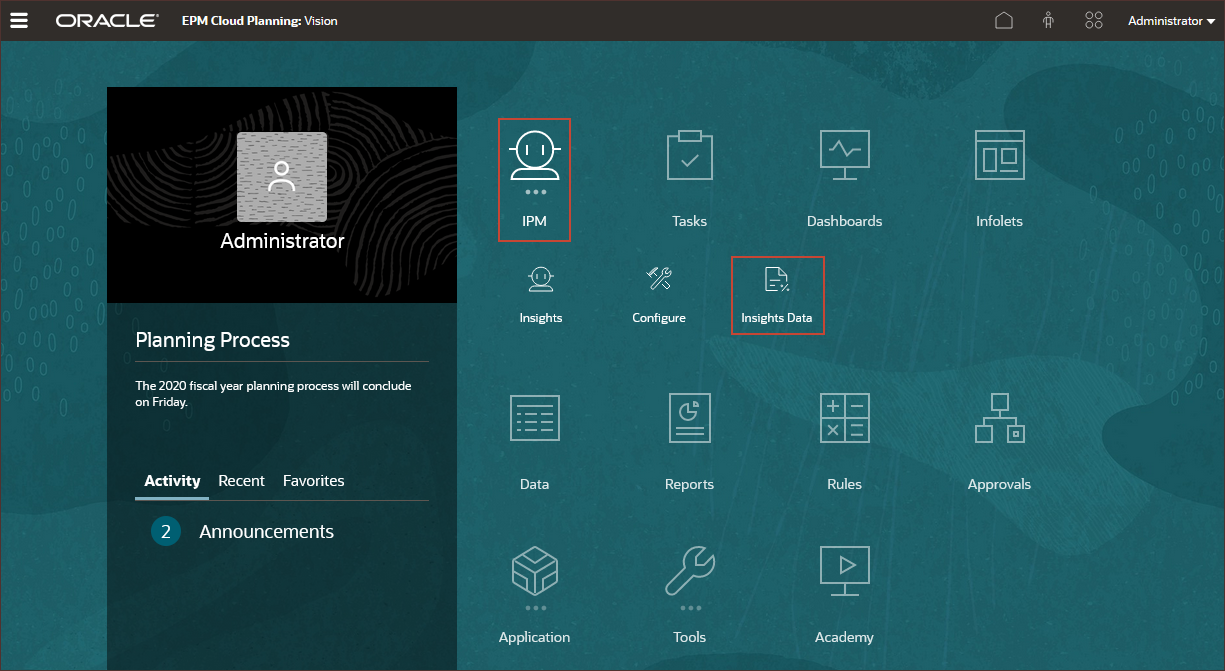
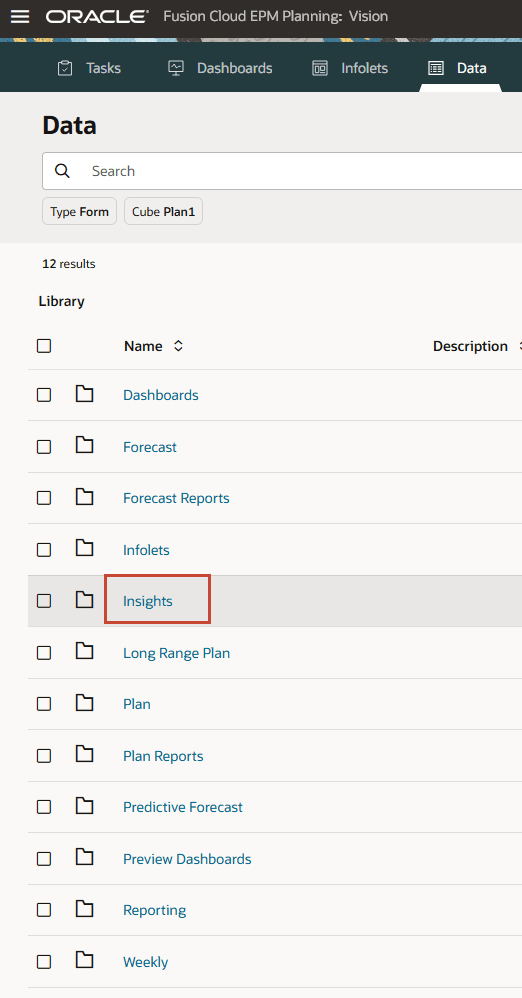
- In Data, click Insights.
- Click Historical data for Insights.
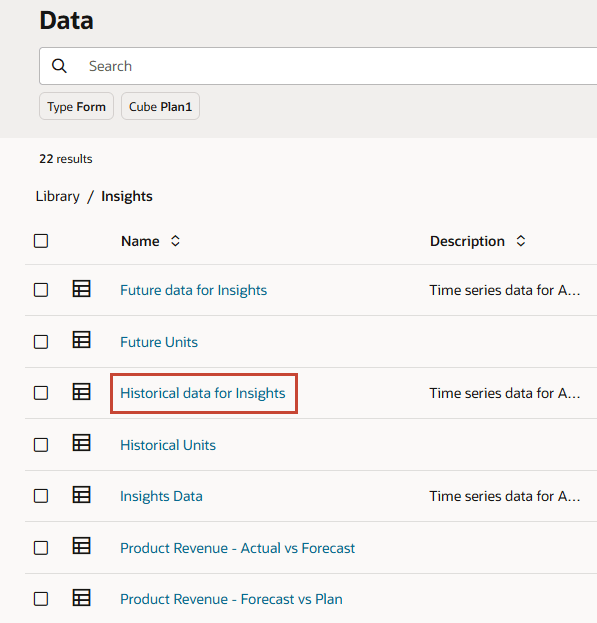
Historical data for Insights is displayed.
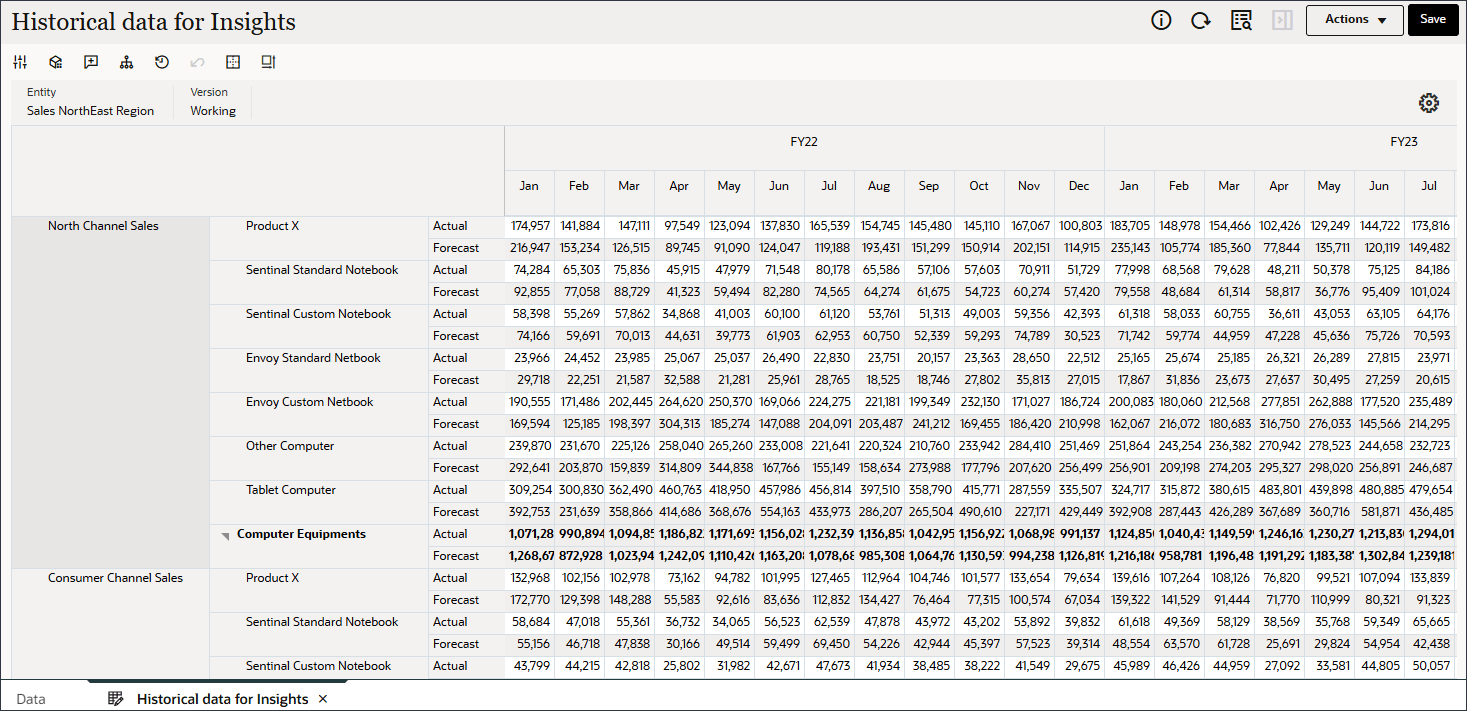
The Sales NorthEast Region entity has five Revenue accounts and seven Products.Revenue Accounts Sales North Channel Sales Consumer Channel Sales Medical Sales Electronics Sales Staples Sales
Products Product X Sentinal Standard Notebook Sentinal Custom Notebook Envoy Standard Netbook Envoy Custom Netbook Other Computer Tablet Computer - Take a data-driven approach to analyzing historical data and identifying areas where significant forecast variance and/or bias exist
- Leverage machine-generated predictions which incorporate past trends and patterns to more accurately forecast data for the next six months
Data for historical actuals and historical forecasts is available starting from Jan FY22.
You will do the following:
Reviewing Calendars and Events
You can define calendars and events to associate with insights or predictions to improve the accuracy of the insights or predictions.
To use calendars and events with IPM Insights, Advanced Predictions, and Auto Predict:
- Define calendars.
- Define events.
- When configuring an IPM Insights job, Advanced Predictions, or an Auto Predict prediction definition, associate a calendar with the insight, Advanced Prediction, or Auto Predict job. Then, select whether to include events in the analysis.
Reviewing Calendars
A calendar defines the scope and range of the time series for selected cubes. For example, you can create a daily calendar, a weekly calendar, and an alternate calendar. You might want to create a calendar for a specific entity, because not all events are applicable to all entities. For example, Diwali applies to APAC and Thanksgiving applies to North America, so you can create an APAC calendar with its own events and a North America calendar with its own events.
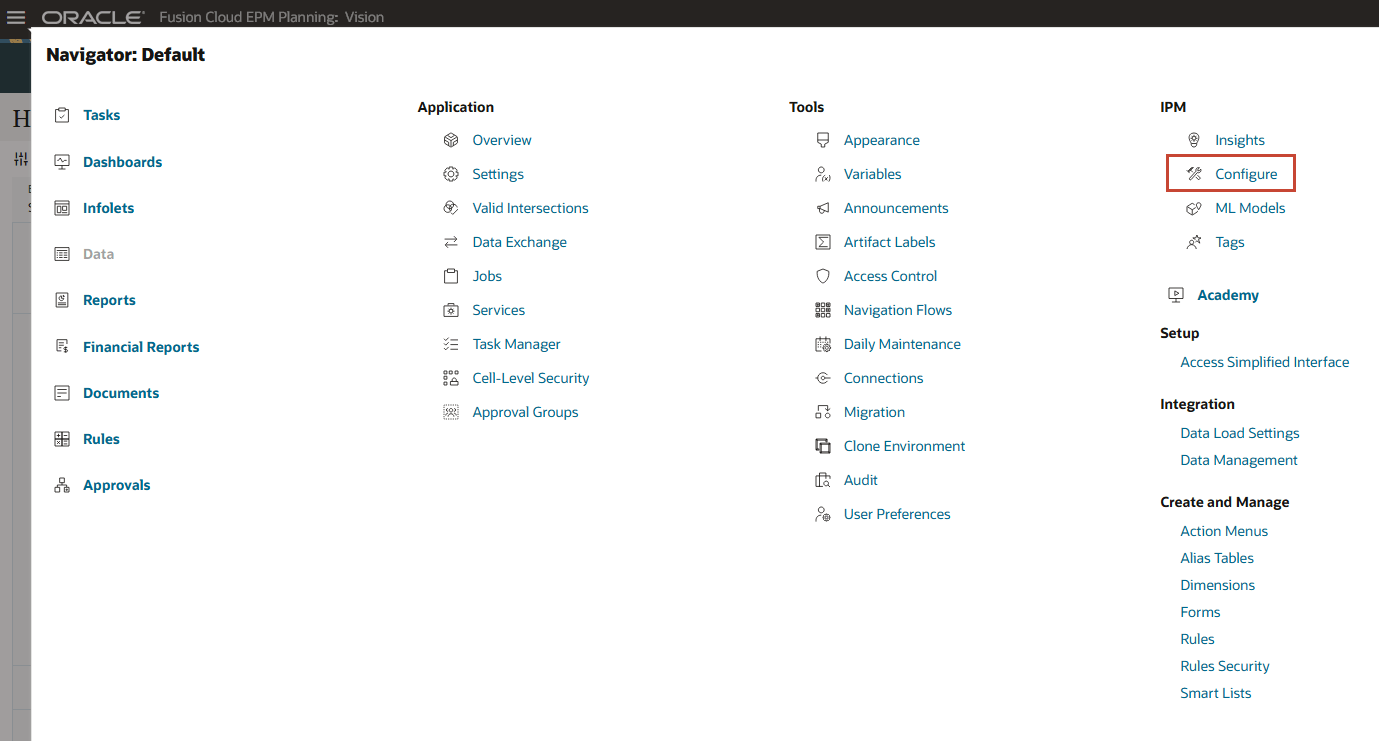
- Click
 (Navigator) and under IPM, click Configure.
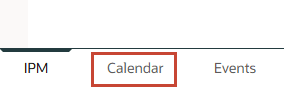
- From the horizontal tabs at the bottom, click Calendar.
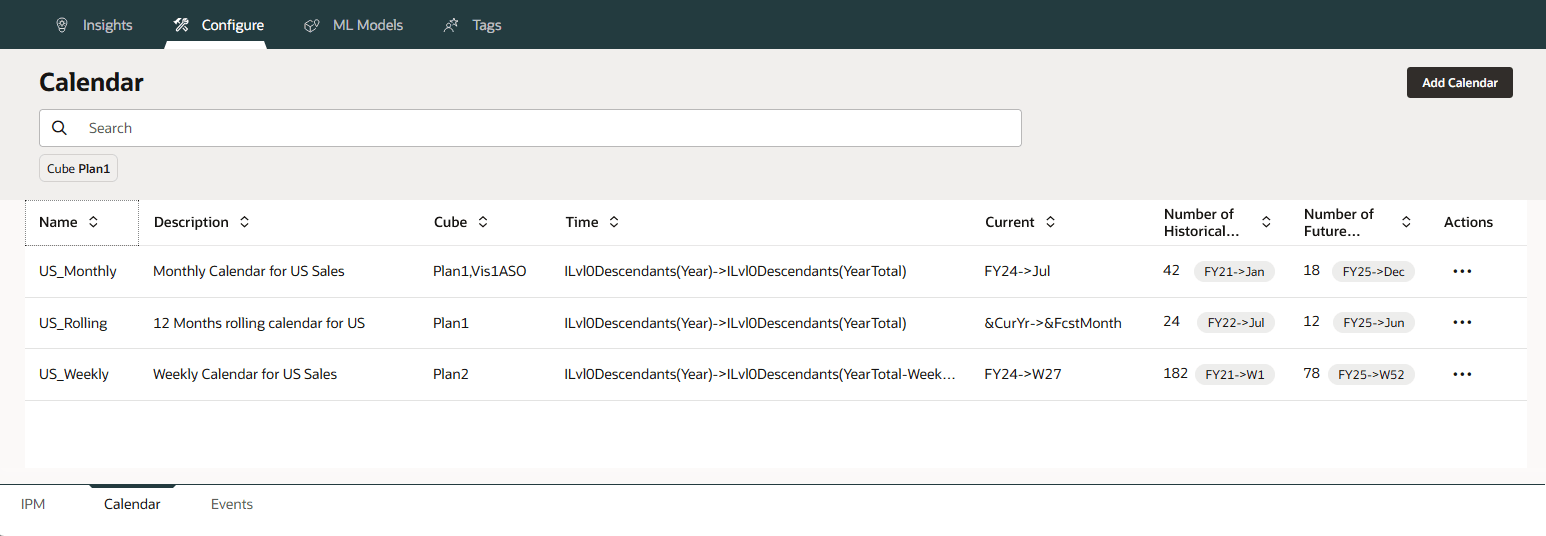
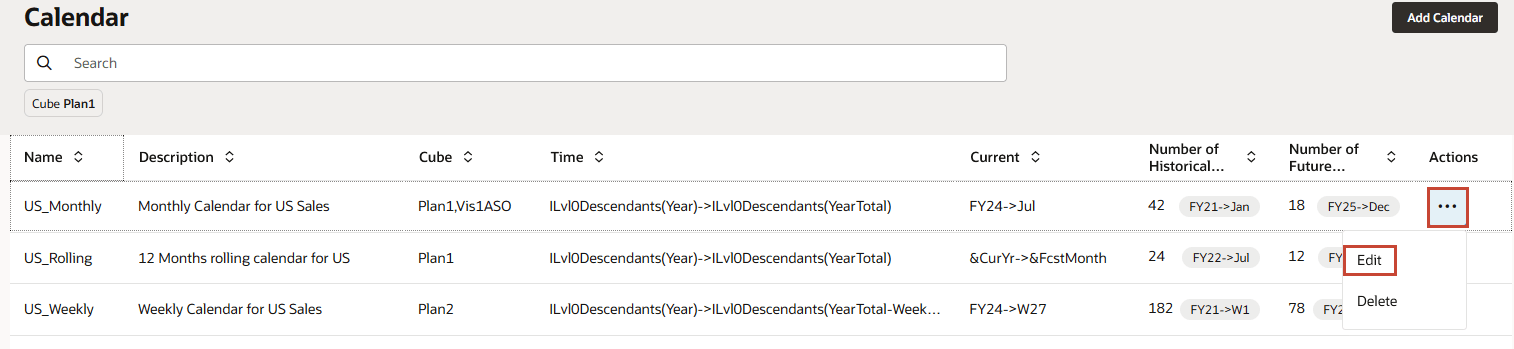
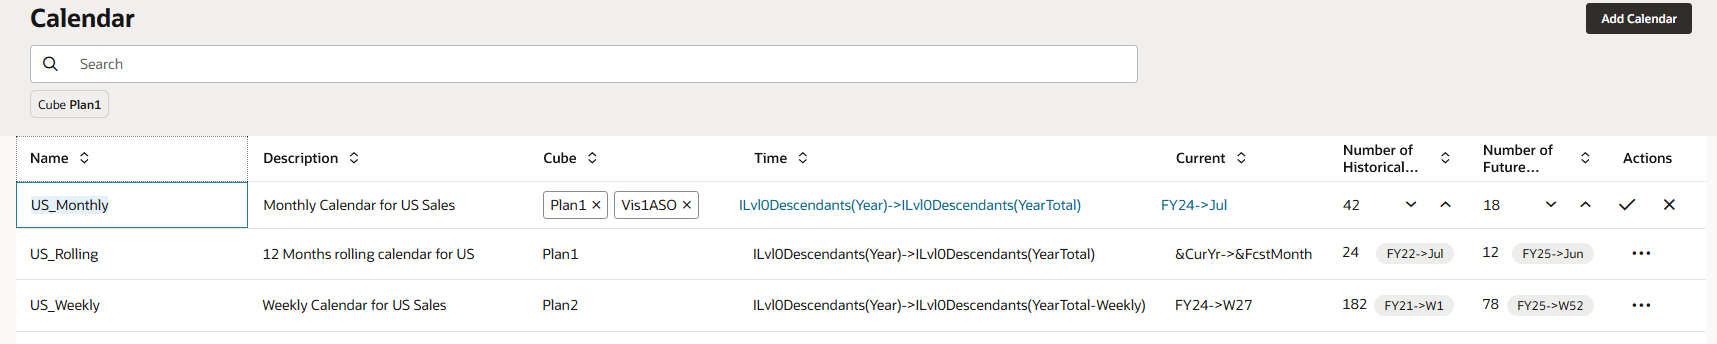
Calendars for Monthly, Rolling and Weekly forecasts are displayed.
- For US_Monthly, click Actions then Edit.
US_Monthly calendar is setup as Monthly Calendar for US Sales. The calendar applies to the cubes - Plan1, Vis1ASO. In the Time column, the members from each dimension that define time for the start of the calendar are specified.
- For US_Monthly, click ILvl0Descendants(Year)->ILvl0Descendants(YearTotal).
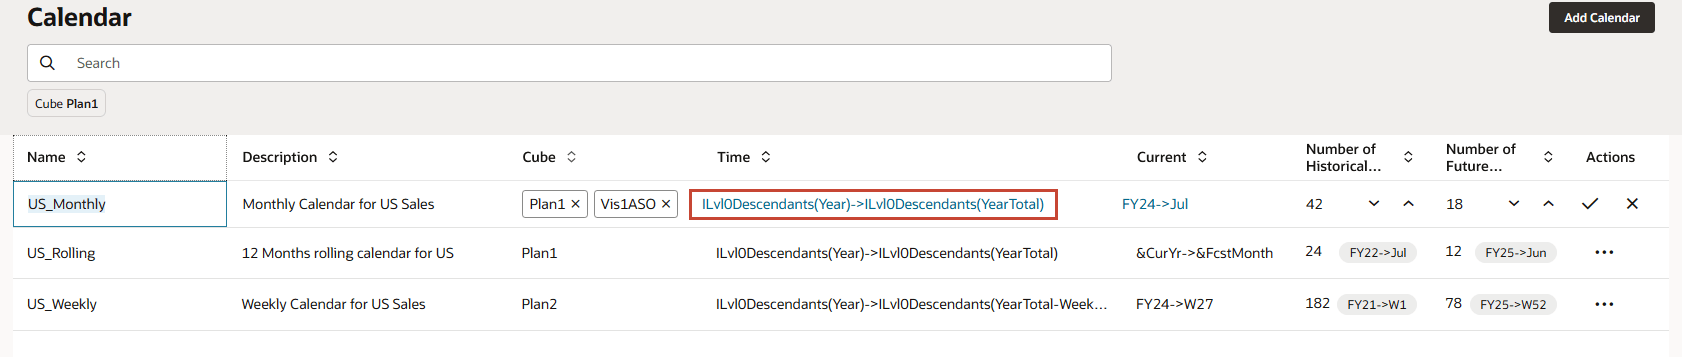
For Year and Period, Level 0 Descendants are selected.
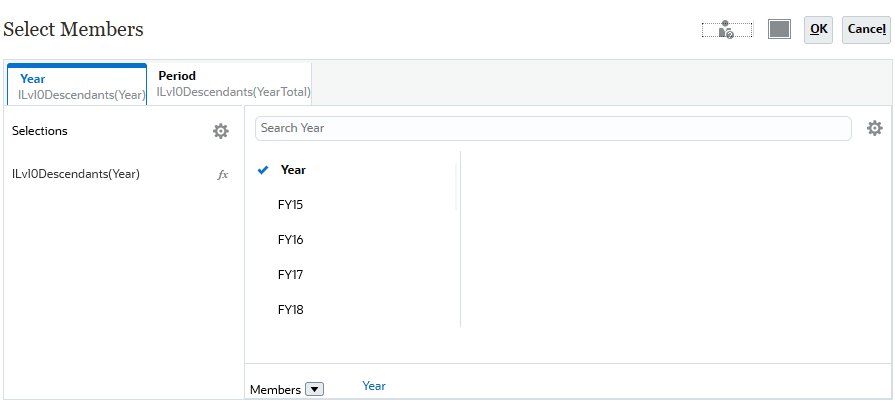
- In Select Members, click Cancel.
- For US_Monthly, click FY24->Jul.
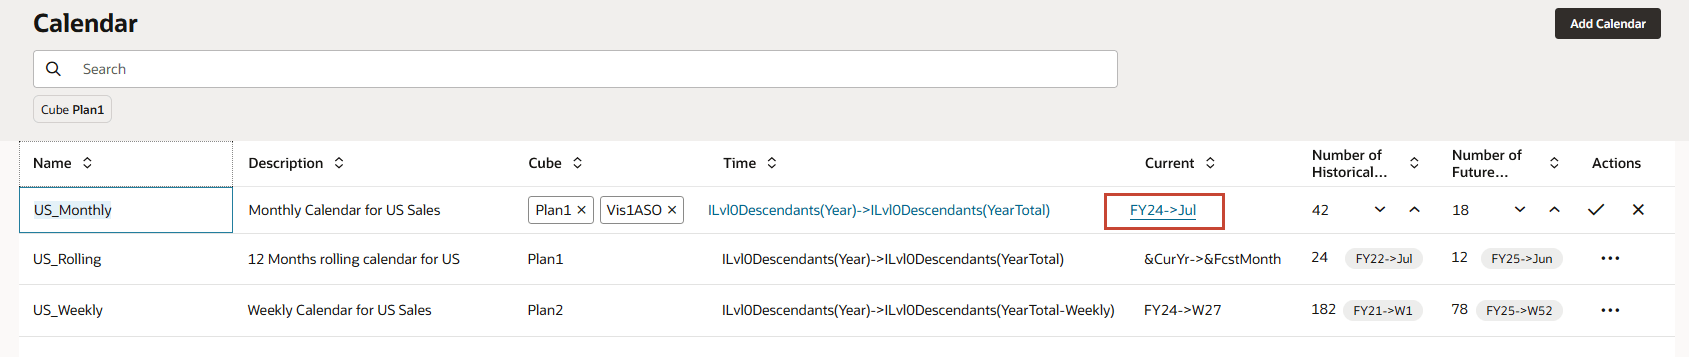
In the Current column, the members from each dimension that define the start of the prediction period are specified. The previous period is the end of historical data. Prediction period starts from July FY24.
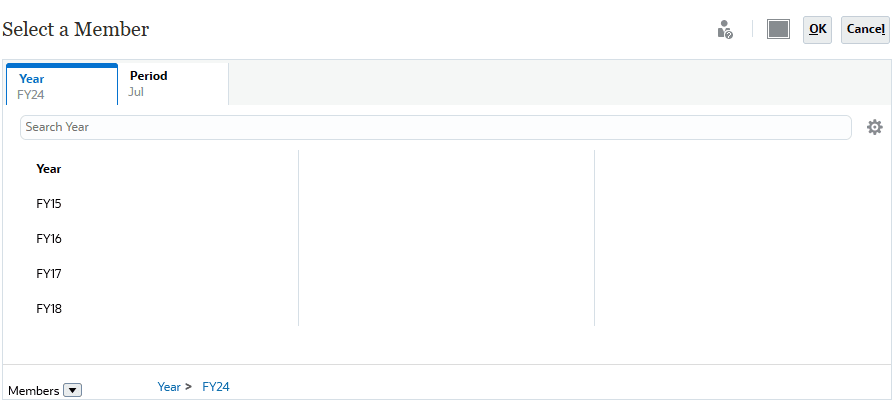
- In Select a Member, click Cancel.
- For US_Monthly, under Actions click X (Cancel).
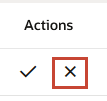
In Number of Historical Periods the number indicates 42 months of historical data will be used. In Number of Future Periods the number indicates 18 months of future periods will be used in this calendar.
Reviewing Events
Events are associated with calendars. Each IPM Calendar can have multiple Events.
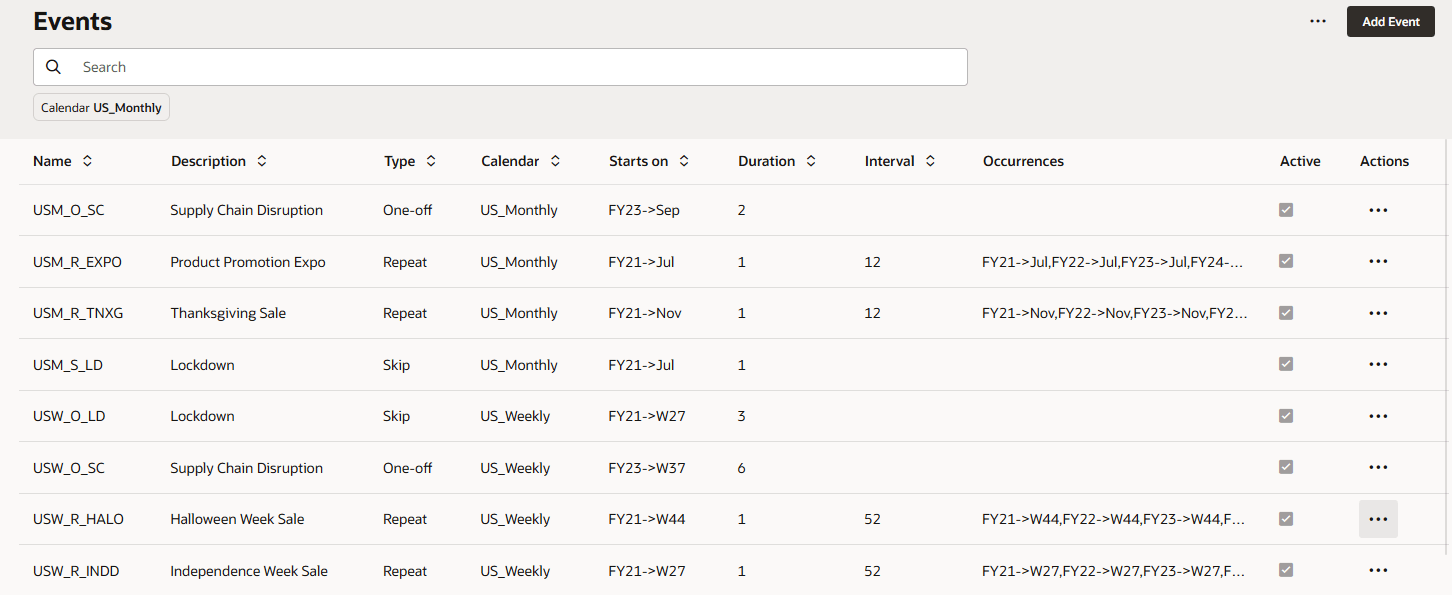
- From the horizontal tabs at the bottom, click Events.
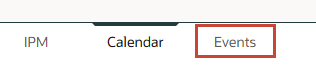
Events for the three Calendars Monthly, Rolling and Weekly (Calendar column) are displayed. Notice that the Type column indicates the type of event:
- One-off: An event you don’t expect to be repeated, but you want to include it in your data.
- Repeat: An event that is regularly repeated, where increases or decreases will also be repeated. For example, holidays such as Diwali or Thanksgiving are repeating events.
- Skip: Similar to a one-off event, it’s an event you don't expect to be repeated, however, you don't want to include it in your data. Data for Skip events is removed from the series.
- For USM_O_SC, click Actions then Edit.
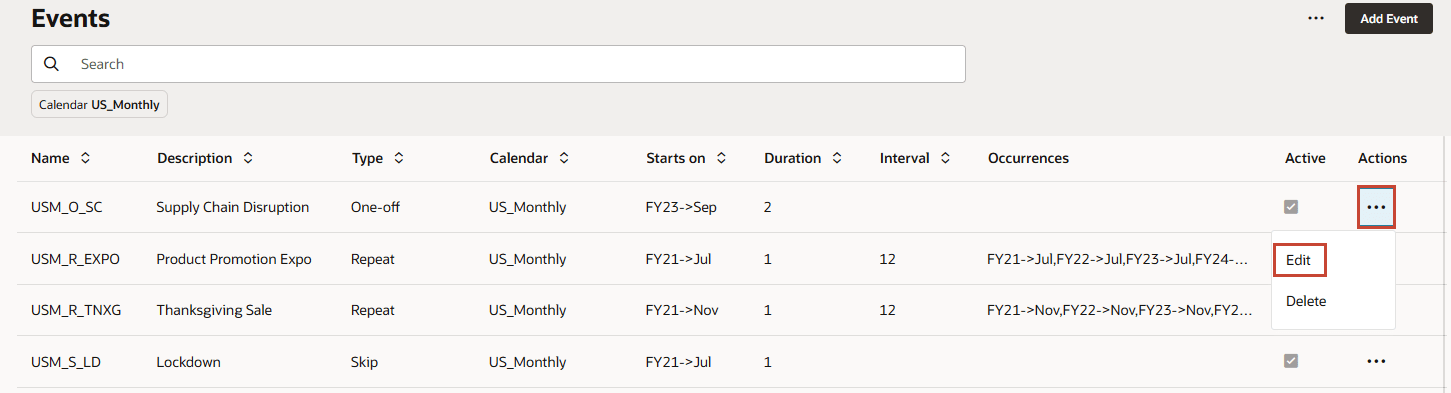
USM_O_SC event is setup as Supply Chain Disruption. The event is of One-off Type. The Calendar column indicates this event is associated with the US_Monthly calendar.
- For USM_O_SC, click FY23->Sep.
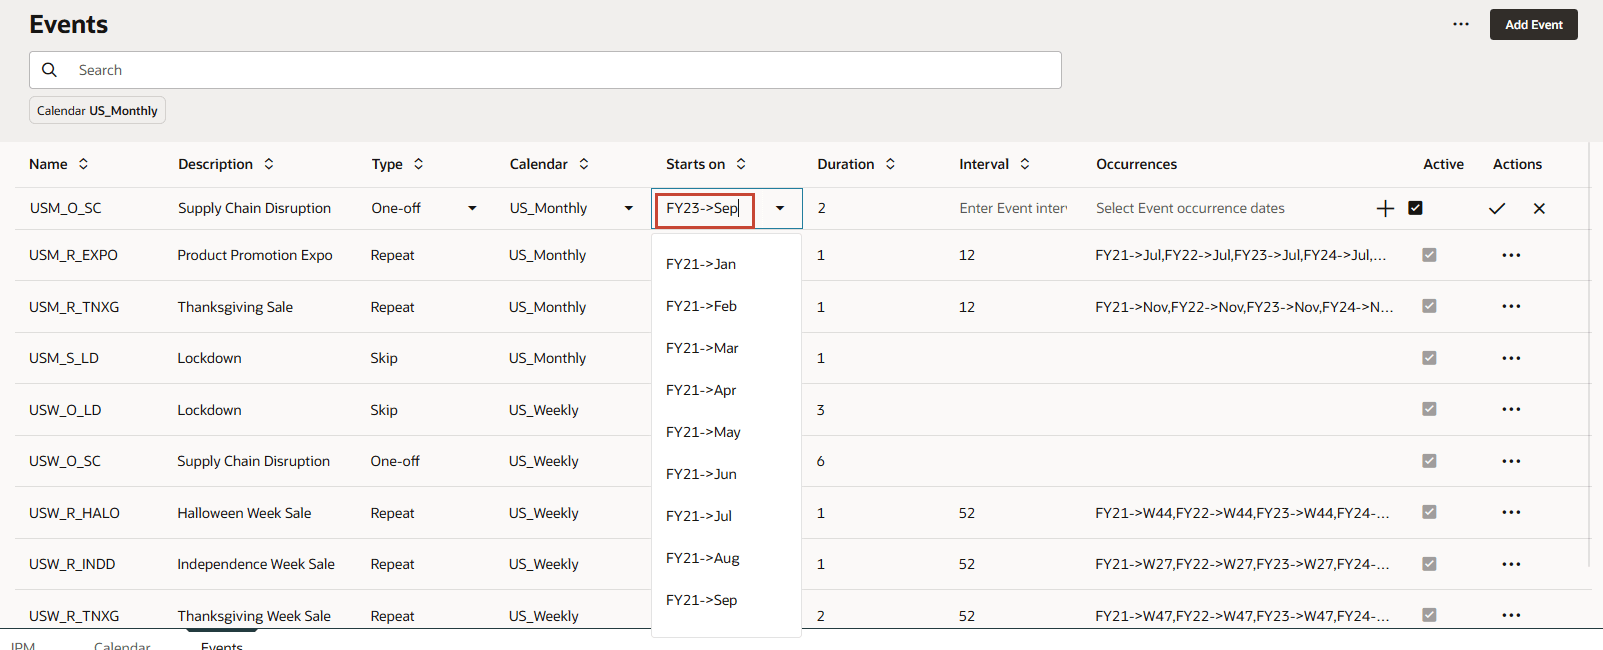
Duration for the event is specified as 2 months. Since this is One-off event there are no values specified for Interval and Occurrences.
- For USM_O_SC, under Actions click X (Cancel).
Configuring Insights
In this section, you create an insight by selecting the types you want to create. Then you define the historical and future data slices, set thresholds, and define display dimensions and impact magnitude thresholds.
Creating Insights
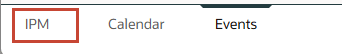
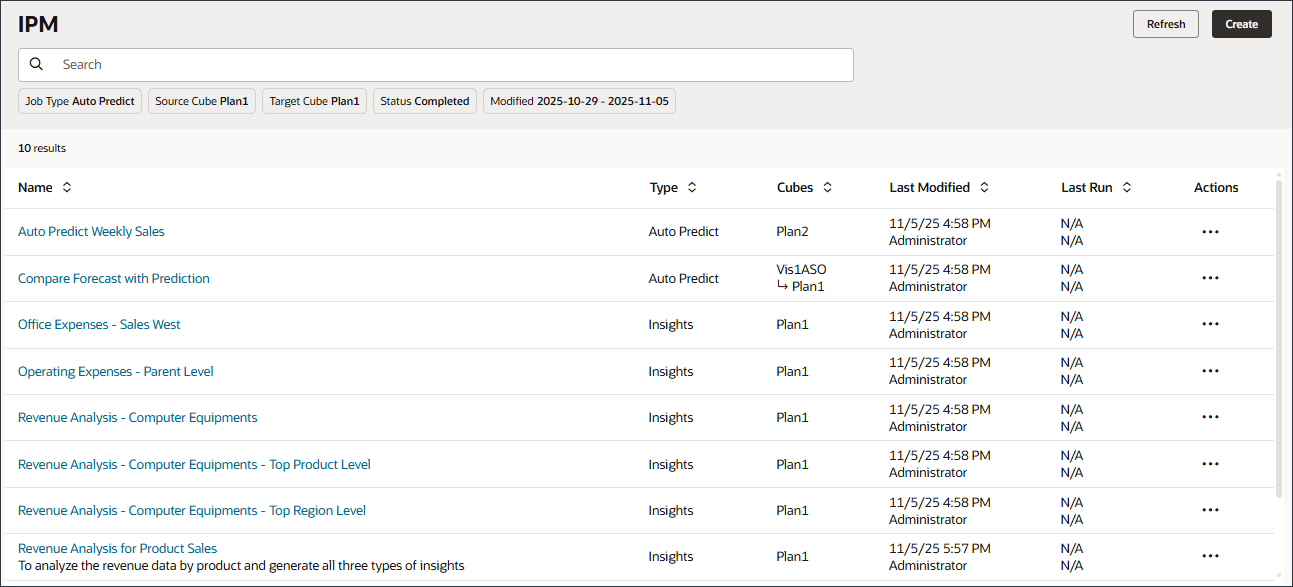
- Click the IPM tab.
- Click Create.
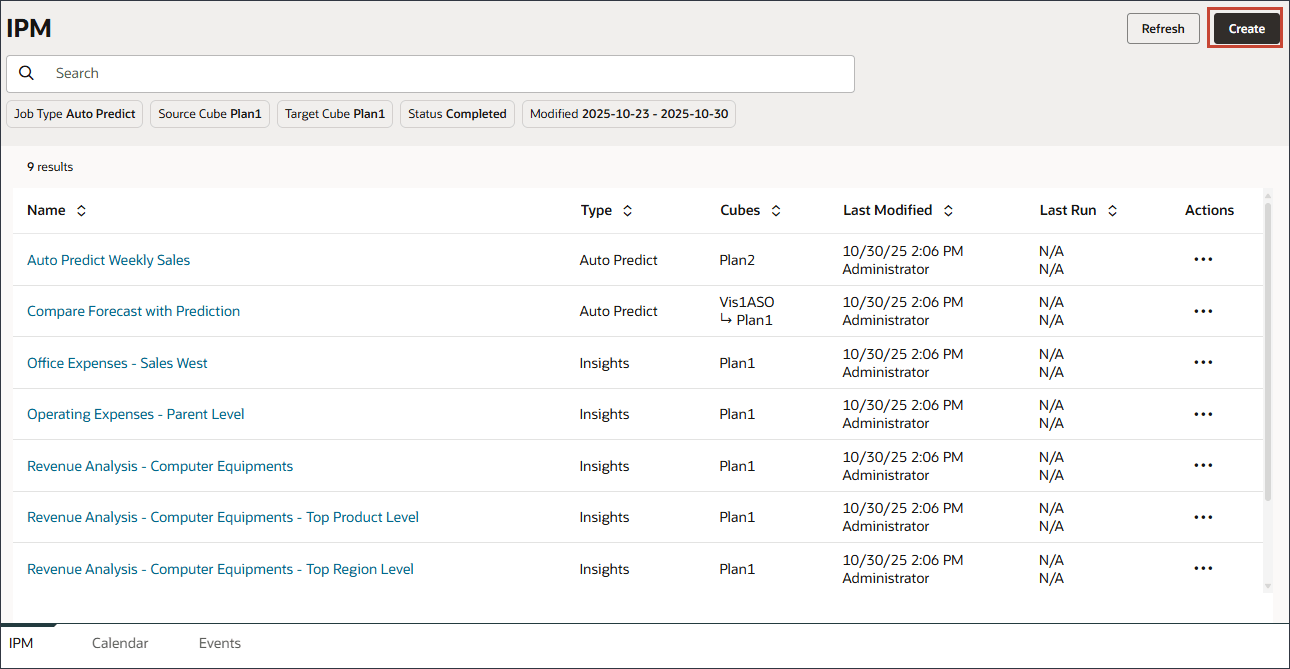
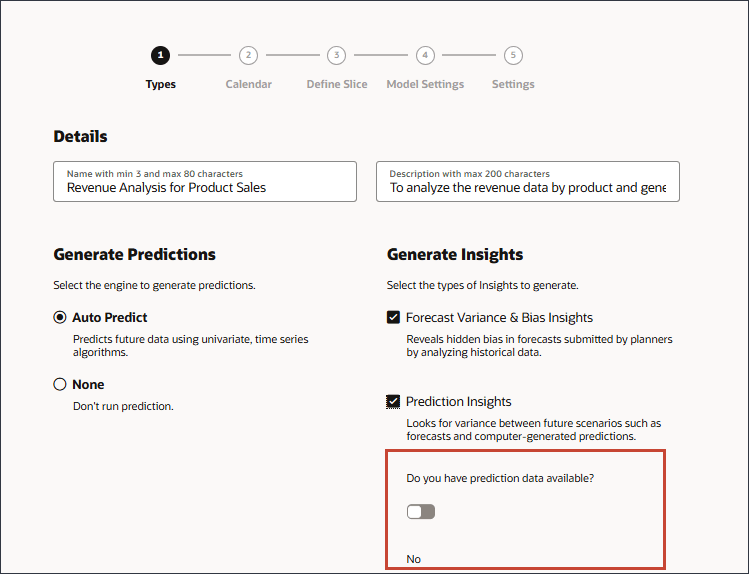
The Details page for IPM Configuration is displayed.
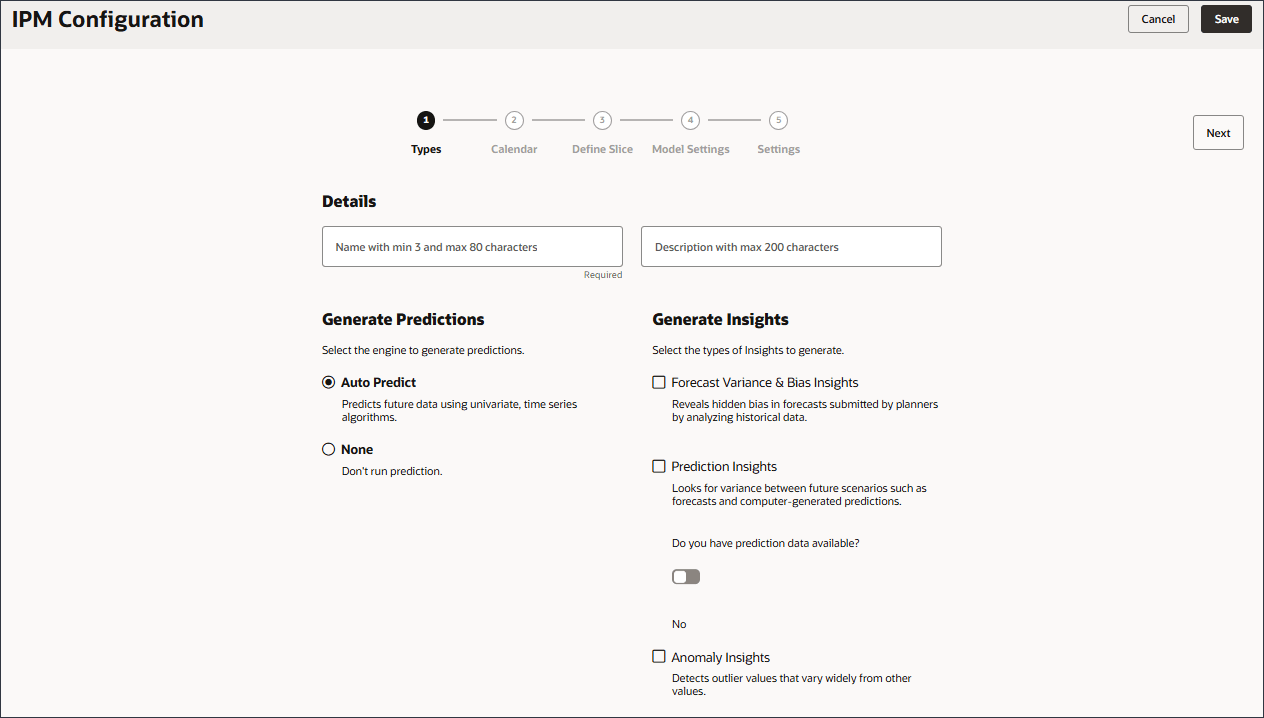
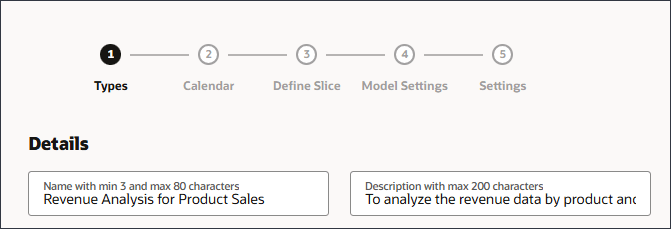
- In Details, for Name enter Revenue Analysis for Product Sales, and for description enter To analyze the revenue data by product and generate all three types of insights.
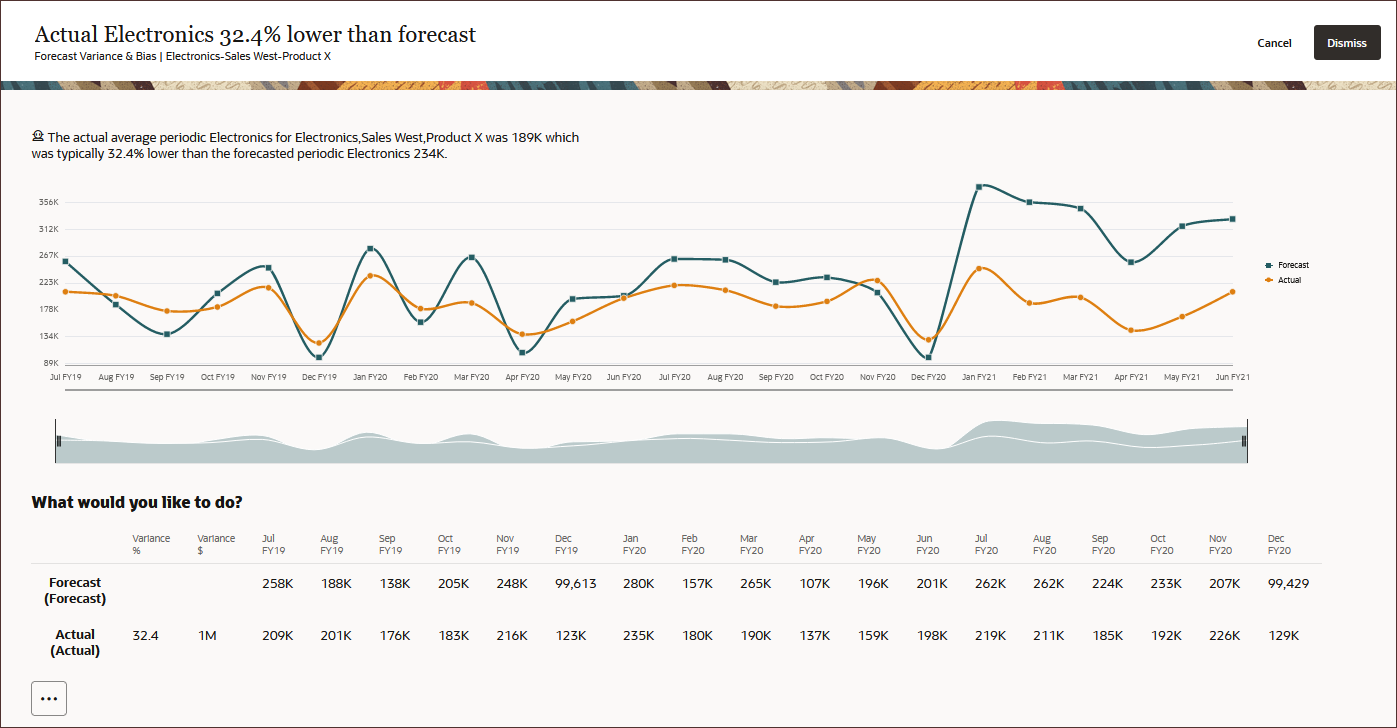
- Under Generate Insights, select Forecast Variance & Bias Insights.
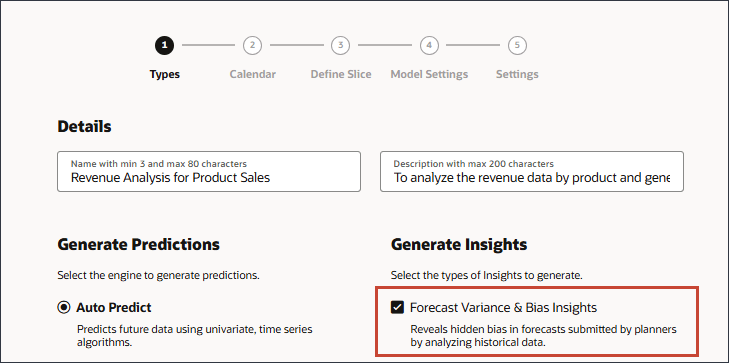
Forecast variance and bias insights analyzes historical data to reveal hidden bias in forecasts submitted by planners. This type of insight measures the variance or bias between two historical scenarios such as Forecasts and Actuals. .
- Under Generate Insights, select Prediction Insights.

Prediction insights look for variances between future scenarios such as forecasts and computer-generated predictions.
- Keep the default selection of No to indicate that you do not have prediction data available.
Note:
If you have prediction data, you can indicate that by clicking the option to toggle it on. With no predicted data, Auto Predict is automatically selected under Generate Predictions.Auto Predict uses the historical data for the intersection you defined to generate prediction data that is used for the insight. Prediction results can be used as input for generating prediction insights.
- Under Generate Insights, select Anomaly Insights.
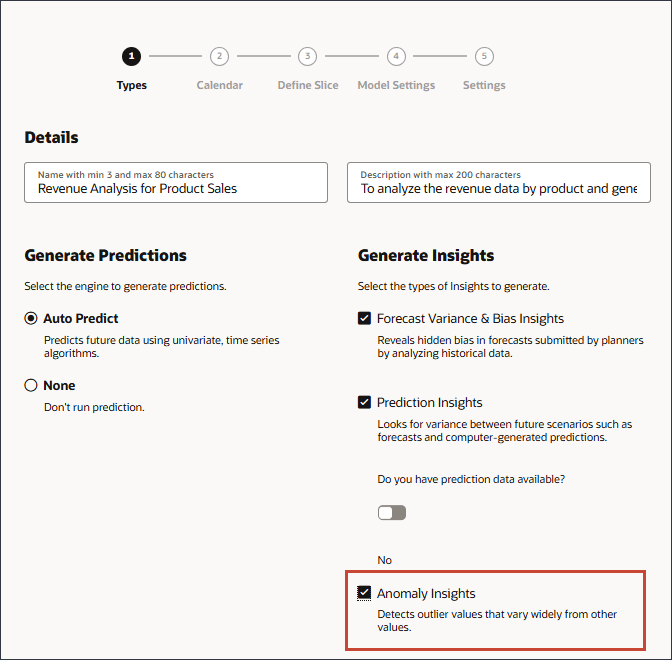
Anomaly insights detect outlier values that vary widely from other values.
- Click Next.
Selecting Historical and Future Data
In this section, you select the cube and time periods for both historical and future data.
- Click Calendar to review the available calendars you can select.
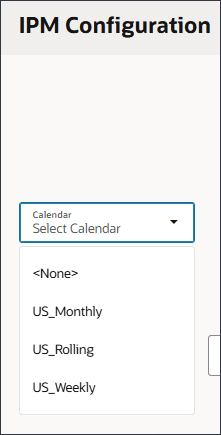
- To close the calendar, click in the white space to the right of the calendar.
No calendar is selected for this configuration.
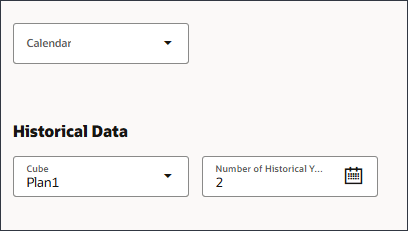
- Under Historical Data, for Cube, select Plan 1 and for Number of Historical Years, enter 2.
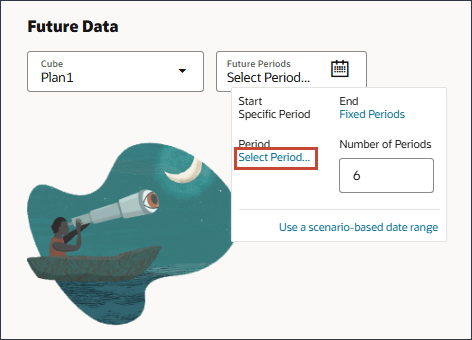
- Under Future Data, click
 (Future Period) to select Future Periods.
- Click Select Period.
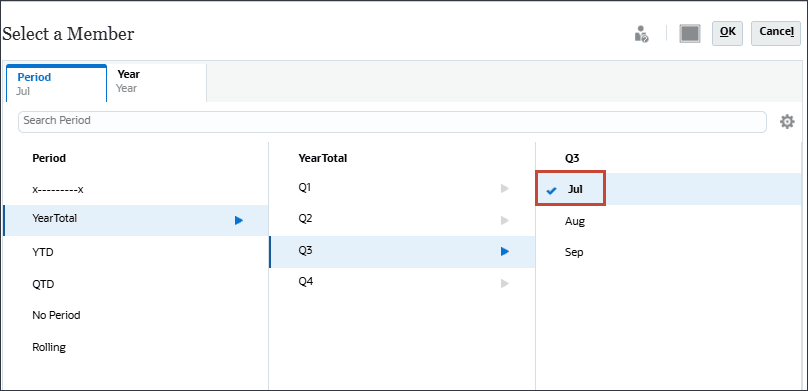
- In Member Selector, for Period, select Jul.
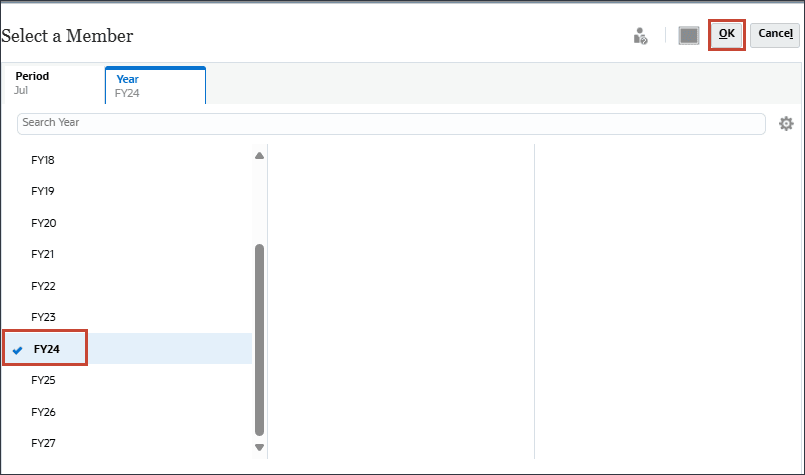
- Click Year, select FY24, and click OK.
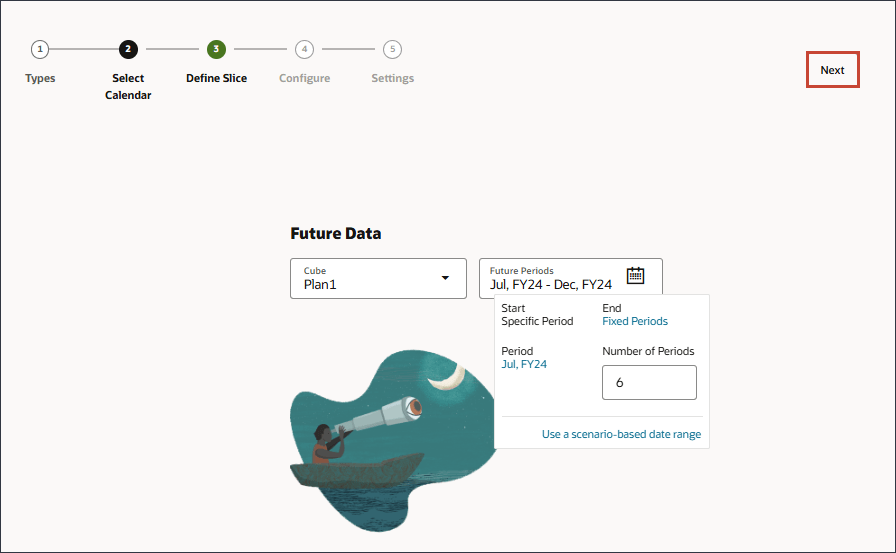
Note:
When you select Auto Predict, your prediction results are stored in this location. - Click Next.
Defining the Data Slice
You define the data slices used for insights analysis. For the Historical Data section, you define both actuals and the forecasts provided by planners. The slice definitions show all the dimensions for the cube, except for the Year and Period dimensions. All members start out with their root member selected.
For the Future Data section, you select the cube and then define the slice of data for the future data, both the forecast provided by planners and the base prediction (most likely a scenario).
- Under Actual, click Account.
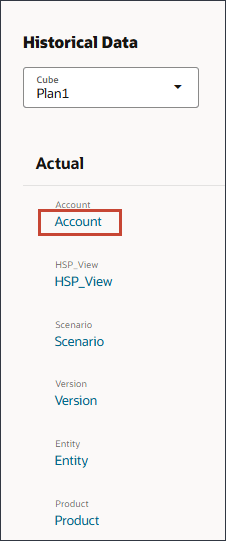
- In Member Selector, search for Electronics, and select Electronics Sales.
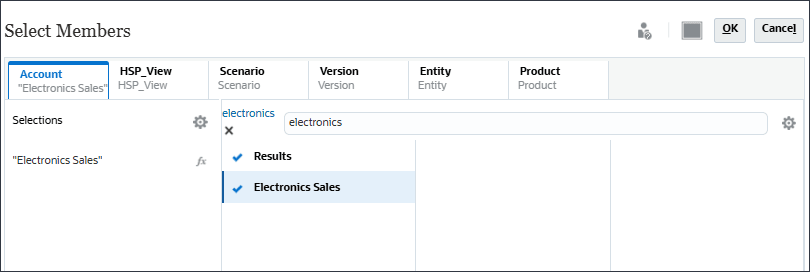
- Click HSP_View, and select BaseData.
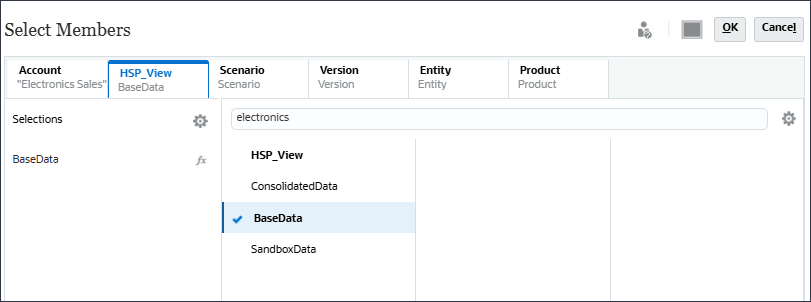
- Click Scenario, and select Actual.
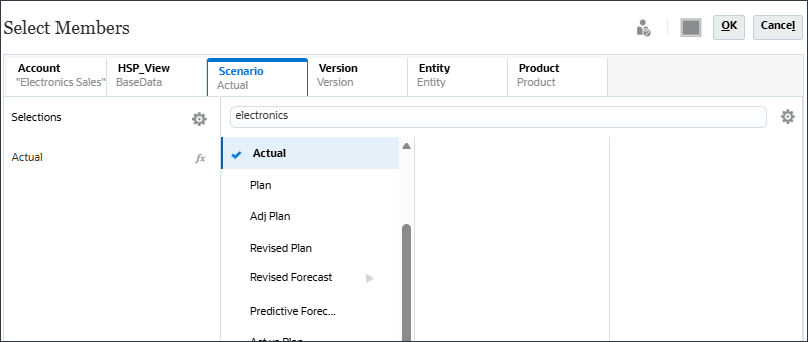
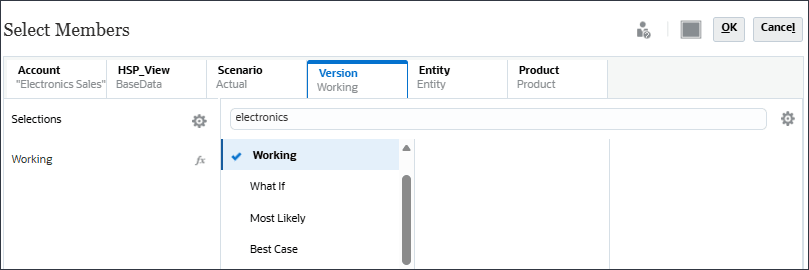
- Click Version, and select Working.
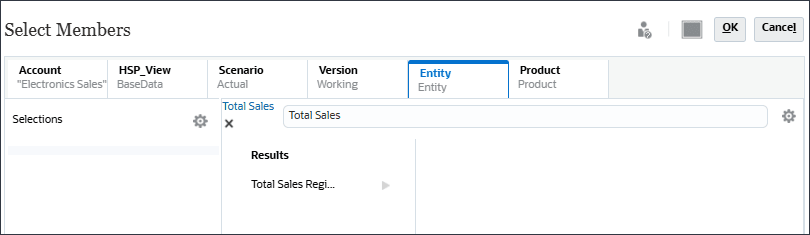
- Click Entity, then search for Total Sales.
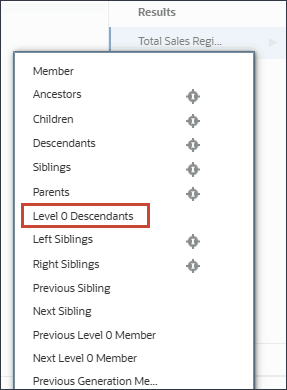
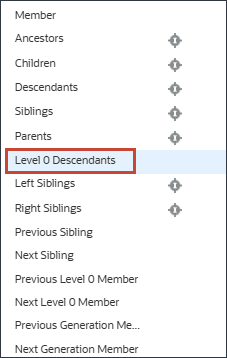
- For Total Sales Region, click
 (Function Selector), and select Level 0 Descendants.
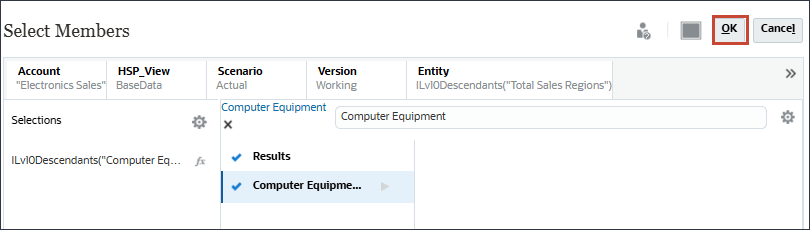
- Click Product, and search for Computer Equipment.
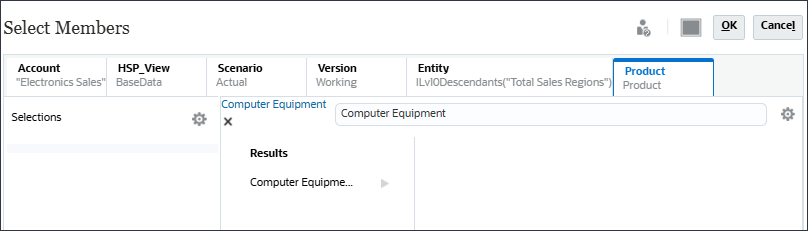
- For Computer Equipment, click (Function Selector), and select Level 0 Descendants.
- Click OK.
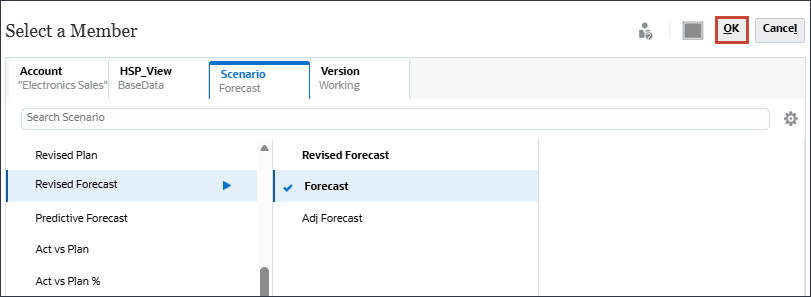
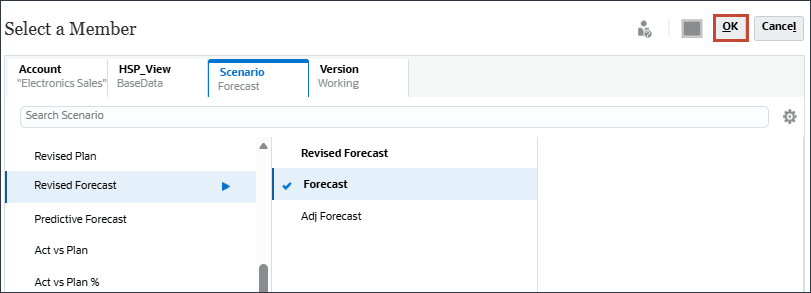
- Under Historical Data and Forecast, click the Actual scenario.

- In Member Selector, under Revised Forecast, select Forecast and click OK.
Selecting the Future Data Slice
For the Future Data section, you select the cube and then define the slice of data for the future data, both the forecast provided by planners and the base prediction (most likely a scenario).
- Under Future Data, for Forecast, click the Actual scenario.
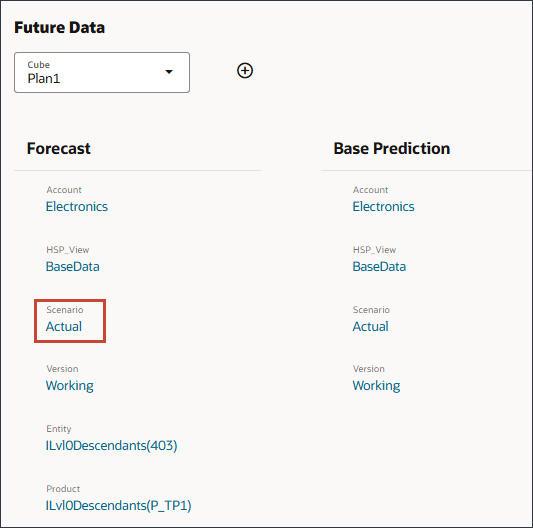
- In Member Selector, under Revised Forecast, select Forecast, and click OK.
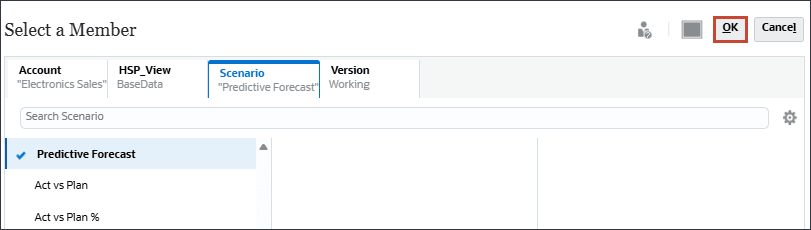
- Under Base Prediction, for Scenario, click Actual.
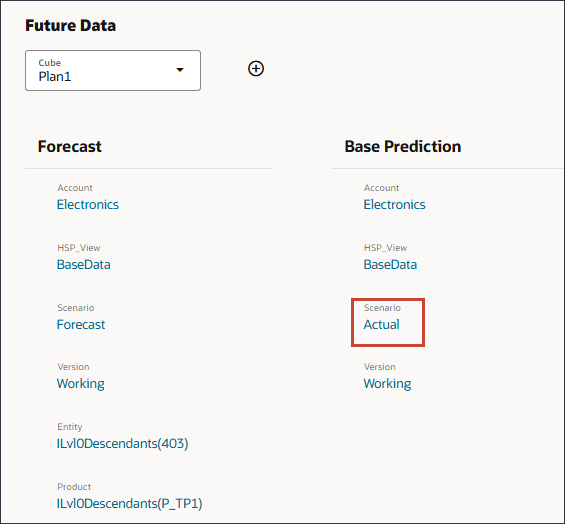
- In Member Selector, select Predictive Forecast, and click OK.
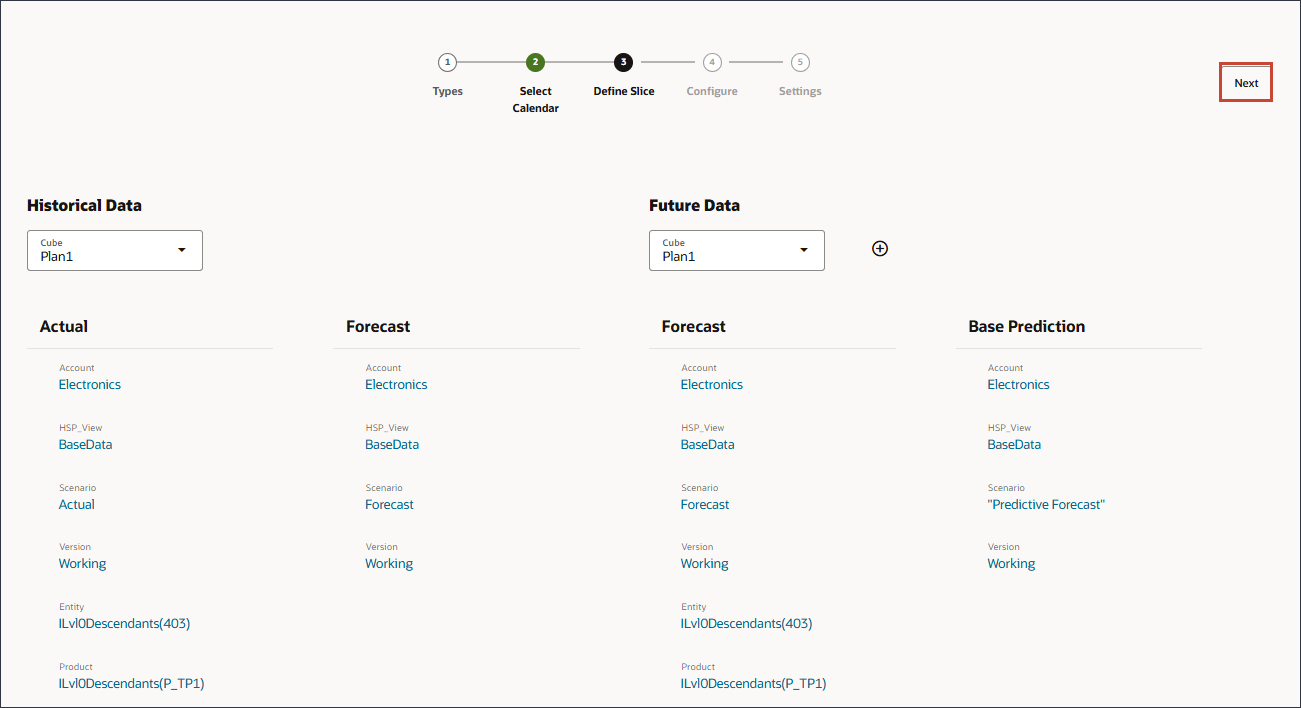
- Click Next.
Note:
If data is available, you can add a Best Case and Worst Case definition and define the slice of data for the best case and worst case scenarios.Defining Thresholds
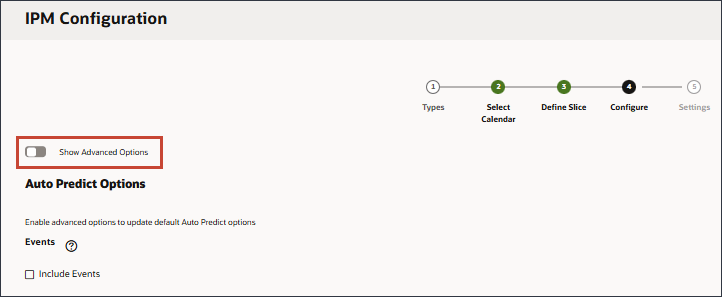
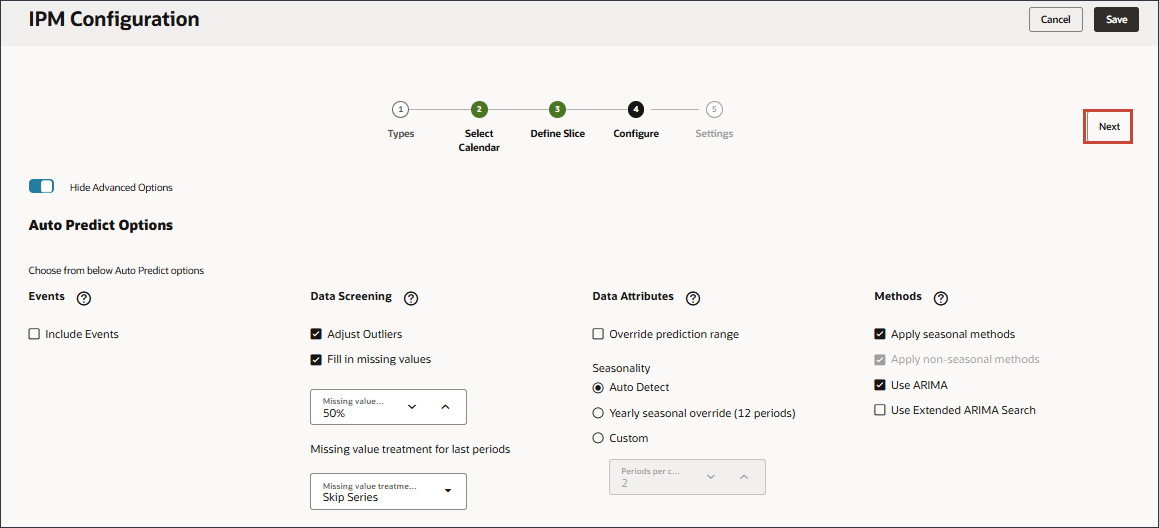
You define metrics and trigger criteria on the Advanced Options page. Forecast variance indicates the level of accuracy of the forecasts submitted by planners. Forecast bias indicates the tendency of the direction of forecast error. A tendency to forecast in excess of the actuals is considered an “over-forecasting bias,” while a tendency to forecast below the actuals is considered an “under-forecasting bias.” For prediction insights, you specify how the deviation (variance) is determined by specifying the metric and threshold to measure the variance between future forecasts and historical predictions.
You define the error tolerance and thresholds for insights. IPM Configurator selects default metrics for analysis.
- Click Show Advanced Options.
- For Forecast Variance & Bias Insights, for Variance Metric set the Threshold to 2%, for Bias Metric for Error Tolerance Limit, set the error tolerance limit to 2% and set the Threshold to 50%.
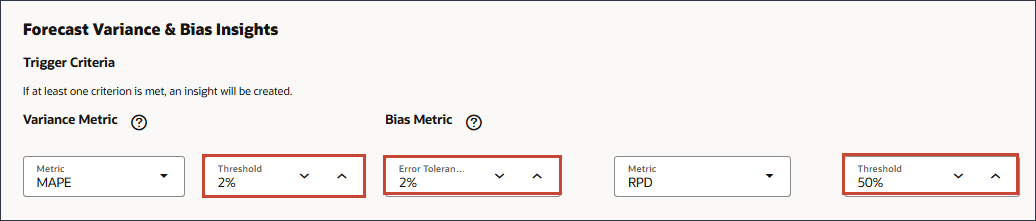
The error tolerance percentage defines the percentage variance between historical forecasts submitted by planners and actuals that lies within acceptable range. If the percentage variation crosses the error tolerance limit, it is considered for bias calculation.An insight is generated when either deviation or bias crosses the specified threshold.
- For Prediction Insights, for Variance Metric, change the threshold to 15%.
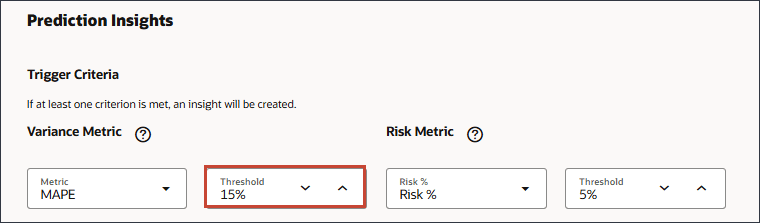
The Prediction threshold defines the acceptable percentage variance between future forecasts submitted by planners and computer-generated predictions.Select the deviation percentage between the future forecasts submitted by planners and computer-generated predictions at which to trigger an insight.
- For Anomaly Insights, accept the Threshold of 2%.
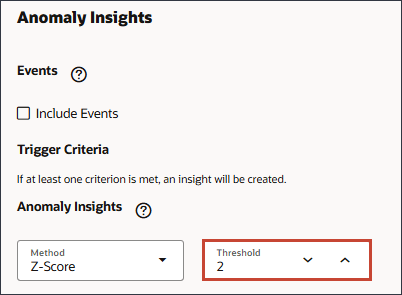
The Anomaly threshold defines the acceptable threshold for Z-score value (the standard deviation from the mean of the values). Anything that is too far from zero (the threshold is usually a Z-score of 2 or -2) should be considered an outlier. An insight is generated when the specified outlier detection metric crosses the specified threshold.The threshold for Anomaly insights sets the threshold at which to trigger an insight.
- Scroll up and click Next.
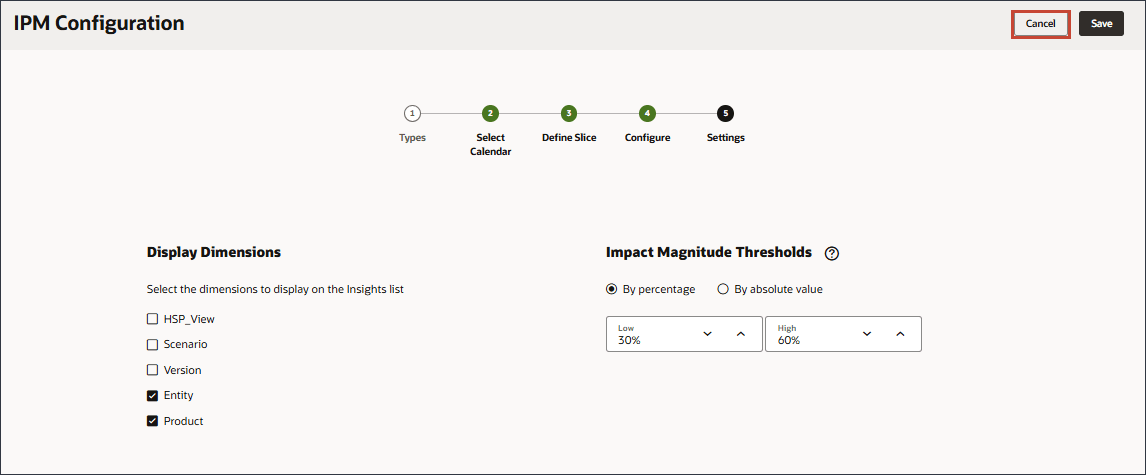
Setting Display Dimensions and Impact Magnitude Thresholds
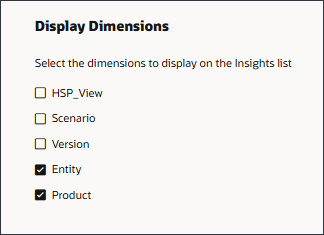
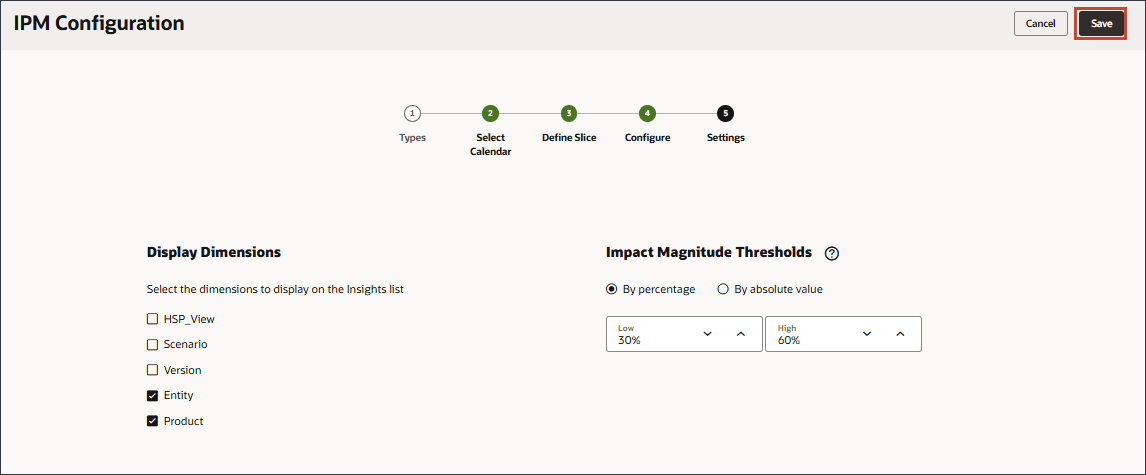
On the Settings page, you configure the settings that define how to display the insights to planners. You select the dimensions that planners will use to navigate and analyze the insights. The dimensions you select will display on the Insights dashboard. You also define the impact magnitude thresholds to categorize insights into High, Medium, and Low groups.
- Under Display Dimensions, select Entity, and Product.
- For Impact Magnitude Thresholds, change the low threshold to 30% and the High threshold to 60%.
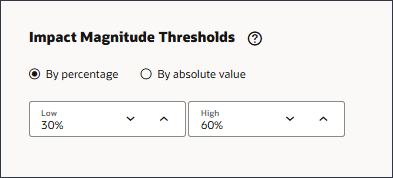
When insights are displayed on the Insights dashboard, this setting categorizes insights into High, Medium, and Low groups based on the percentage impact calculated for each insight. This helps users focus attention on the insights that have more extreme variations. - Click Save.
Note:
Insight definitions are saved as global artifacts (in the Auto Predict folder under Global Artifacts) and are backed up with the maintenance snapshot. - Click Cancel.
The Configured insight is displayed.
More Learning Resources
Explore other labs on docs.oracle.com/learn or access more free learning content on the Oracle Learning YouTube channel. Additionally, visit Oracle University to view training resources available.
For product documentation, visit Oracle Help Center.