Before you Begin
This 30 minute tutorial shows you how to import Machine Learning (ML) models into EPM Cloud. The sections build on each other and should be completed sequentially.
Background
With Bring Your Own ML, EPM administrators can import a fully trained ML model and deploy it to a Planning application. Planners can then leverage robust, ML-based forecasting that uses advanced predictive modeling techniques to generate more accurate forecasts.
Data scientists gather and prepare historical data related to a business problem, train the algorithm, and generate a PMML file (Predictive Model Markup Language, a standard language used to represent predictive models) using a third party tool. These predictive analytic models and machine learning models use statistical techniques or ML algorithms to learn patterns hidden in large volumes of historical data. Predictive analytic models use the knowledge acquired during training to predict the existence of known patterns in new data.
EPM administrators can then import and configure the fully trained ML model, which generates two Groovy rules. Administrators attach the rule to a form or dashboard, or schedule a job to generate prediction results on a regular basis. This puts the benefits of machine learning and the power of data science into the hands of business users, enhancing the planning and budgeting process and leading to better business decisions.
For example, you can predict product volume for an entity, using key drivers such as average sales price, planned spend on promotions and advertising, historical volumes, and estimated industry volumes.
You can import ML Models and use them to predict numeric values in other finance use cases, for example:
- Trade promotion impacts on sales uplifts
- Marketing mix modeling to drive better ROMI
- Internal and external driver impacts on revenue forecasts
- Predictive cash forecasting for better cash position
In this tutorial, you import an ML model into Planning.
What Do You Need?
An EPM Cloud Service instance allows you to deploy and use one of the supported business processes. To deploy another business process, you must request another EPM Enterprise Cloud Service instance or remove the current business process.
You must have:
- Service Administrator access to an EPM Enterprise Cloud Service instance.
- Upload and import this snapshot into your instance.
- Download this zip file that includes a PMML file. Extract the PMML file to a local folder.
Activating Navigation Flows
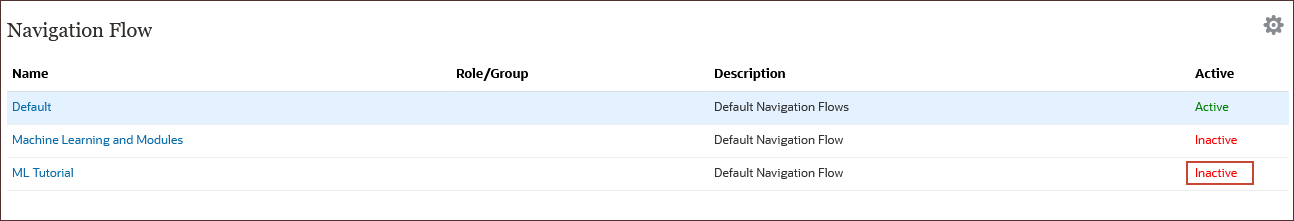
In this section, you activate the ML Tutorial navigation flow so you can work with ML Models.
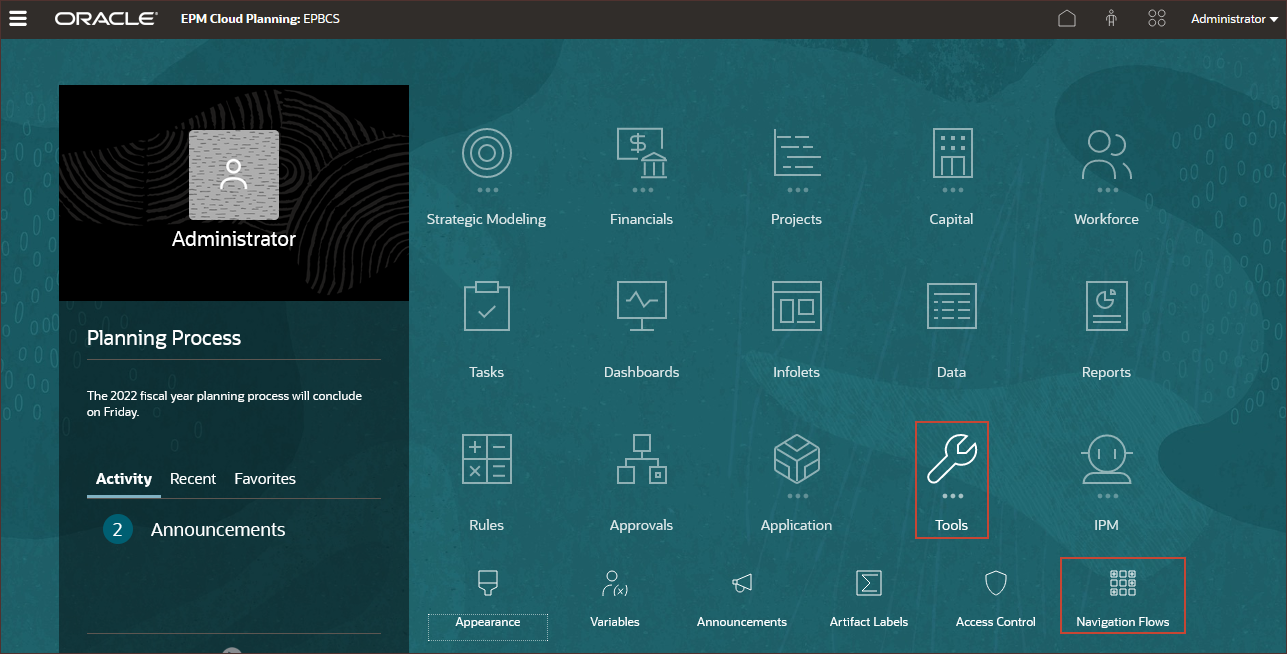
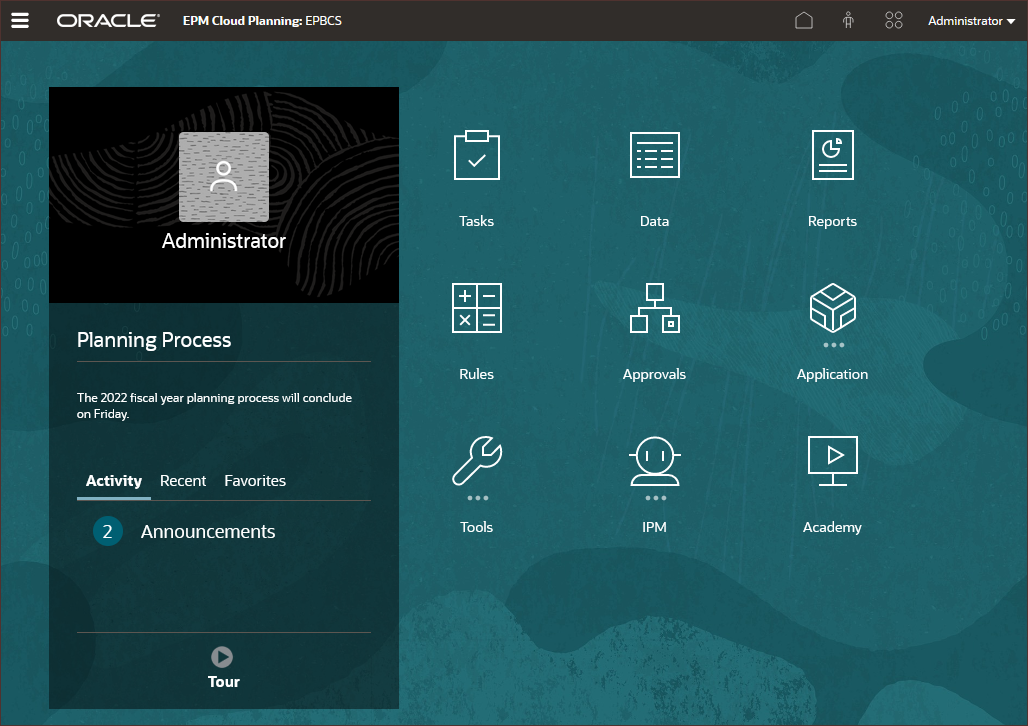
- On the home page, click Tools, then Navigation Flows.
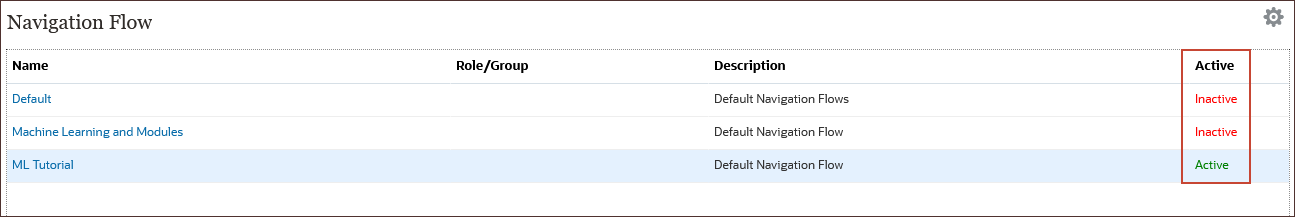
- For the ML Tutorial row, under Active, click Inactive.
The ML Tutorial navigation flow is activated, and the Default flow is inactivated.
- Click
 (Home).
 - Click
 (Navigation Flow), and click ML Tutorial.
The ML Tutorial Navigation Flow is displayed.
Assigning Values to User Variables
User Variables were added when the business process was created. User variables act as filters in forms, enabling planners to focus only on certain members. In this section, you set values for user variables.
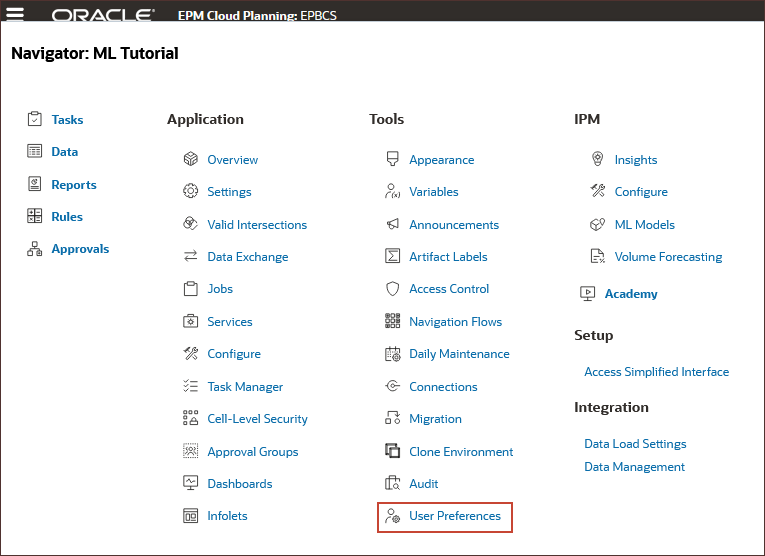
- On the home page, click
 (Navigator), and under Tools, click User Preferences.
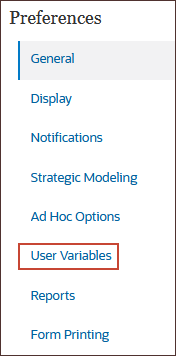
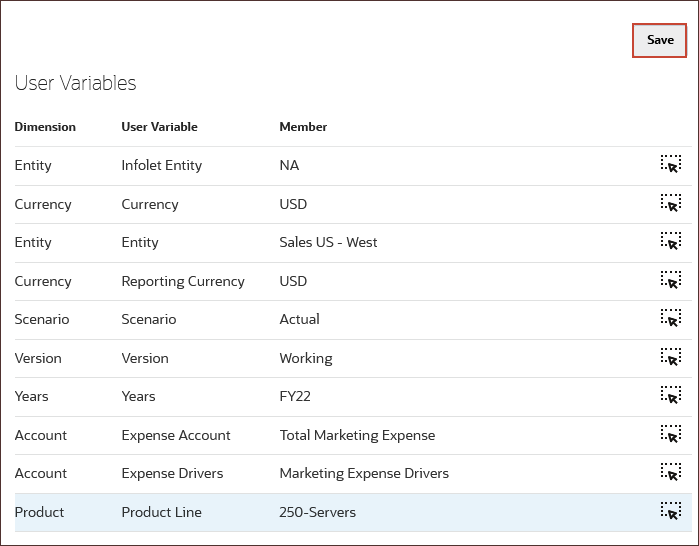
- Under Preferences, click User Variables.
- For each variable, click its
 (Member Selector) to select a member as the variable's value:
User Variable Member Infolet Entity NA Currency USD Entity Sales US - West Reporting Currency USD Scenario Actual Version Working Years FY22 Expense Account Total Marketing Expense Expense Drivers Marketing Expense Drivers Product Line 250-Servers - Verify your selections and click Save.
- At the information message, click OK.
- Return to the home page. Click (Home).
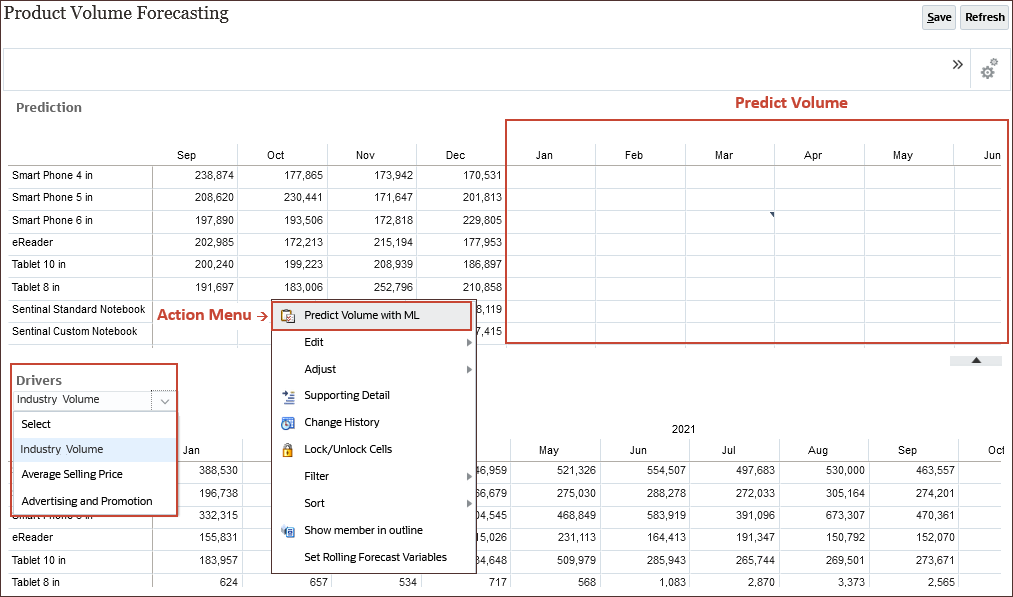
Reviewing Data for Key Drivers
In this section, you review key drivers for selling price, promotion spend, and industry volume.
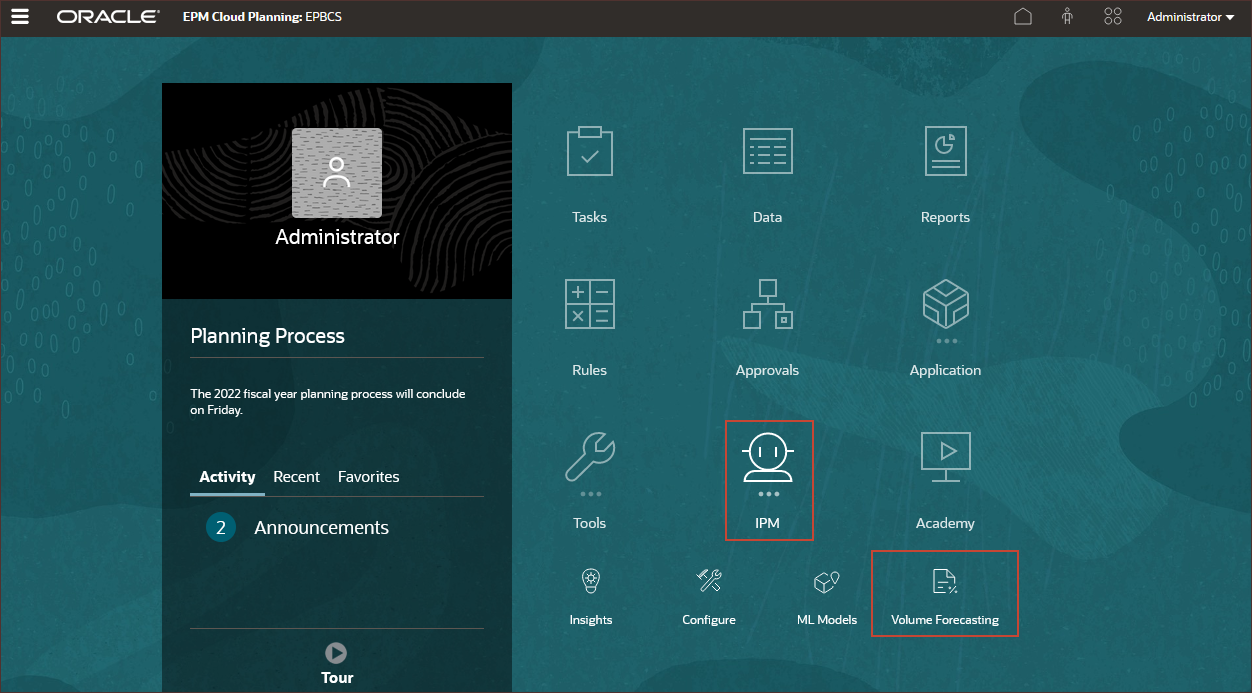
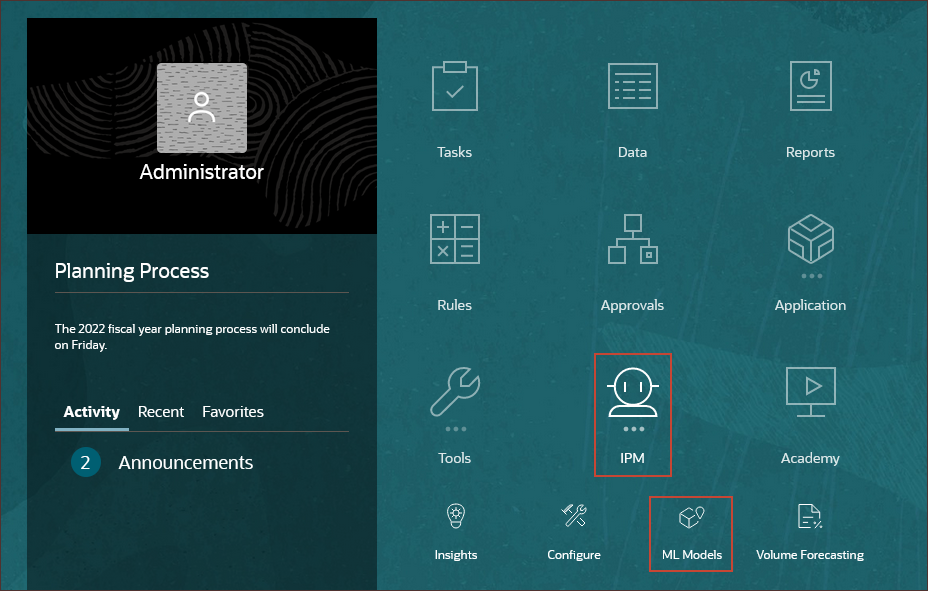
- On the home page, click IPM, and then Volume Forecasting.
- On the bottom form for Drivers, from the drop-down list, select Average Selling Price and on the right side of the form, click
 (Go).
(Go).
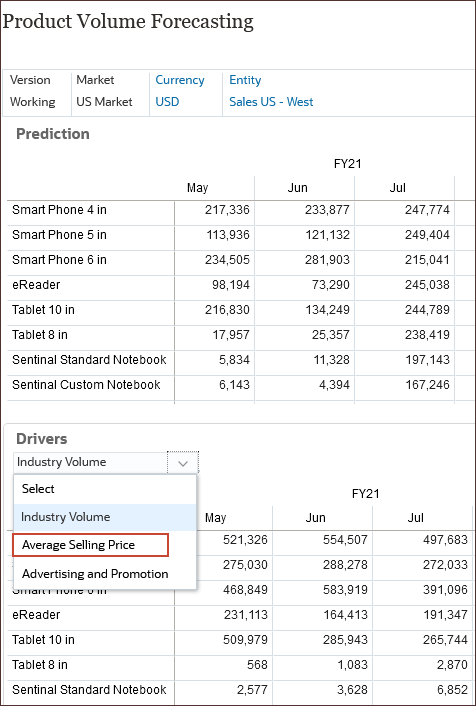
The average selling price is one of the drivers used to predict volume.
- On the bottom form for Drivers, from the drop-down list, select Advertising and Promotion and on the right side of the form, click (Go).
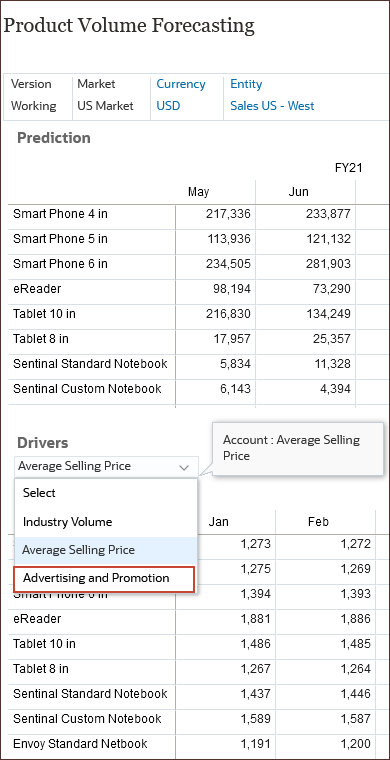
Advertising and Promotion data is used to predict volume.
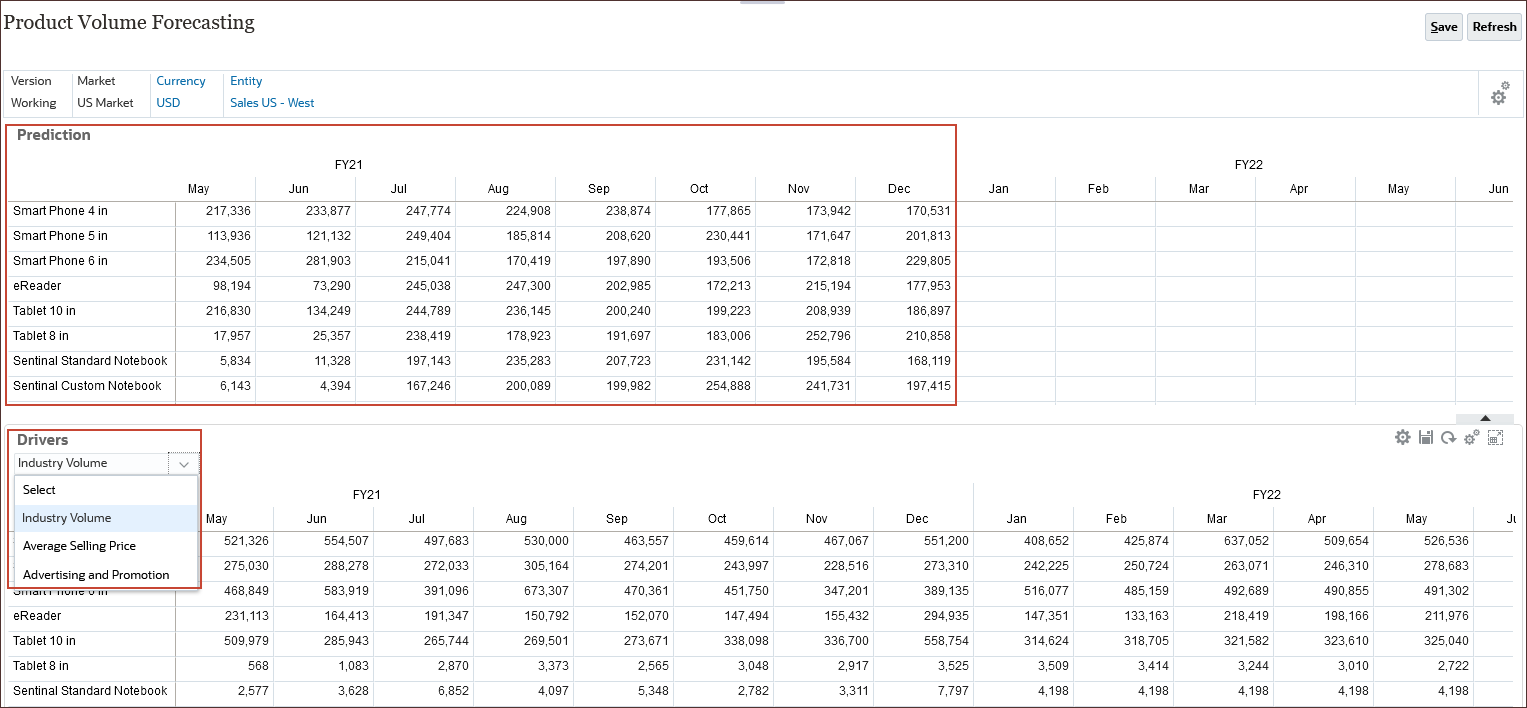
- On the bottom form for Drivers, from the drop-down list, select Industry Volume and on the right side of the form, click (Go).
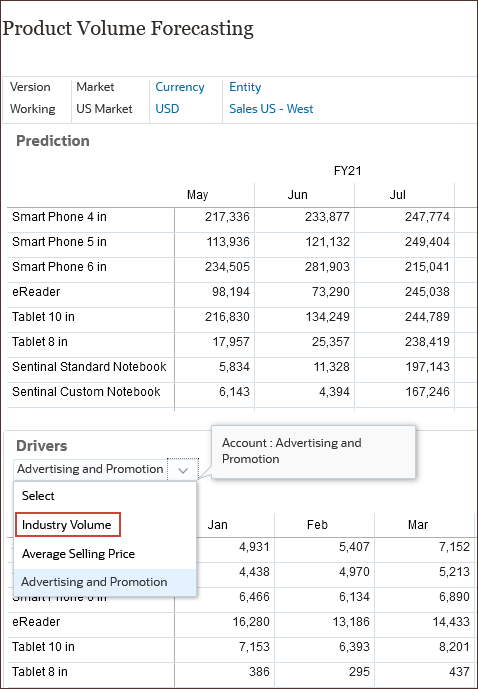
Industry Volume data is used to predict volume.
The Product Volume Forecasting page is displayed. On the top form, product predictions are displayed. This includes volume by product category for all products. On the bottom form, you can view product drivers.
Setting up the Import Model Definition
In this section you define the criteria for importing an ML Model. You import the ML model in PMML format to a Planning application and you define how the input variables and target variable maps to dimension members or cell values in the Planning application.
Selecting the PMML File
- Return to the home page. Click (Home).
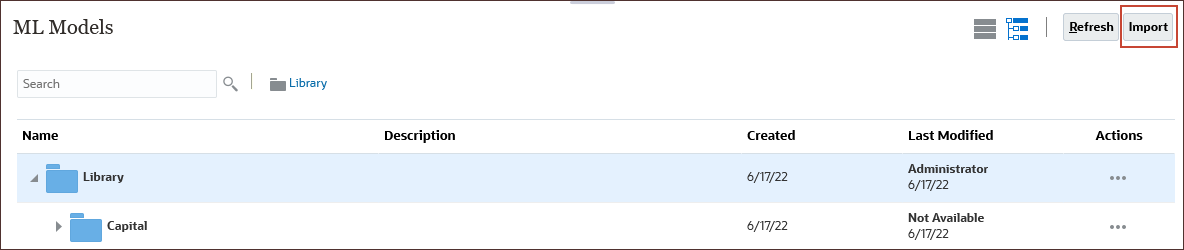
- Click IPM, and then ML Models.
- In ML Models, click Import.
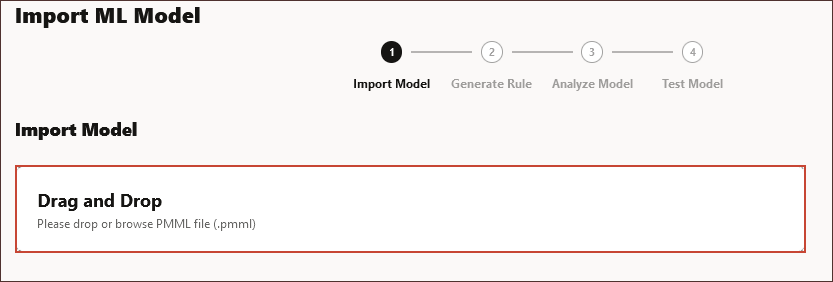
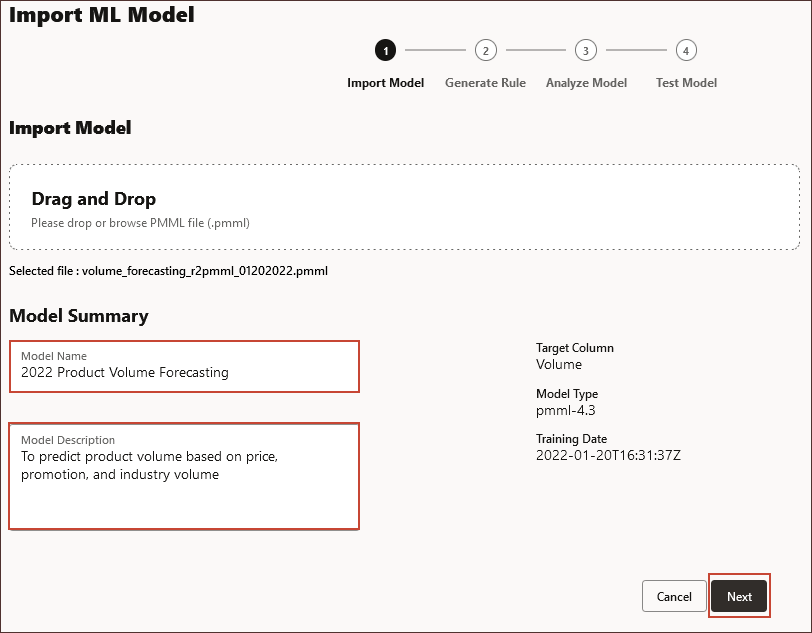
- In Import ML Model, under Import Model, click Drag and Drop to browse to your local file system.
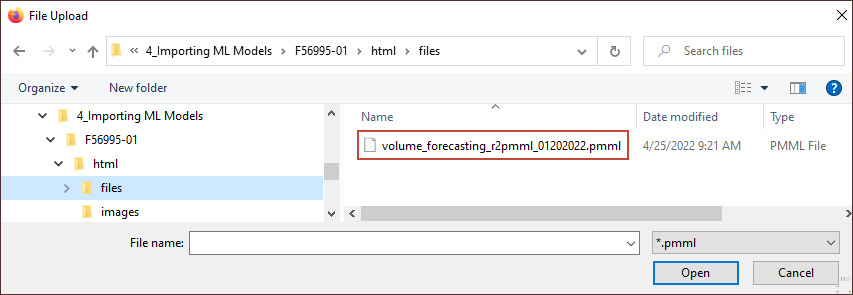
- Locate and select volume_forecasting_r2pmml_01202022.pmml, and click Open.
Information about the PMML file is displayed including the name of the target column (the variable to be predicted using the ML model), the version of PMML, and the training date (when the model was trained and the PMML file was generated.)
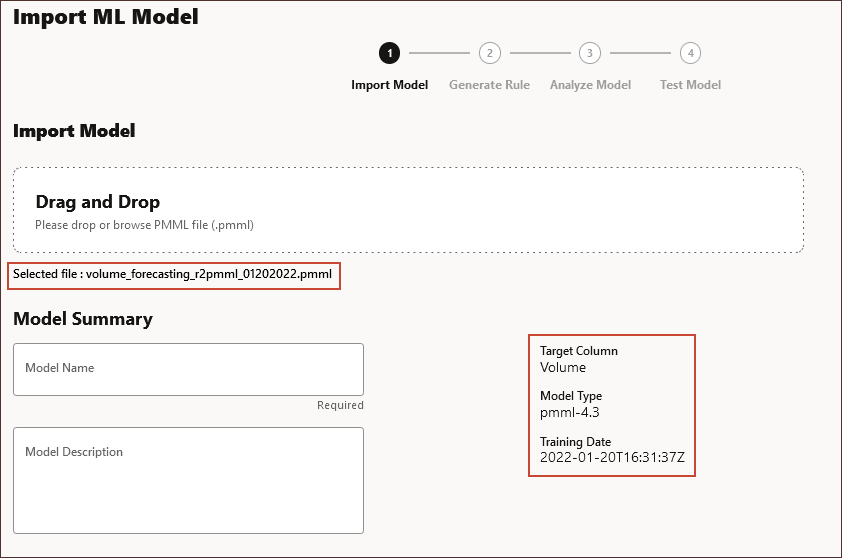
- In Model Name, enter 2022 Product Volume Forecasting, and in Model Description enter To predict product volume based on price, promotion, and industry volume, and click Next.
Defining the Cube and Scope
In this section, you select the cube where you want to use the ML model, and you define the scope for the ML model by selecting dimension members.
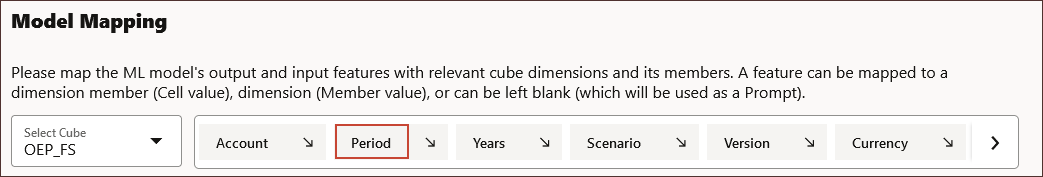
- In Model Mapping, for Select Cube, click Select Cube, and select OEP_FS.
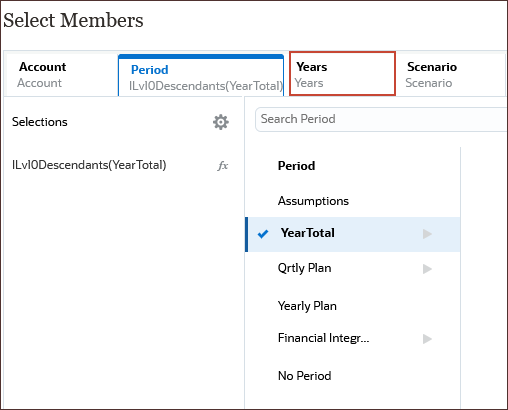
- In the slice definition under Model Mapping, click Period.
- From the list of periods, for YearTotal, click
 (Function Selector).
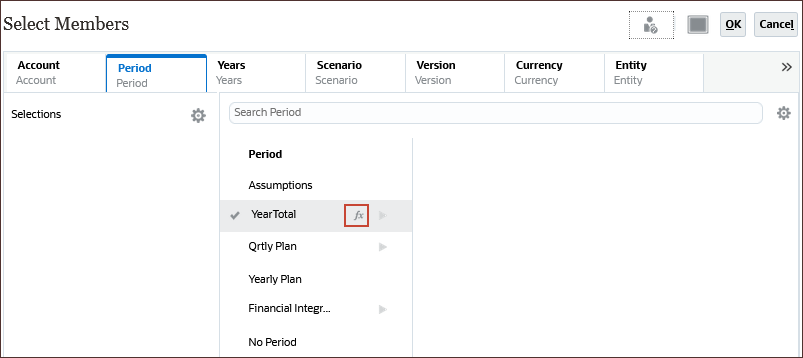
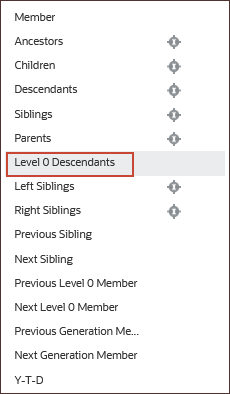
- Select Level 0 Descendants.
- Click Years.
- For All Year, click
 (All Year), and select FY22.
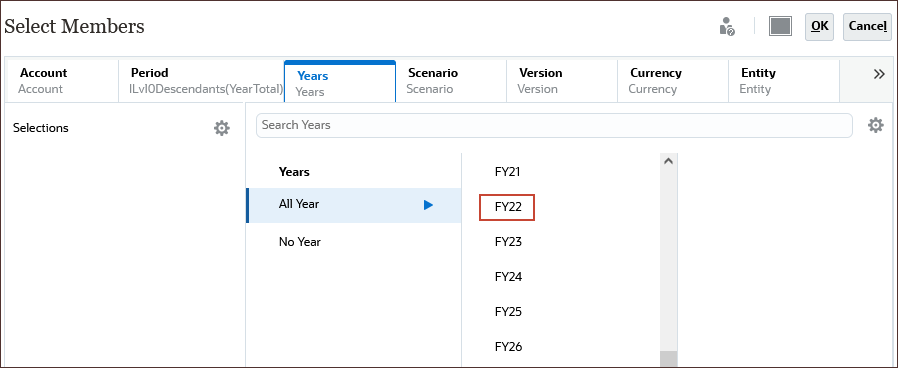
- Click Scenario.
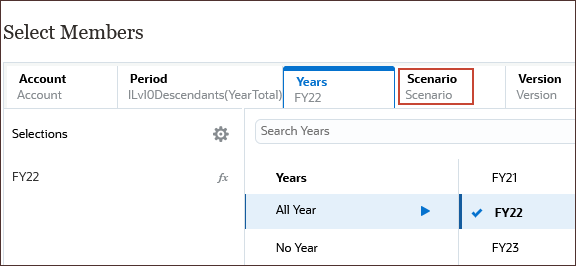
- Under OEP_Scenarios, select Actual.
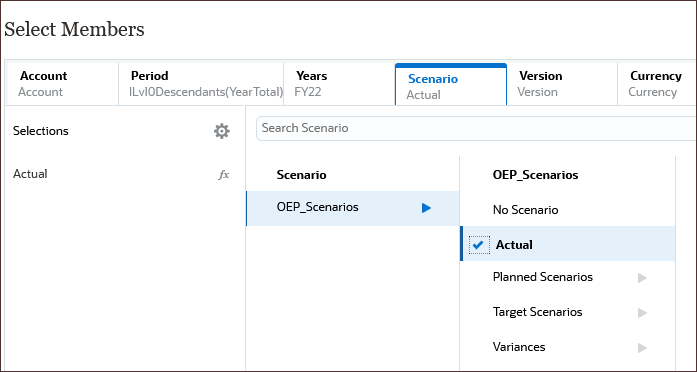
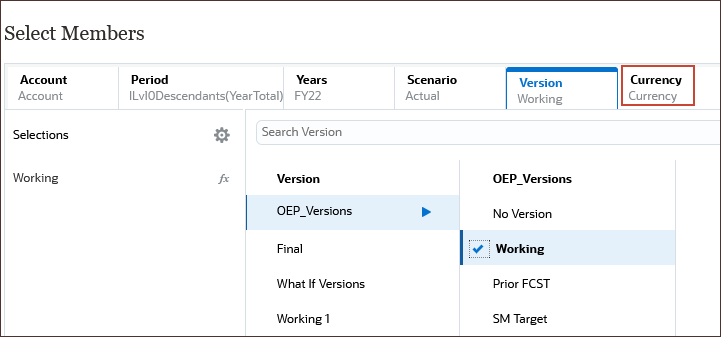
- Click Version.
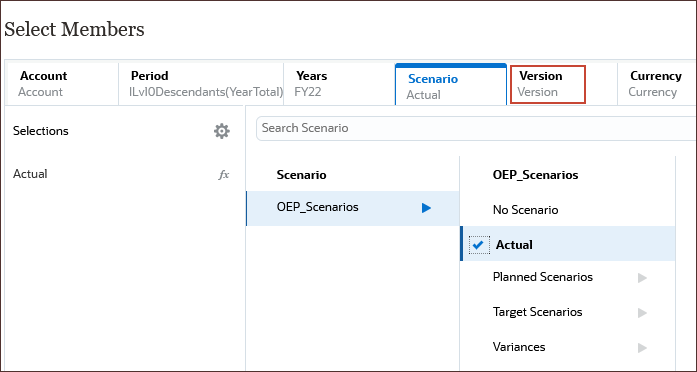
- Under OEP_Versions, select Working.
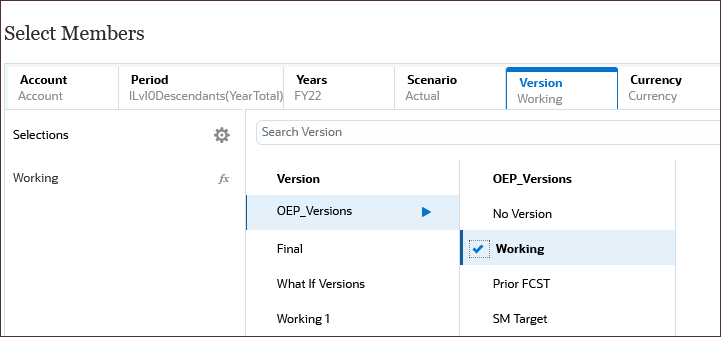
- Click Currency.
- Under Input Currencies, select USD.
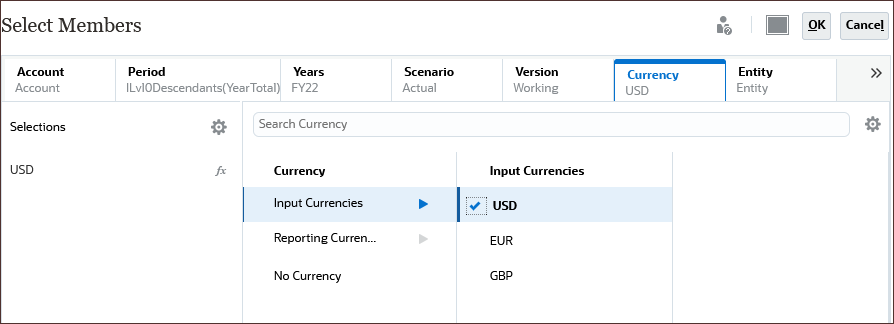
- Click Entity.
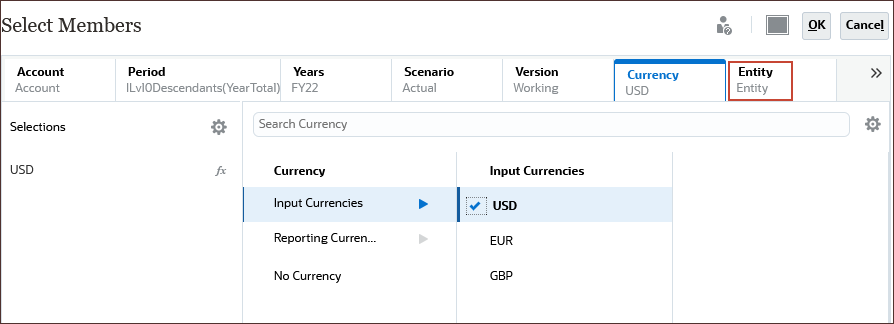
- Select Sales US - West.
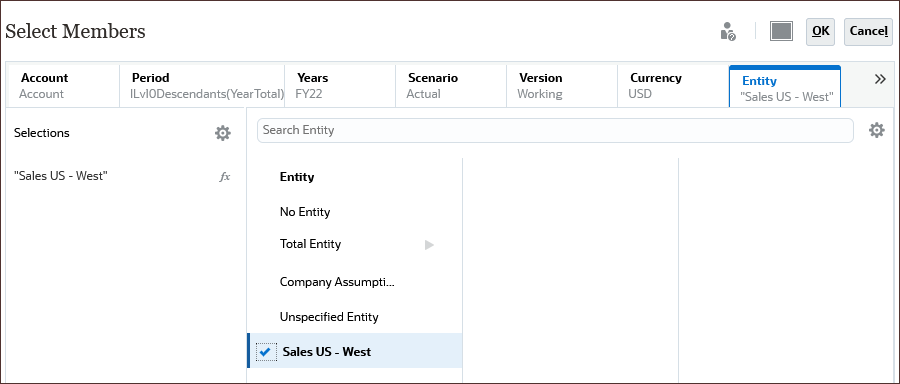
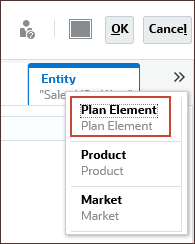
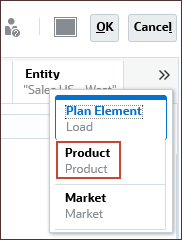
- Click
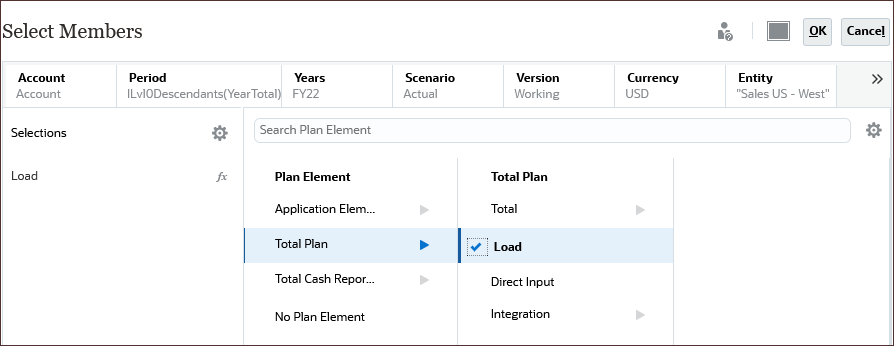
 (Scroll Right), and select Plan Element.
- Under Total Plan, select Load.
- Click (Scroll Right), and select Product.
- Under Total Product, for All Product, click (Function Selector).
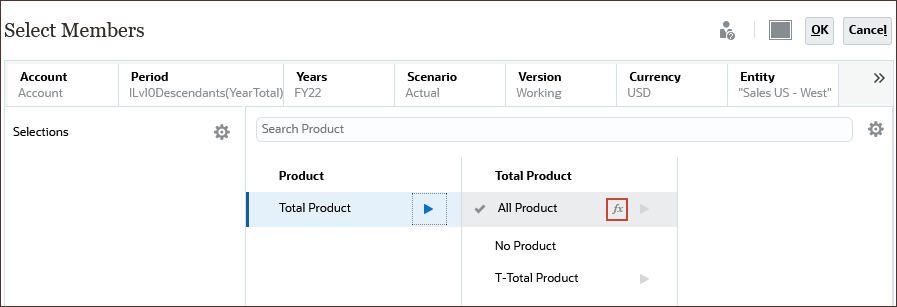
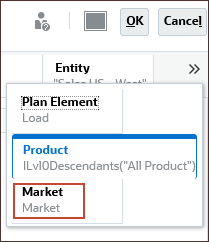
- Select Level 0 Descendants
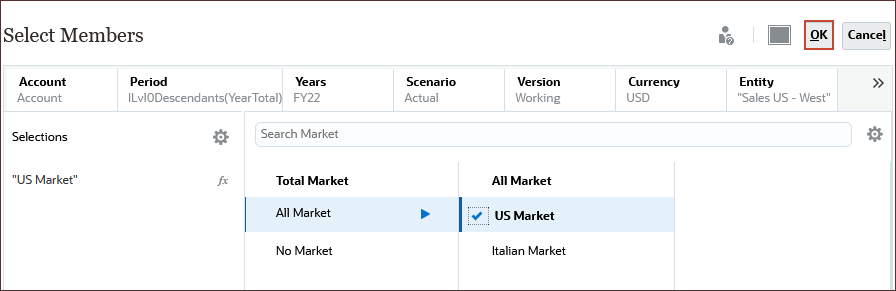
- Click (Scroll Right), and select Market.
- For Market, under Total Market, All Market, select US Market, and click OK.
Defining Inputs and the Output
In this section, you select inputs which are similar to drivers and you select the output to define the target measure you want to predict and where to paste the predicted values in the Planning application.
You map Input and Output to the appropriate Planning dimensions and members in the cube. The Input and Output sections contain the list of input features (features/columns that are used to make predictions) and target feature (column that is expected to be predicted). Planning analyzes the PMML file to generate the list of inputs and outputs.
Input features are independent variables, similar to drivers, that act as input to your system. When you make predictions, the model uses input features to predict your output. In this step, you map the input from the ML model to the output in the Planning cube. Input describes how to extract the data from the ML model. Output defines the target measure you want to predict and where to paste the predicted values in the Planning application.
In this example, product, price, and industry volume, the input features, are used to predict volume, the output.
In the Input area, for each input feature, select an Input Type and if you select Cell Value or Member, select the members or dimensions in the Planning application to map to.
Input types:
- Prompt: If you don't have a member or dimension in Planning that maps to this input value from the ML model, when the prediction is made, prompt the user to enter an estimate for the value.
- Cell Value: Map an input feature to one or more dimension members in the Planning cube. For example, the input feature called Price maps to an account member called Price in the Planning application.
- Member: Map an input feature to a dimension in the Planning cube. For example, the Input feature called Product maps to the Product dimension in the Planning application.
In the Output area, select an Input Type and if you select Cell Value or Member, select the members or dimensions in the Planning application to map to to store prediction results.
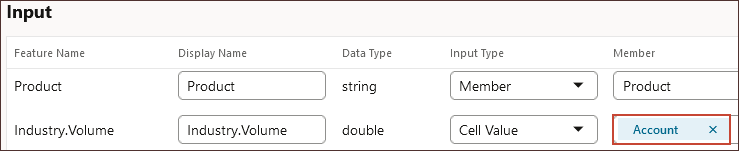
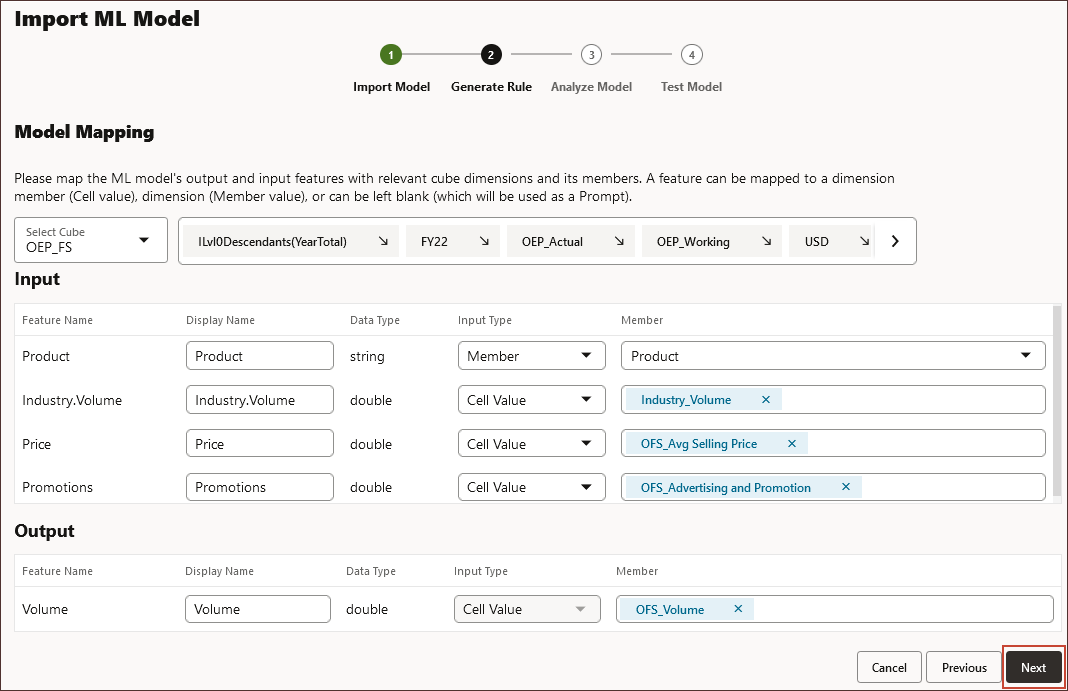
- Under Input, in the Product row, for Input Type, select Member, and for Member, select Product.
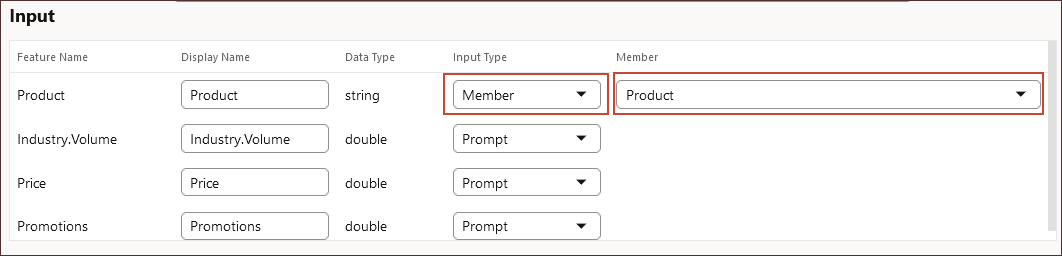
Note:
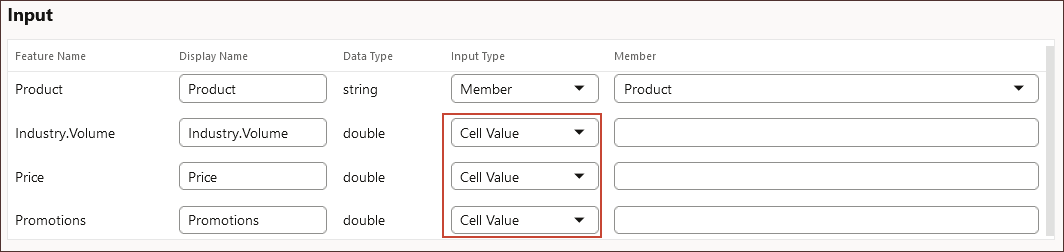
If the data input contains a string or text value, then the Input Type is defined as Member. - Under Input, select Cell Value for the following input features:
- Industry.Volume
- Price
- Promotions
- In the ML Model Scope, click the arrow to the right of Account.
Tip:
You need to scroll all the way to the left to see Account.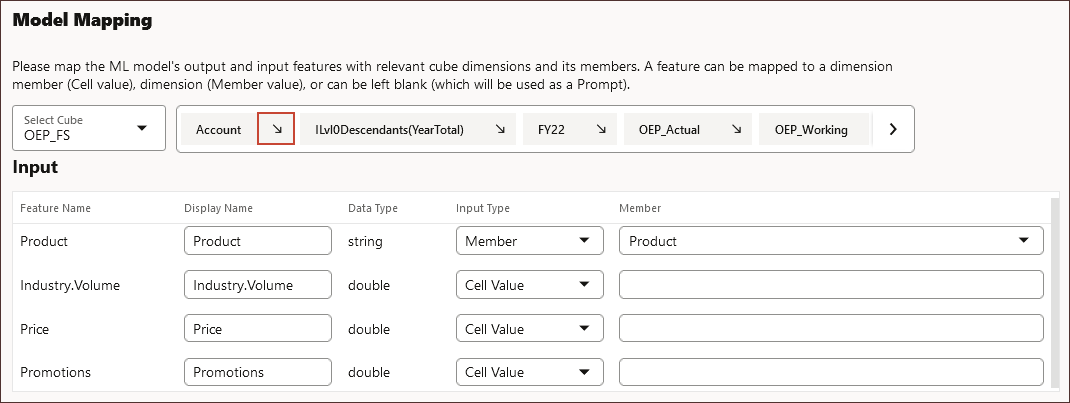
All features with the Input Type of "Cell Value" are mapped to accounts including the target output.
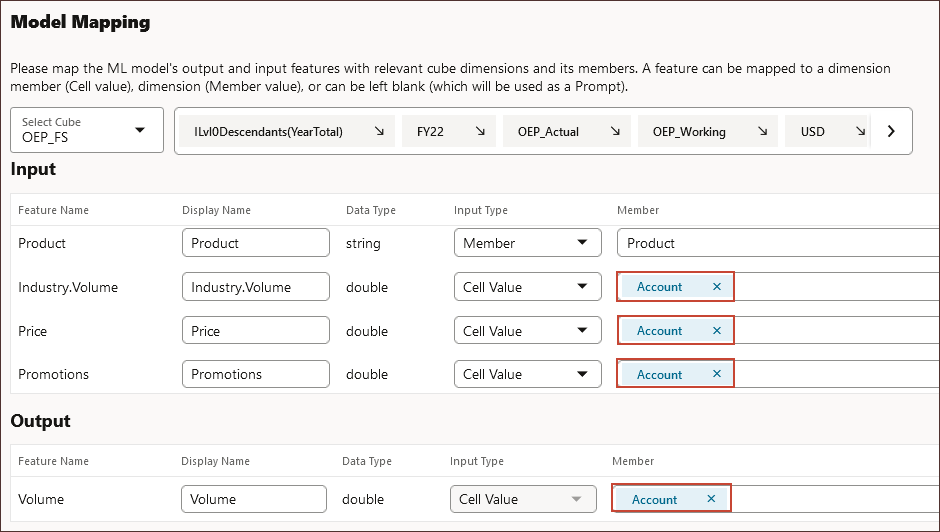
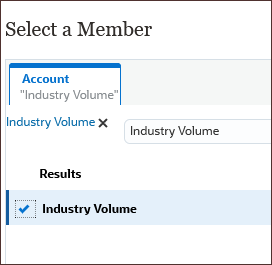
- To select a specific account, for Industry.Volume, click Account.
- Search for and select Industry Volume and click OK.
- To select a specific account, for Price, click Account.
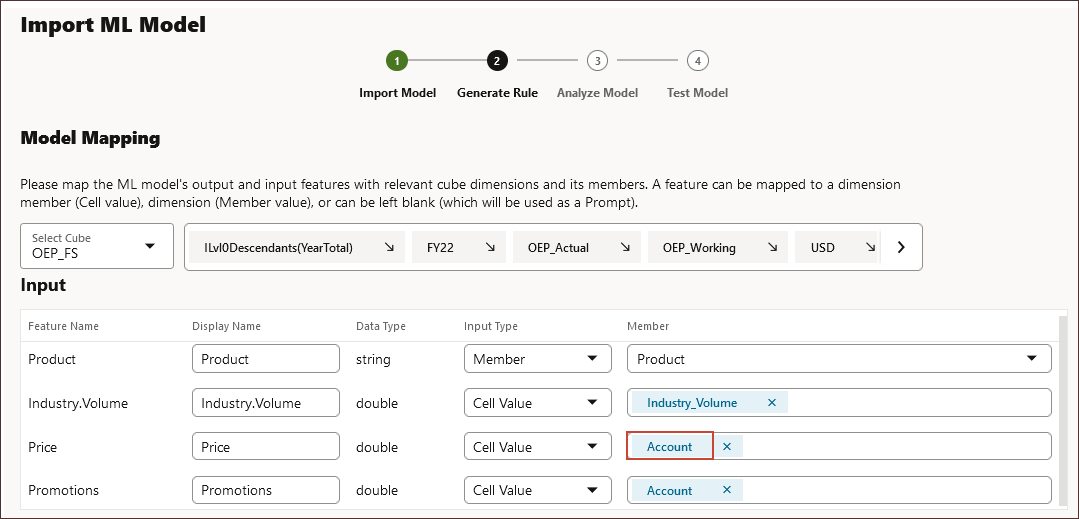
- Search for and select Average Selling Price, and click OK.

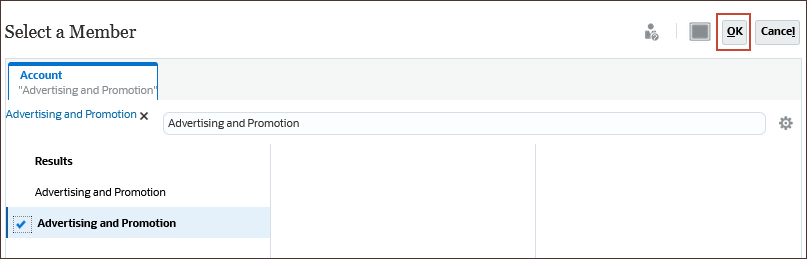
- To select a specific account, for Promotions, click Account.
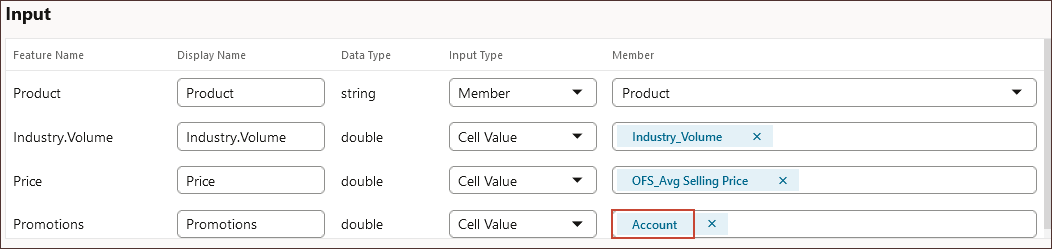
- Search for and select Advertising and Promotion, and click OK.
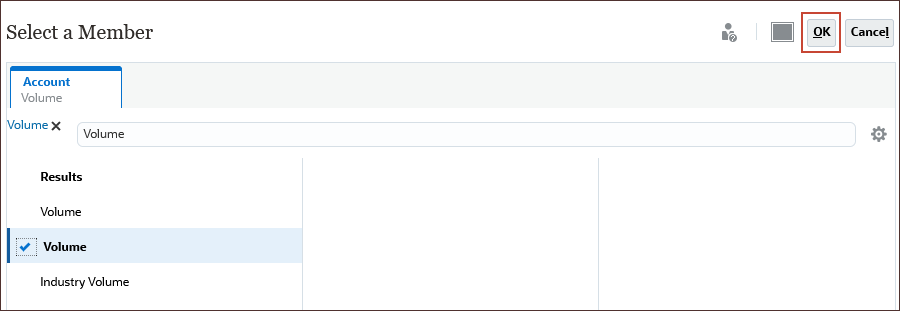
- In Output, for Volume, to select a specific account for the target output, click Account.
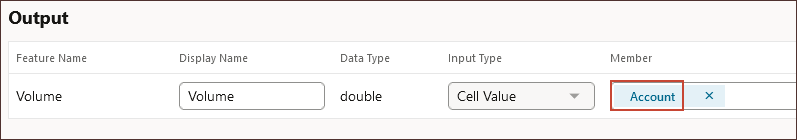
- Search for and select Volume, and click OK.
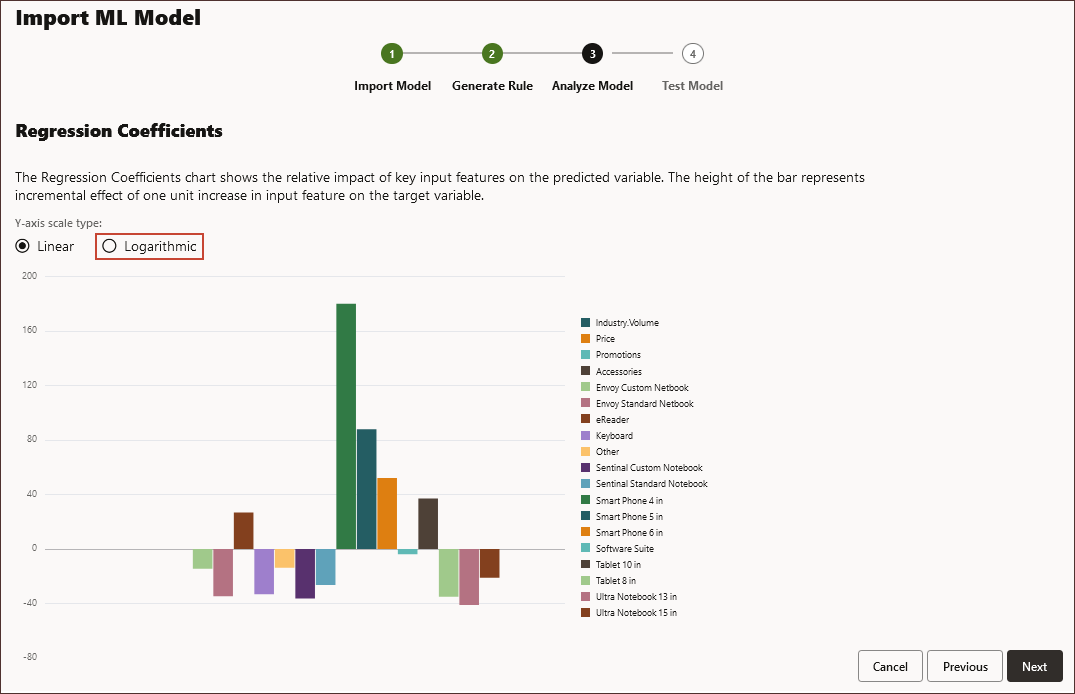
- Click Next.
The Regression Coefficients page is displayed. The Analyze Model step represents MLX (Machine Learning Explainability), and extracts additional information about the ML model. For example, review Regression Coefficients to see how the relative impact of key input features is used to predict the output. The height of the bar represents the incremental effect of one unit increase in an input feature on the target variable.

- Click Logarithmic.
- Click Next.
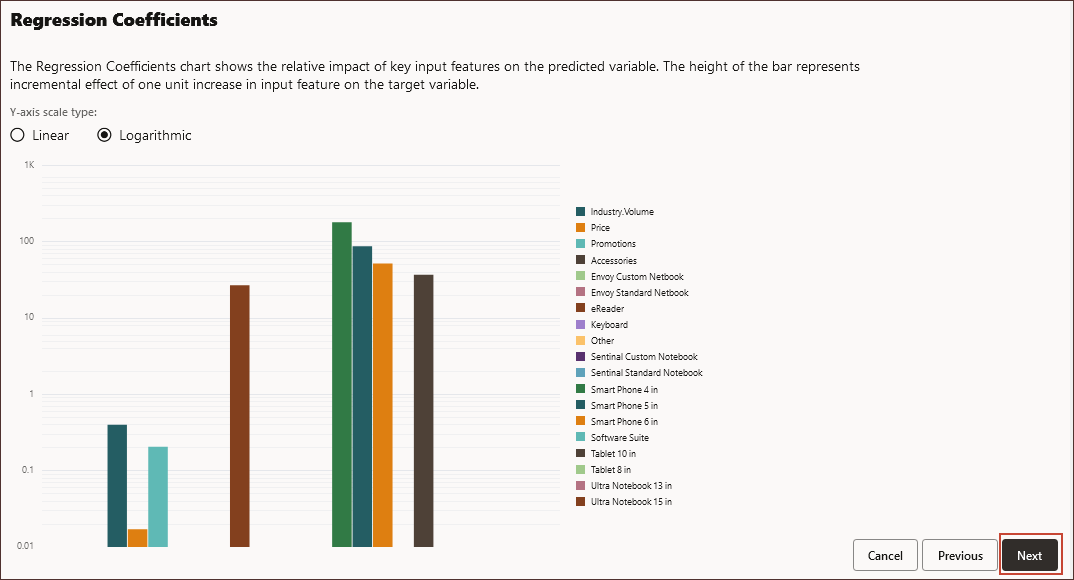
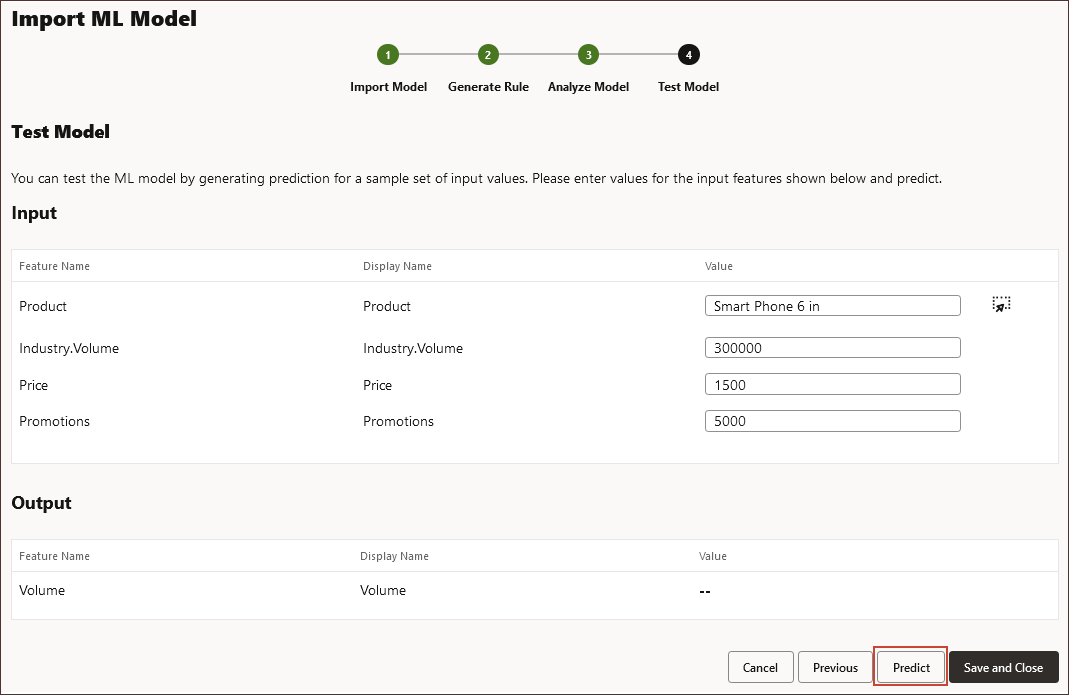
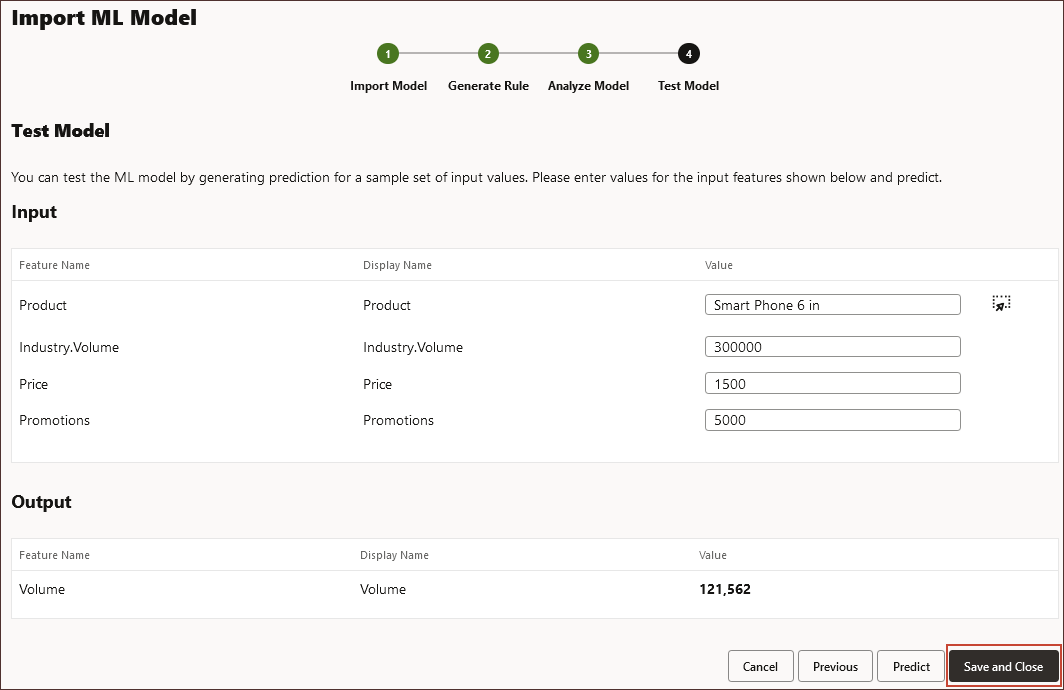
The Test Model step is displayed.
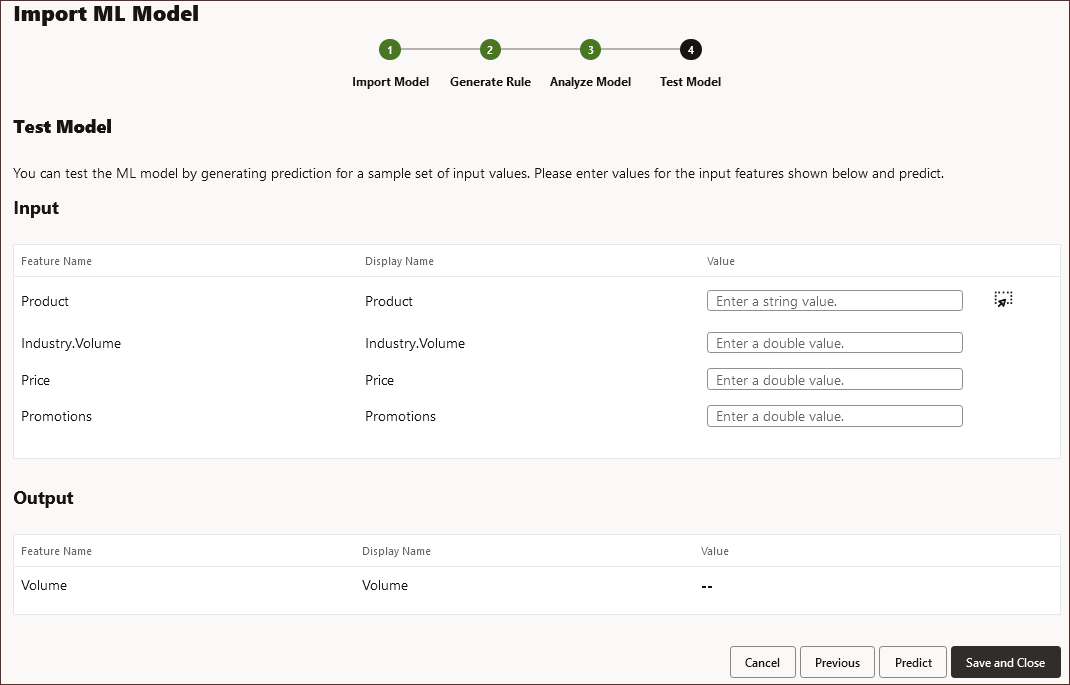
Testing the Model
In this section, you test the model by generating a prediction for a set of sample values. For each Input, you enter a sample input value and use those values to predict the output.
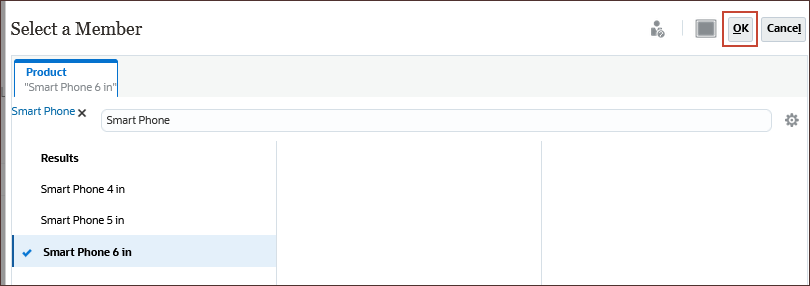
- Under Input for Product click
 (Select Member) to select a string value.
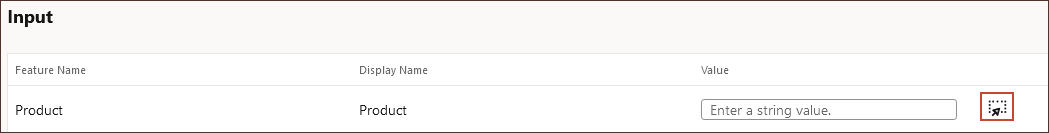
- Search for Smart Phone, select Smart Phone 6 in, and click OK.
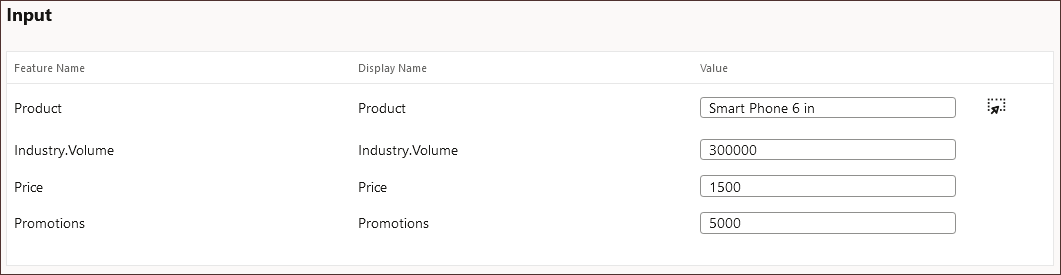
- For Input, enter the following values:
- For Industry.Volume, enter 300000.
- For Price, enter 1500.
- For Promotions, enter 5000
- Click Predict.
The predicted volume is displayed in the output.
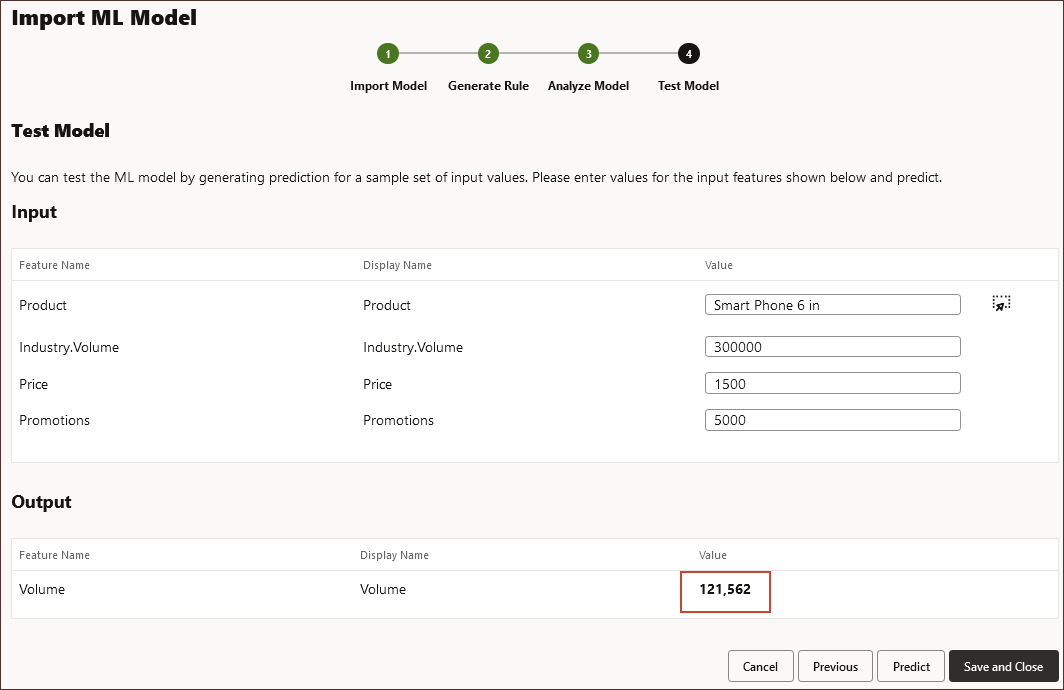
- Click Save and Close.
The Confirmation message is displayed. Two Groovy rules are generated for each ML model definition: one that can be included on a form or dashboard, which allows users to make predictions on demand, and another rule that can be used to generate large scale predictions in a scheduled job for bulk processing.
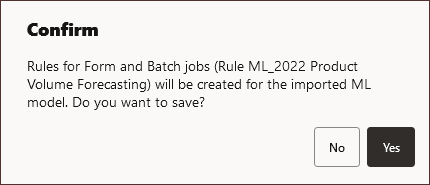
- At the confirmation message, click Yes.
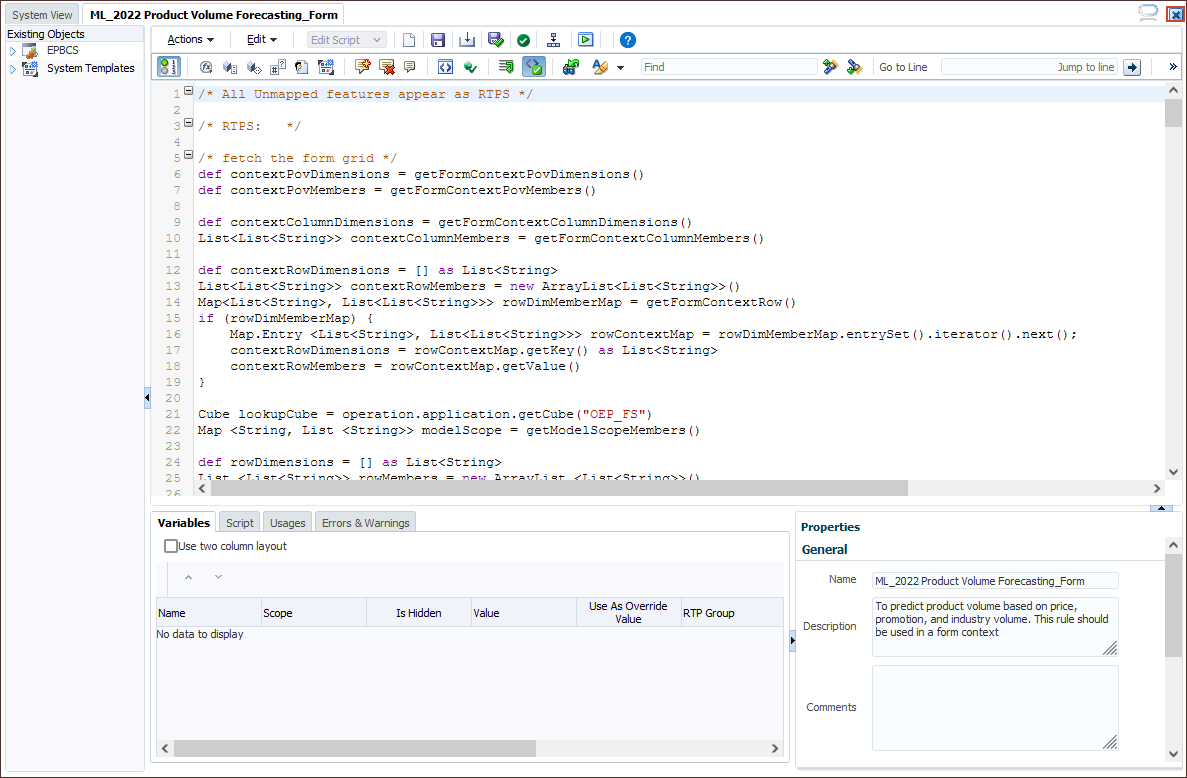
You can review the generated rules in Calculation Manager. The Groovy rules define the name and location of the PMML file, along with input and output based on the mapping you defined.
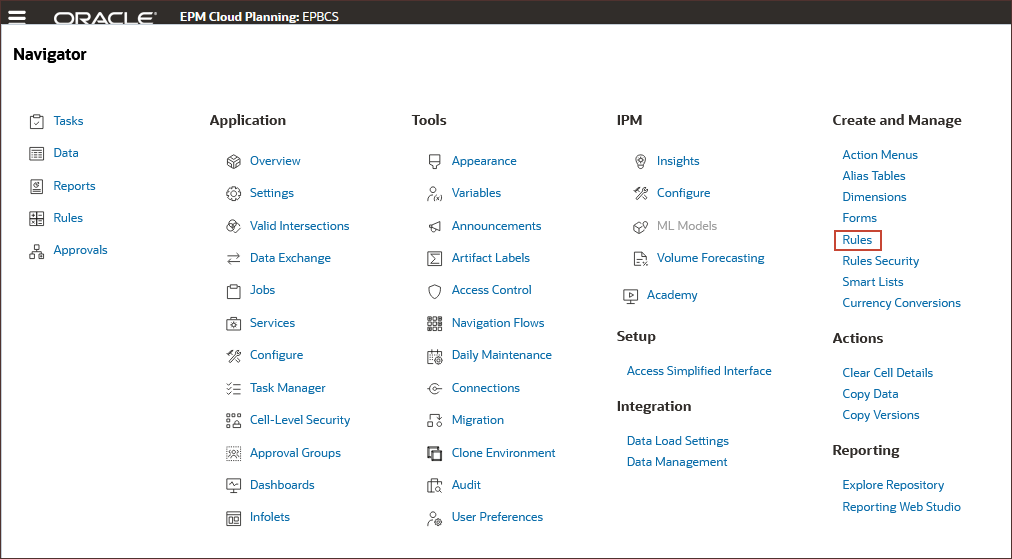
Reviewing Groovy Rules in Calculation Manager
- Click Navigator) and under Create and Manage, click Rules.
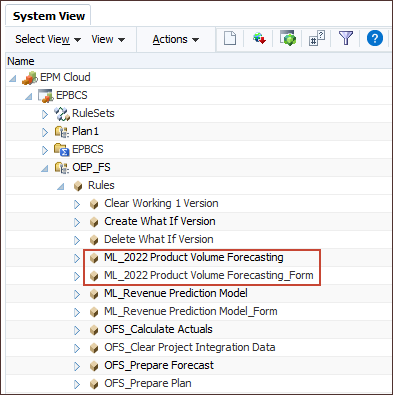
- Expand EPM Cloud, EPBCS, OEP_FS, and Rules.
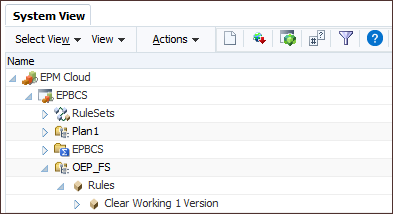
- In the list of rules, locate the Groovy rules you just created.
ML_2022 Product Volume Forecasting is a Groovy rule that you can use to run batch jobs. ML_2022 Product Volume Forecasting_Form is a Groovy rule that you can include in an action menu on a form or dashboard for Planners to run the rule.
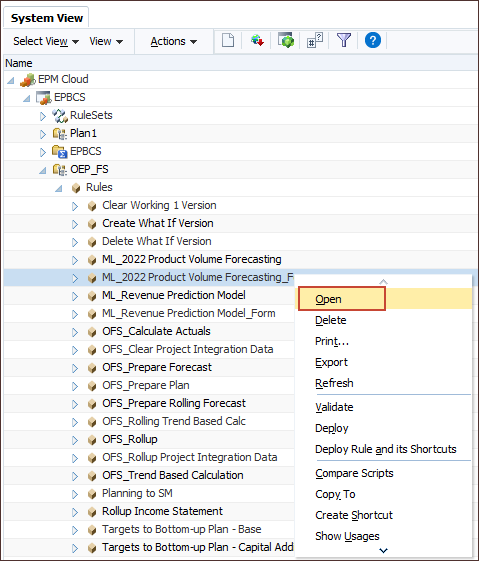
- Right click the form rule - ML_2022 Product Volume Forecasting_Form, and select Open.
- Review the rule, then in the upper right click X to close the tab.
- In the upper right, click X to close the Calculation Manager window, and at the confirmation message, click Leave page.
Learn More
Importing ML Models
F56995-01
June 2022
Copyright © 2022, Oracle and/or its affiliates.
This tutorial shows you how to import a fully trained ML model into EPM Cloud.
This software and related documentation are provided under a license agreement containing restrictions on use and disclosure and are protected by intellectual property laws. Except as expressly permitted in your license agreement or allowed by law, you may not use, copy, reproduce, translate, broadcast, modify, license, transmit, distribute, exhibit, perform, publish, or display any part, in any form, or by any means. Reverse engineering, disassembly, or decompilation of this software, unless required by law for interoperability, is prohibited.
If this is software or related documentation that is delivered to the U.S. Government or anyone licensing it on behalf of the U.S. Government, then the following notice is applicable:
U.S. GOVERNMENT END USERS: Oracle programs (including any operating system, integrated software, any programs embedded, installed or activated on delivered hardware, and modifications of such programs) and Oracle computer documentation or other Oracle data delivered to or accessed by U.S. Government end users are "commercial computer software" or "commercial computer software documentation" pursuant to the applicable Federal Acquisition Regulation and agency-specific supplemental regulations. As such, the use, reproduction, duplication, release, display, disclosure, modification, preparation of derivative works, and/or adaptation of i) Oracle programs (including any operating system, integrated software, any programs embedded, installed or activated on delivered hardware, and modifications of such programs), ii) Oracle computer documentation and/or iii) other Oracle data, is subject to the rights and limitations specified in the license contained in the applicable contract. The terms governing the U.S. Government's use of Oracle cloud services are defined by the applicable contract for such services. No other rights are granted to the U.S. Government.
This software or hardware is developed for general use in a variety of information management applications. It is not developed or intended for use in any inherently dangerous applications, including applications that may create a risk of personal injury. If you use this software or hardware in dangerous applications, then you shall be responsible to take all appropriate fail-safe, backup, redundancy, and other measures to ensure its safe use. Oracle Corporation and its affiliates disclaim any liability for any damages caused by use of this software or hardware in dangerous applications.
Oracle and Java are registered trademarks of Oracle and/or its affiliates. Other names may be trademarks of their respective owners.
Intel and Intel Inside are trademarks or registered trademarks of Intel Corporation. All SPARC trademarks are used under license and are trademarks or registered trademarks of SPARC International, Inc. AMD, Epyc, and the AMD logo are trademarks or registered trademarks of Advanced Micro Devices. UNIX is a registered trademark of The Open Group.
This software or hardware and documentation may provide access to or information about content, products, and services from third parties. Oracle Corporation and its affiliates are not responsible for and expressly disclaim all warranties of any kind with respect to third-party content, products, and services unless otherwise set forth in an applicable agreement between you and Oracle. Oracle Corporation and its affiliates will not be responsible for any loss, costs, or damages incurred due to your access to or use of third-party content, products, or services, except as set forth in an applicable agreement between you and Oracle.