Introduction
This tutorial shows you how to run and schedule insights. Before stepping through this tutorial, please review the Configuring Insights hands-on tutorial to familiarize yourself with the configuration steps. This tutorial begins where the Configuring Insights tutorial ends. Consequently, the snapshot provided in this tutorial already has the insight configured that you will be running so you do not need to configure it.
The sections build on each other and should be completed sequentially.
Background
Insights automate data analysis by finding patterns in data so you don’t have to. As new data is loaded into your EPM Cloud system, the Insight engine processes the data for key signals such as variance, trends, anomalies, and forecast bias. Instead of spending hours manually looking for patterns in your data, Insights does it for you. Insights surfaces just the patterns that are most relevant. You can configure the insights for materiality and importance.
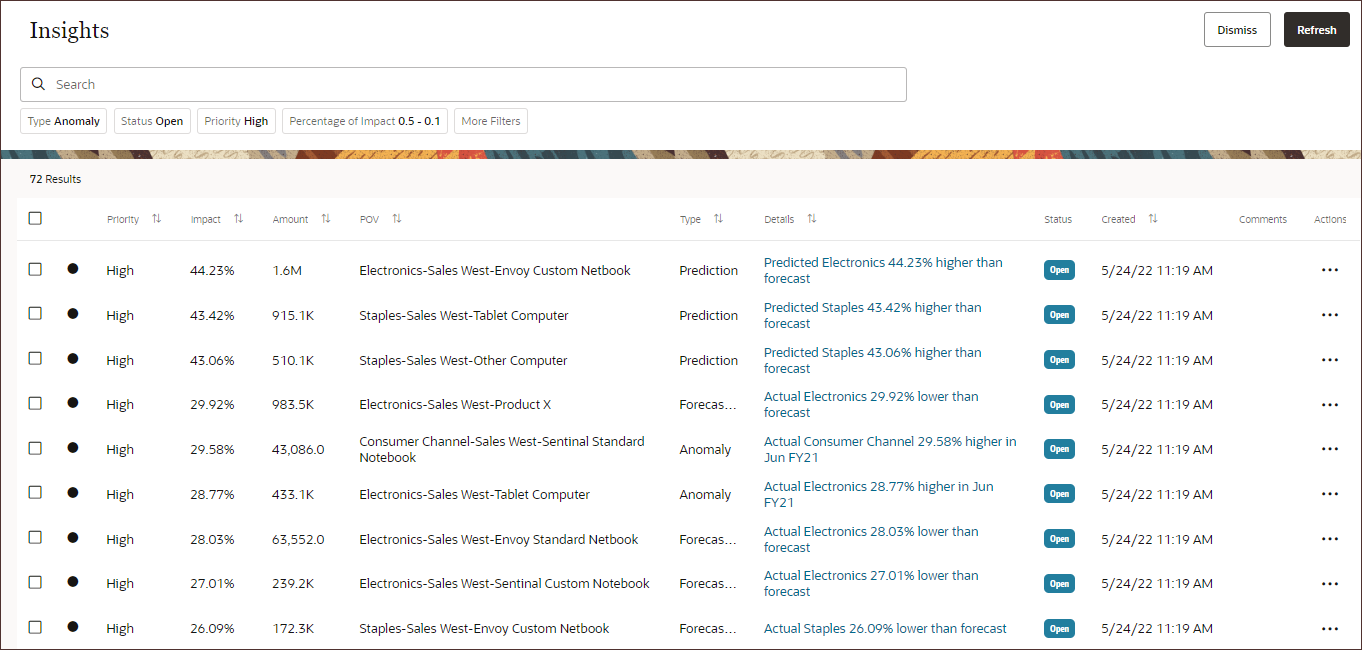
The insights are delivered in an easy-to-use display. The list of insights are easily sorted and filtered. For example, you can easily filter on specific patterns within a threshold with just a few clicks. By delivering insights faster, it helps Finance get to more value-added activity – such as engaging with the business to solve problems.
After consulting with business experts, administrators configure insights to define the insights that planners see on the Insights display. Configured Insights can then be run immediately or scheduled to run on a regular basis.
Insights use both historical and predicted data. There are three different types of insights:
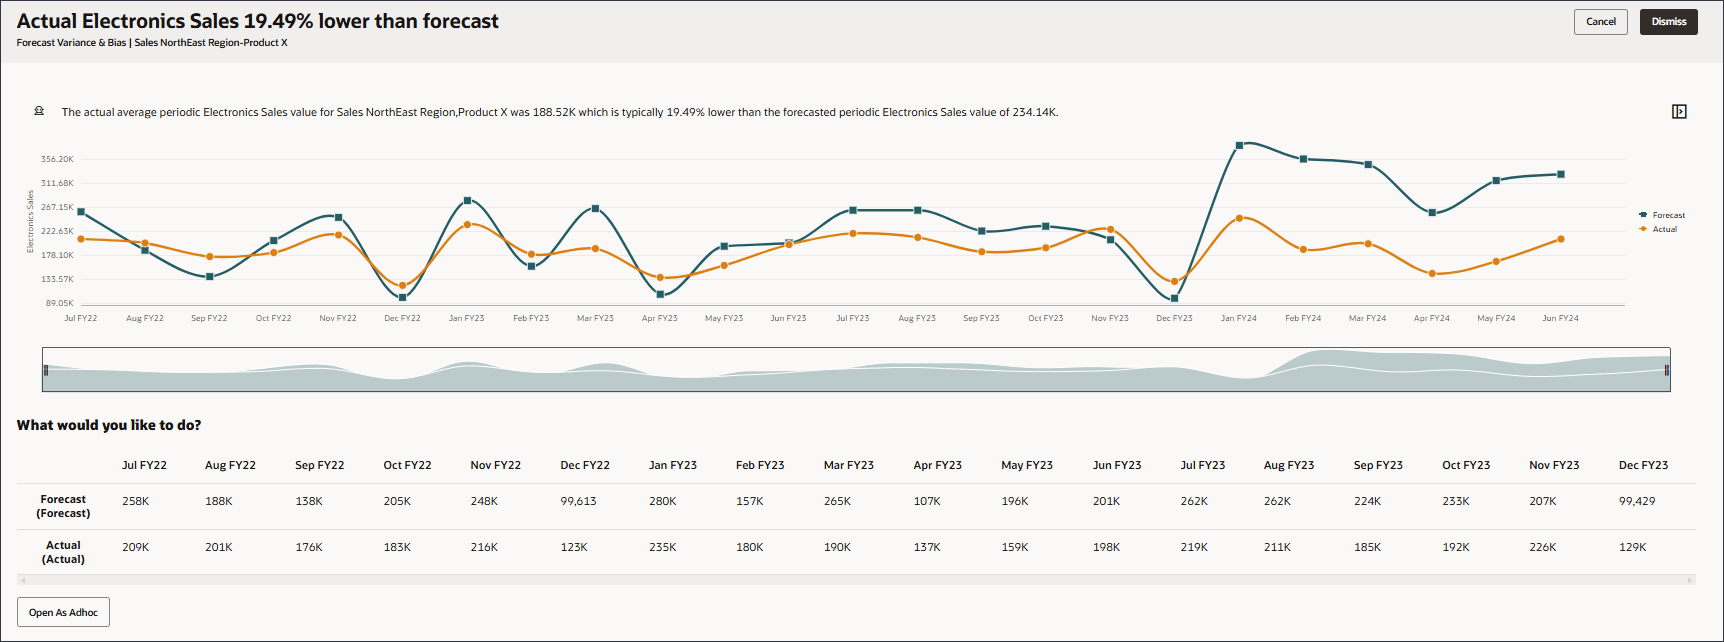
- Forecast variance and bias insights: reveal hidden bias in forecasts submitted by planners by analyzing historical forecasts and actual data. This type of insight measures the variance or bias between two historical scenarios such as Forecasts and Actuals.
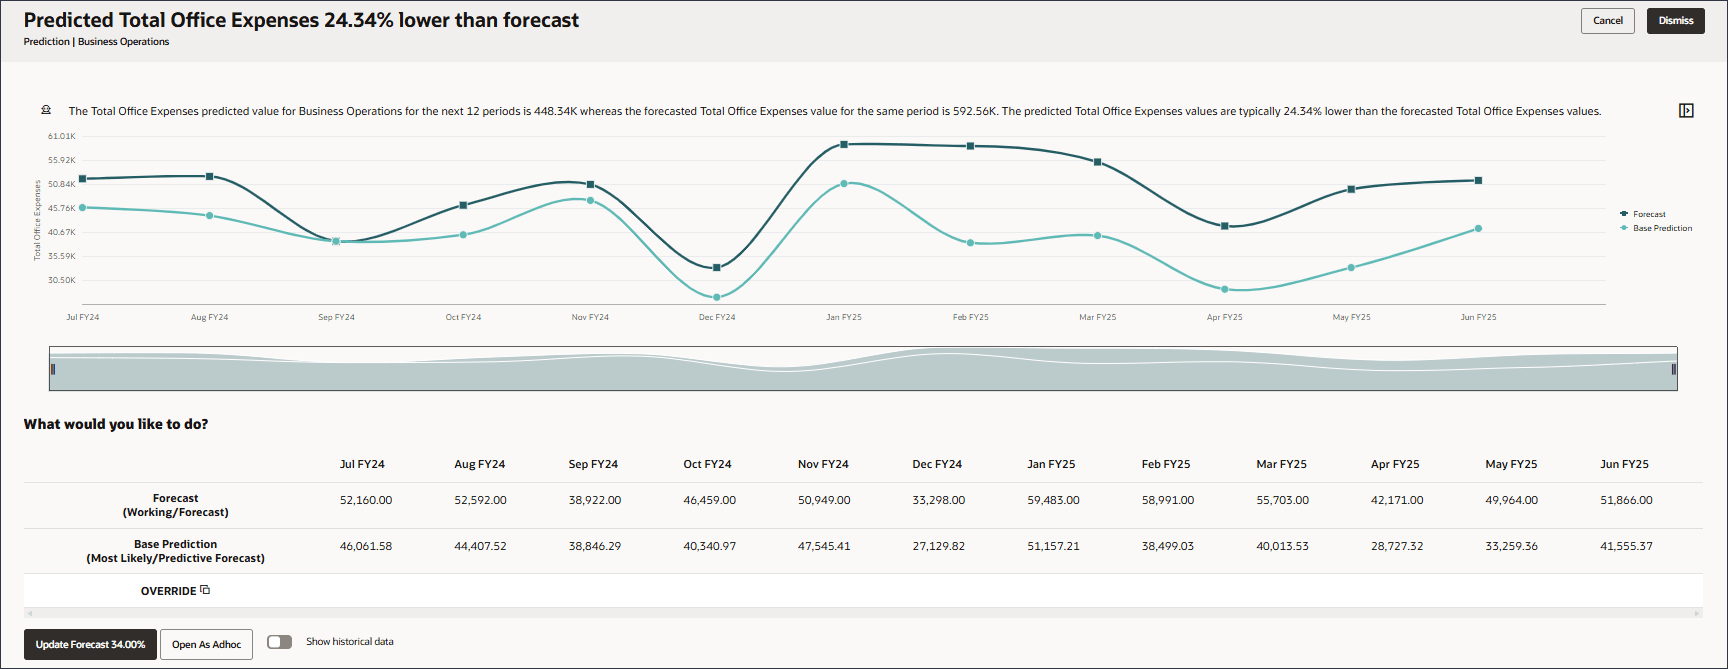
- Prediction insights: review where variances are greatest between future forecasts compared with machine predictions. For prediction insights, you need prediction data generated for future time periods. If prediction data is not available, you can automatically predict data using Auto Predict. You can bring in Machine Learning predictions or other predicted data to use for Prediction Insights.
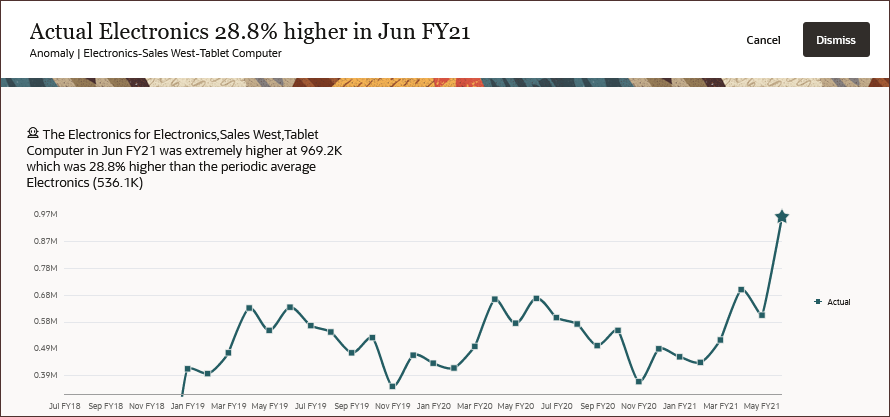
- Anomaly insights: detect unusual patterns in data. This type of insight detects outlier values that vary widely from other values, for example, a sudden volatility in actuals due to an external or internal event.
Prerequisites
Cloud EPM Hands-on Tutorials may require you to import a snapshot into your Cloud EPM Enterprise Service instance. Before you can import a tutorial snapshot, you must request another Cloud EPM Enterprise Service instance or remove your current application and business process. The tutorial snapshot will not import over your existing application or business process, nor will it automatically replace or restore the application or business process you are currently working with.
Before starting this tutorial, you must:
- Have Service Administrator access to a Cloud EPM Enterprise Service instance. The instance should not have a business process created.
- Upload and import this snapshot into your instance.
Note:
If you run into migration errors importing the snapshot, re-run the migration excluding the HSS-Shared Services component, as well as the Security and User Preferences artifacts in the Core component. For more information on uploading and importing snapshots, refer to the Administering Migration for Oracle Enterprise Performance Management Cloud documentation.Reviewing Configured Insights
In this section, you review the configuration for Insights.
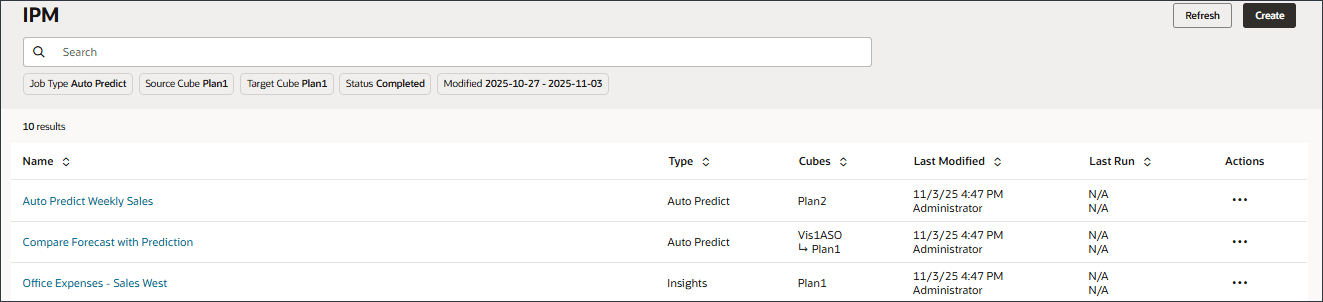
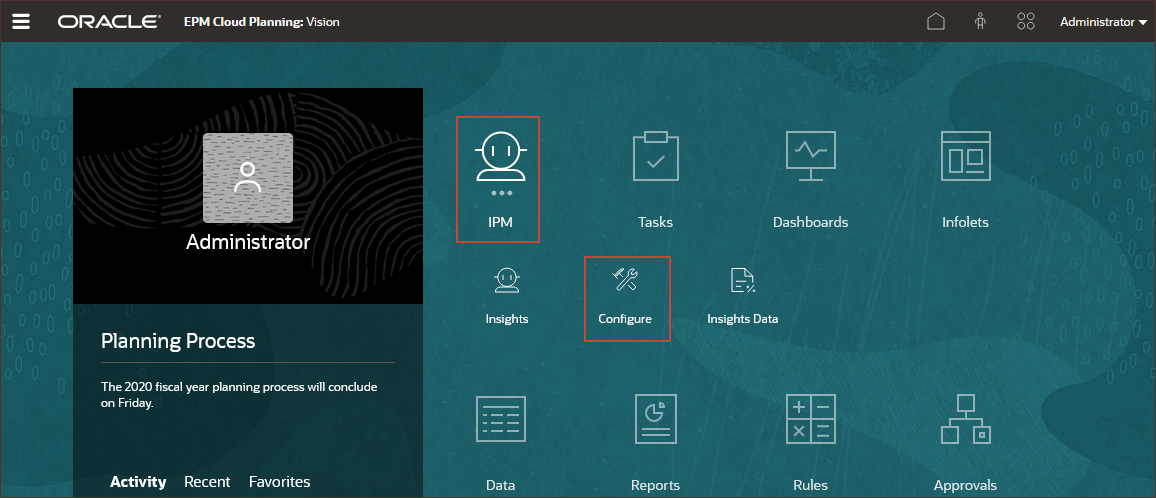
- On the home page, click IPM, then Configure.

Configured Insights are displayed.
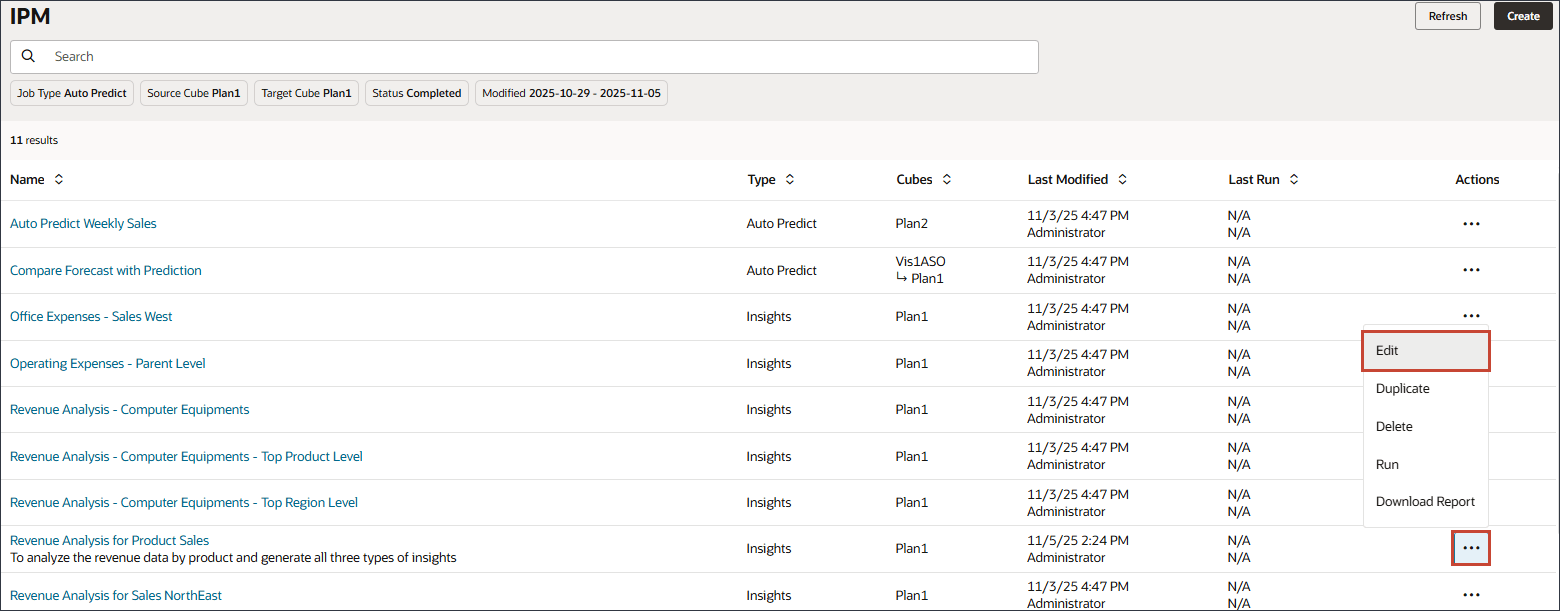
- Scroll down and in the row for Revenue Analysis for Product Sales, click
 (Actions) and select Edit.
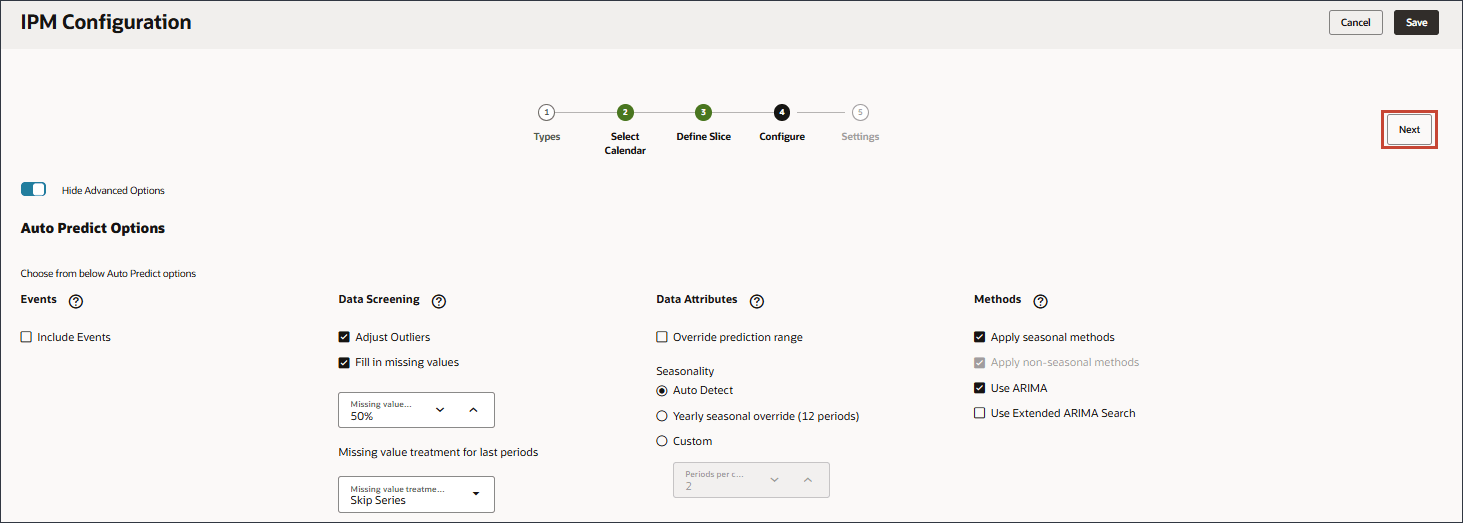
This configuration runs a revenue analysis for product sales to analyze revenue by product and generates forecast variance and bias insights, prediction insights, and anomaly insights. Auto Predict is used to predict future performance based on historical data using time series forecasting techniques.
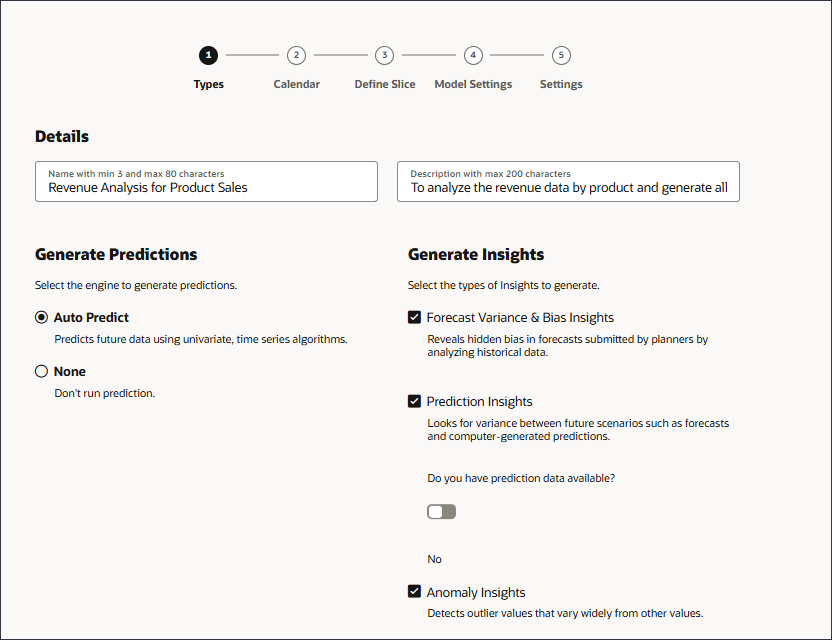
- Click Next.
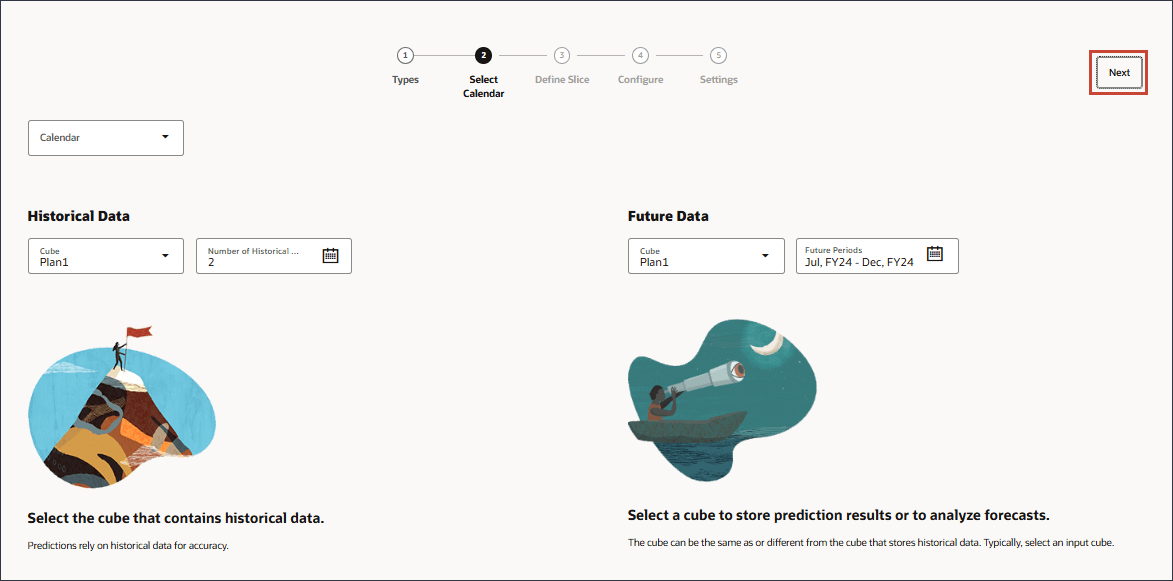
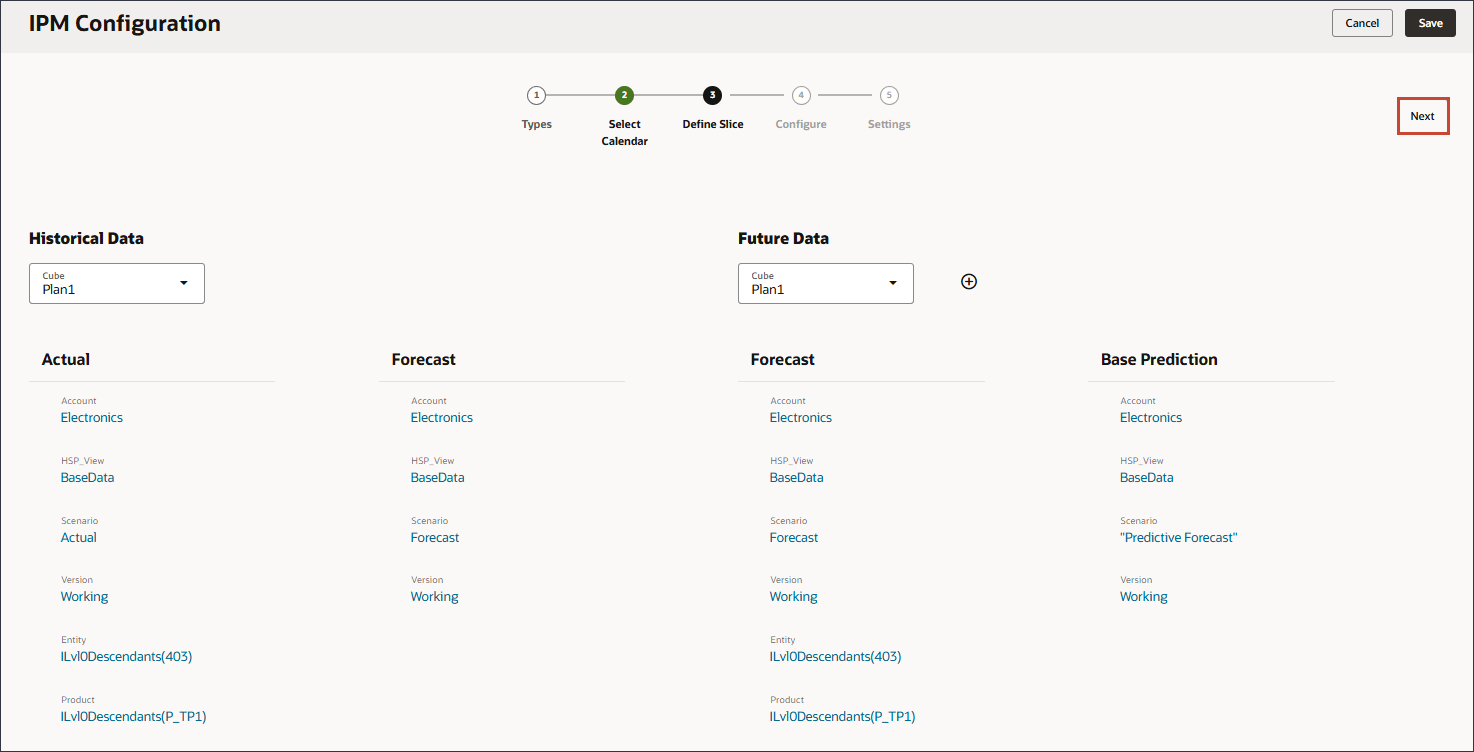
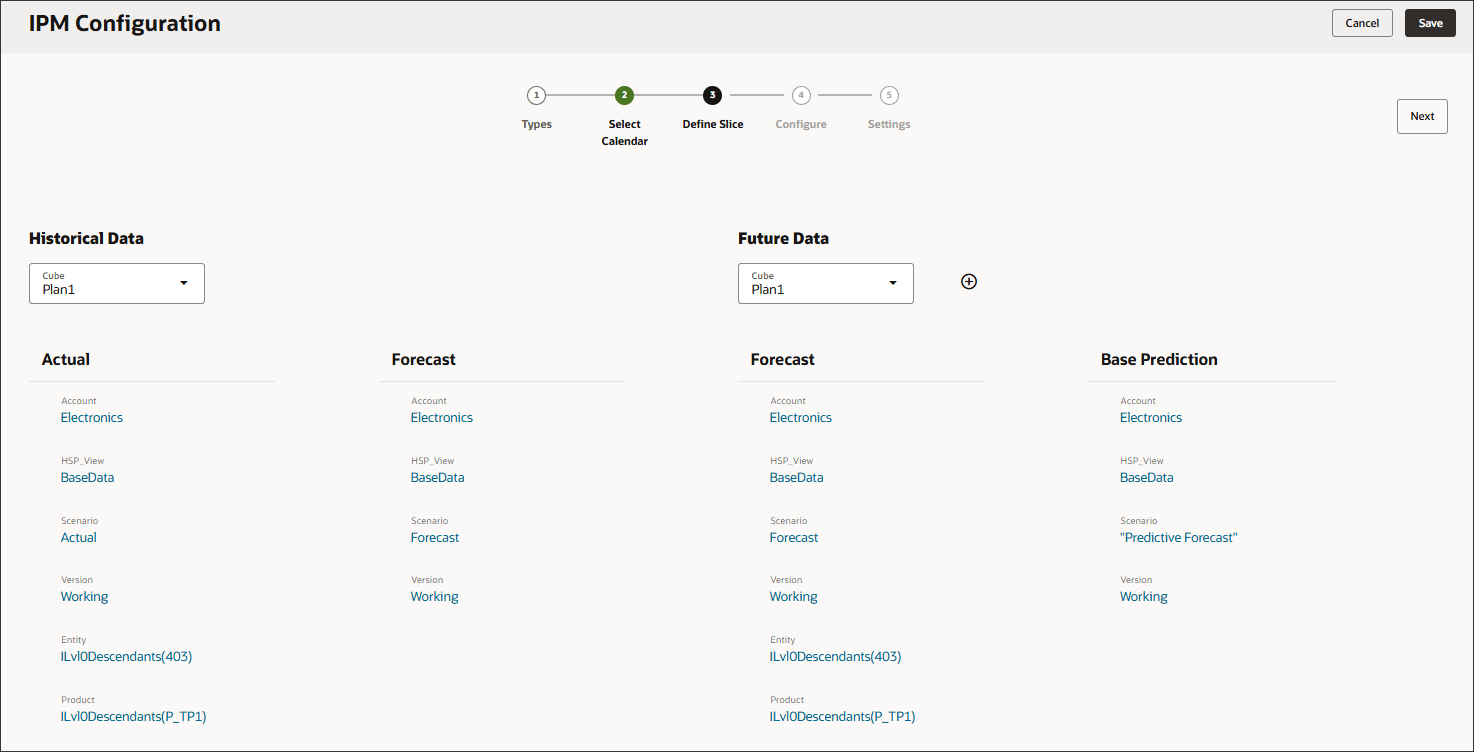
If you want to include a calendar, it would be specified on this page. Both historical and future data are defined. For historical data, the cube, and number of historical years are specified.
For future data, the cube and the future periods are specified. Future Periods specifies what periods are included in the analysis for future data. Prediction results are stored in this location when you select Auto Predict.

- Click Next.
- Click Next.
- Scroll down to Prediction Insights.
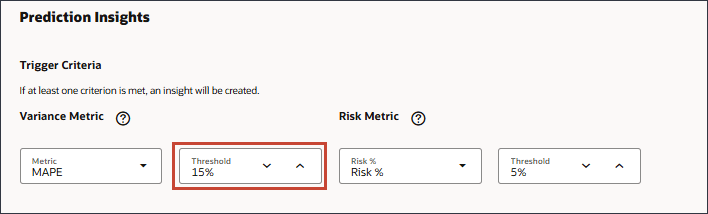
For Prediction insights, the threshold percentage defines the acceptable percentage variance between future forecasts submitted by planners and computer-generated predictions.
- Scroll down to review Anomaly Insights.
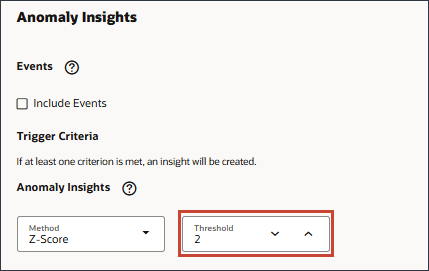
For Anomaly insights, the threshold defines the acceptable threshold for Z-score value, the standard deviation from the mean of the values. Anything that is too far from zero is typically considered an outlier.
- Scroll up and click Next.
The Settings page shows the selected display dimensions for the Insights list and the impact magnitude thresholds.
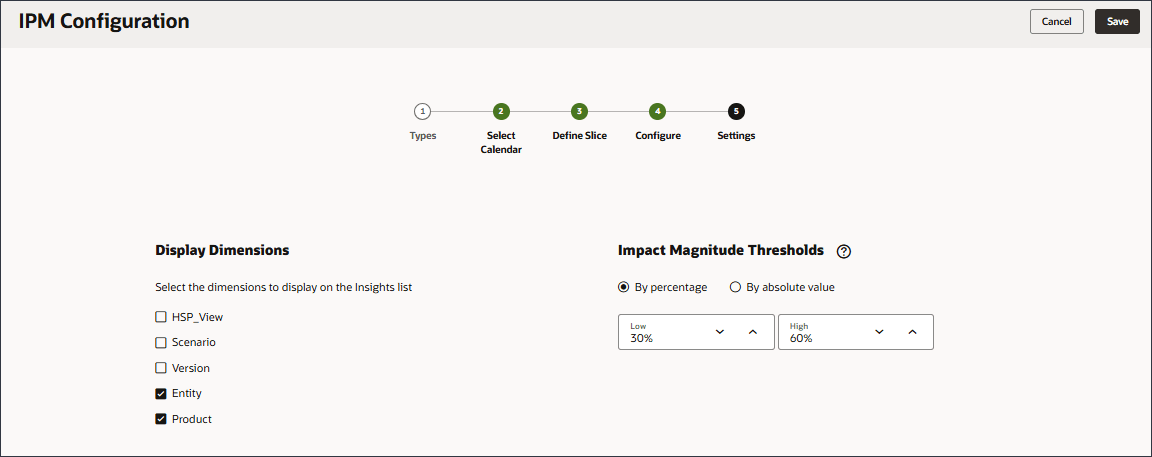
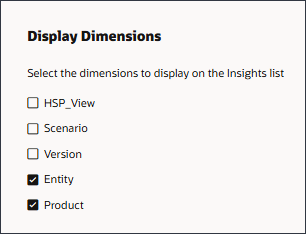
Display Dimensions are the dimensions that planners will use to navigate and analyze the insights. The selected dimensions display on the Insights display.
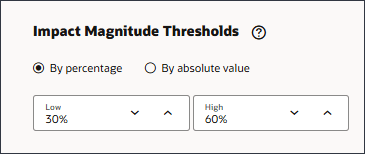
Impact Magnitude Thresholds define the low and high thresholds. When insights are displayed on the Insights display, this setting categorizes insights into High, Medium, and Low groups based on the percentage impact calculated for each insight. This helps focus attention on the insights that have more extreme variations.
- Click Cancel.
Both historical and future data are defined.
Under Historical Data, the cube and slice of data for both the Actual and Forecast are defined.
Under Future Data, the cube and slice of data for the future data, both the forecast provided by planners, and the base prediction, most likely a scenario, are defined.
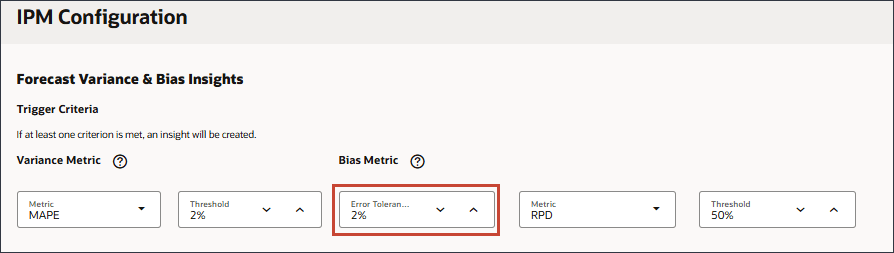
For Forecast Variance and Bias Insights, the error tolerance percentage defines the percentage variance between historical forecasts submitted by planners and actuals that lies within an acceptable range. In this example, any difference of 2% or above between historical forecasts and historical actuals is considered a significant variance and triggers an insight.
Running Insights from the Configure Page
In this section, you run Insights from the Insights Configure Page. Insights run as a job. After configuring insights, you can run them at any time. You can review the status of the job on the Jobs page.
Submitting Insights Jobs
- For Revenue Analysis for Product Sales, under Actions, click (Actions), and select Run.
When you run an insight, IPM Insights analyzes the data at each available intersection and looks for patterns and anomalies.
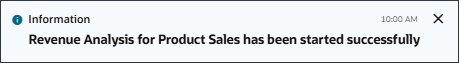
- At the information message, click X.
Note:
Insights are available on the Insights display for six months, after which they are purged the next time you run an IPM Insights job.
Reviewing Insights Jobs
You can review information about Insights jobs.
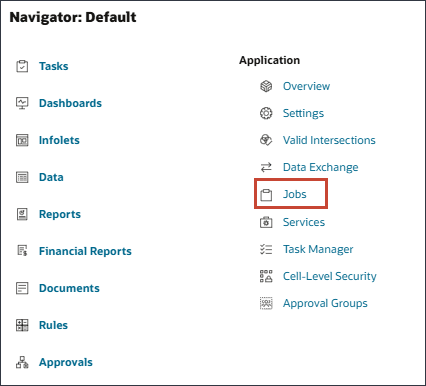
- Click
 (Navigator), and under Application, click Jobs.
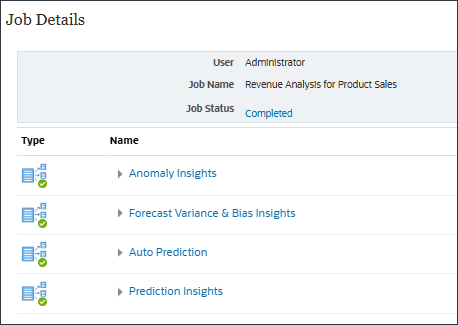
- On the Jobs page, to review the details about the job, click Revenue Analysis for Product Sales.

The associated subjobs that ran for this job are displayed.
- Next to Job Status, click Completed.
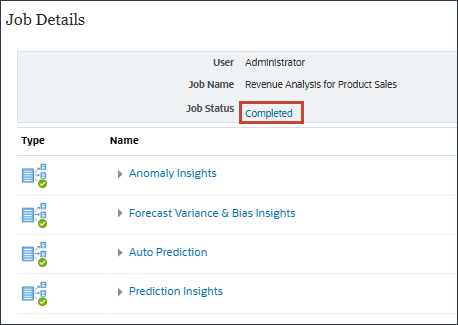
Details about the job are displayed.
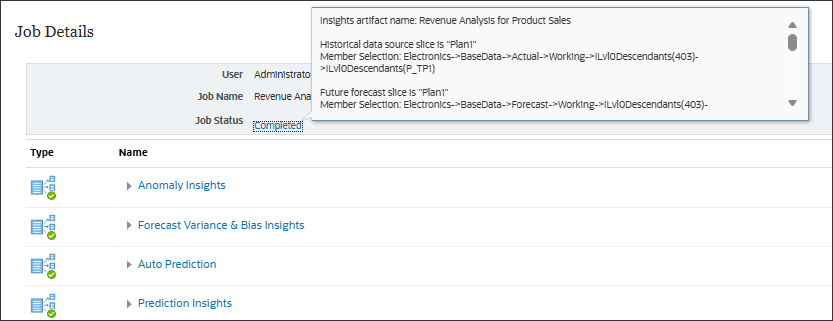
- Click outside the details display to close the details.
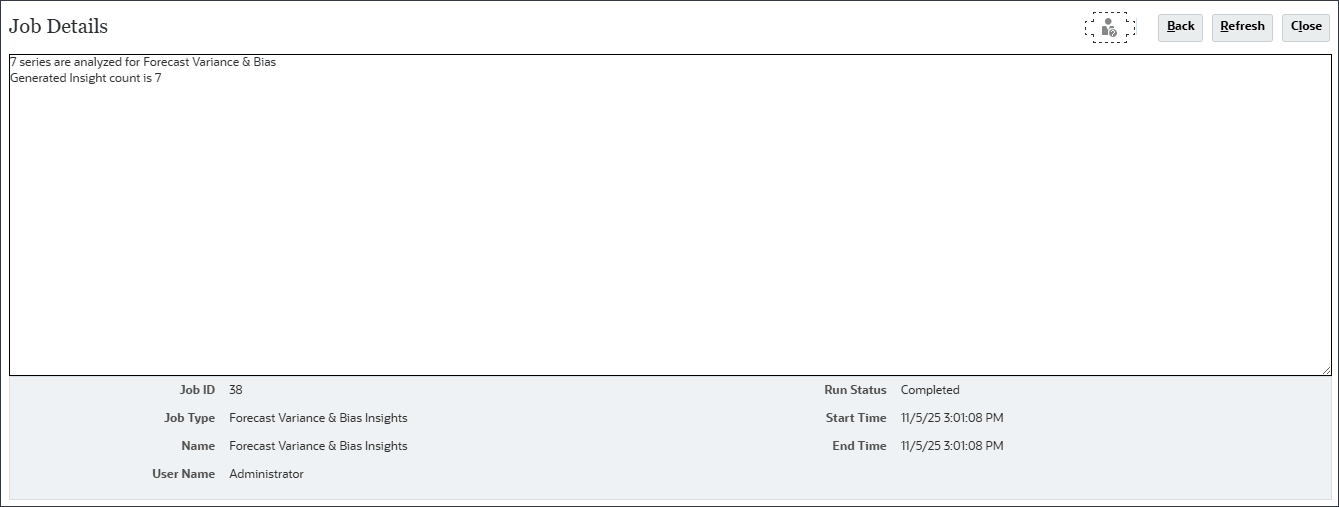
- Click Forecast Variance & Bias Insights.
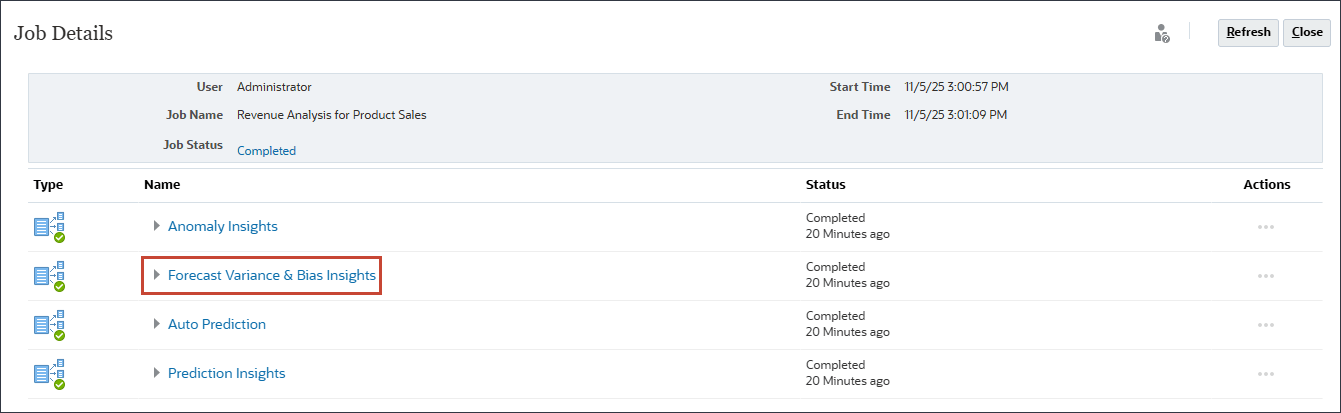
Job Details are displayed. After analyzing seven series for forecast variance and bias, seven insights were generated.
- Click Back.
- Click Anomaly Insights.
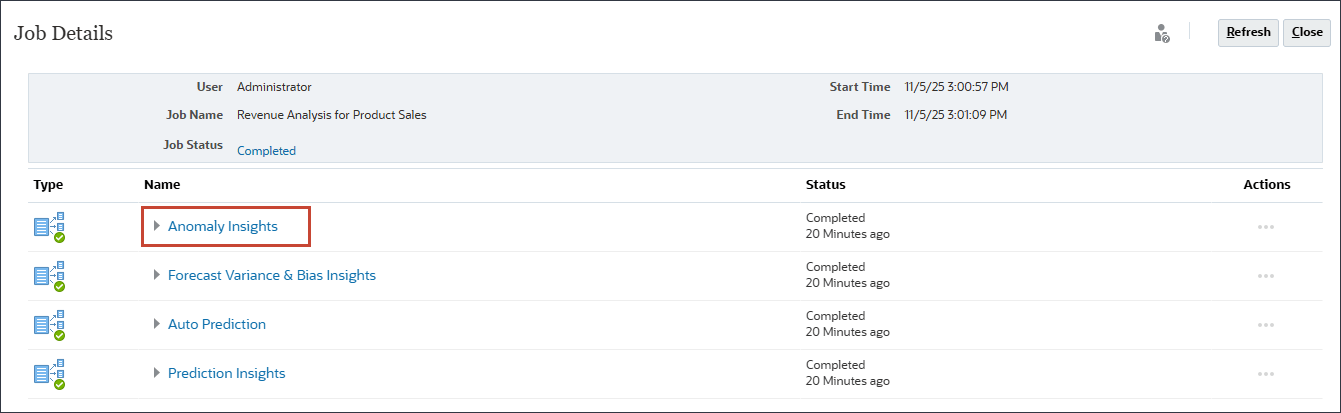
Job Details are displayed. After analyzing seven series for anomaly insights, five insights were generated.

- Click Back.
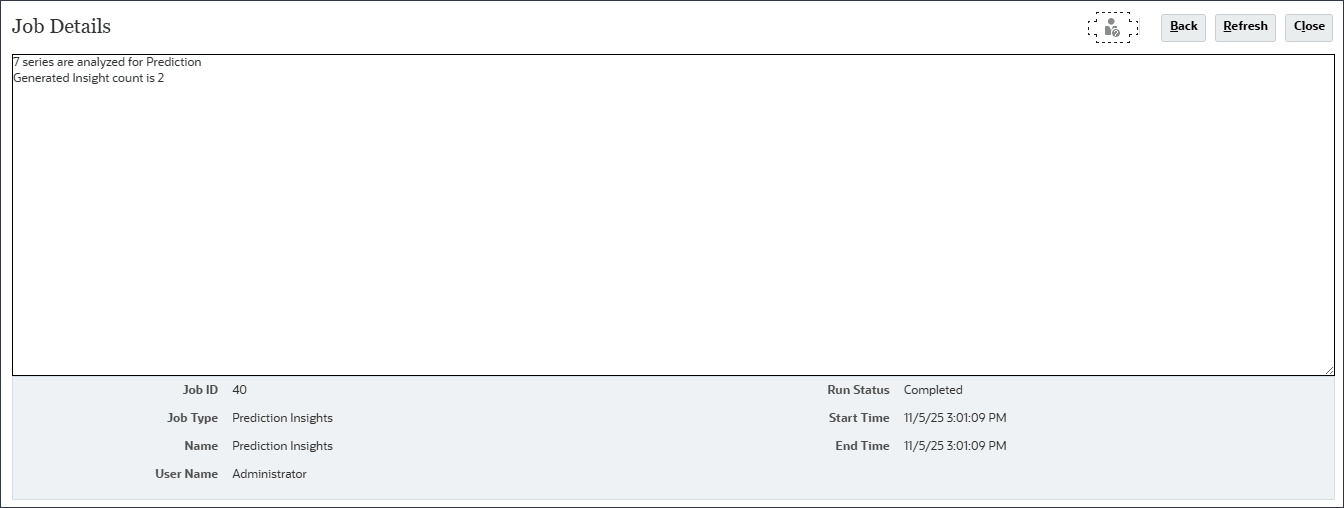
- Click Prediction Insights.
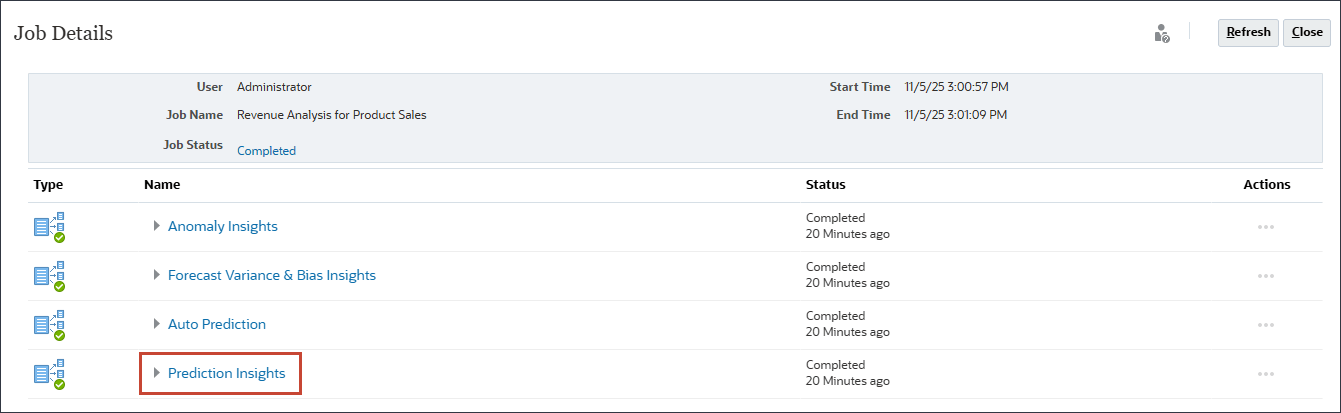
Job details are displayed. After analyzing seven series for prediction, two insights were generated.
- Click Close.
Scheduling Insights to Run
In this section you schedule Insights to run at a future time. You set up a job to run insights at regular intervals, for example, when you have a new set of actuals.
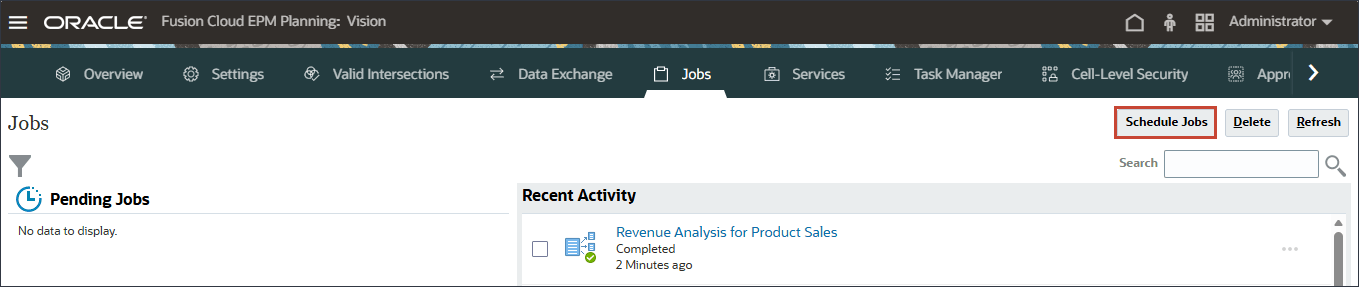
- On the Jobs page, click Schedule Jobs.
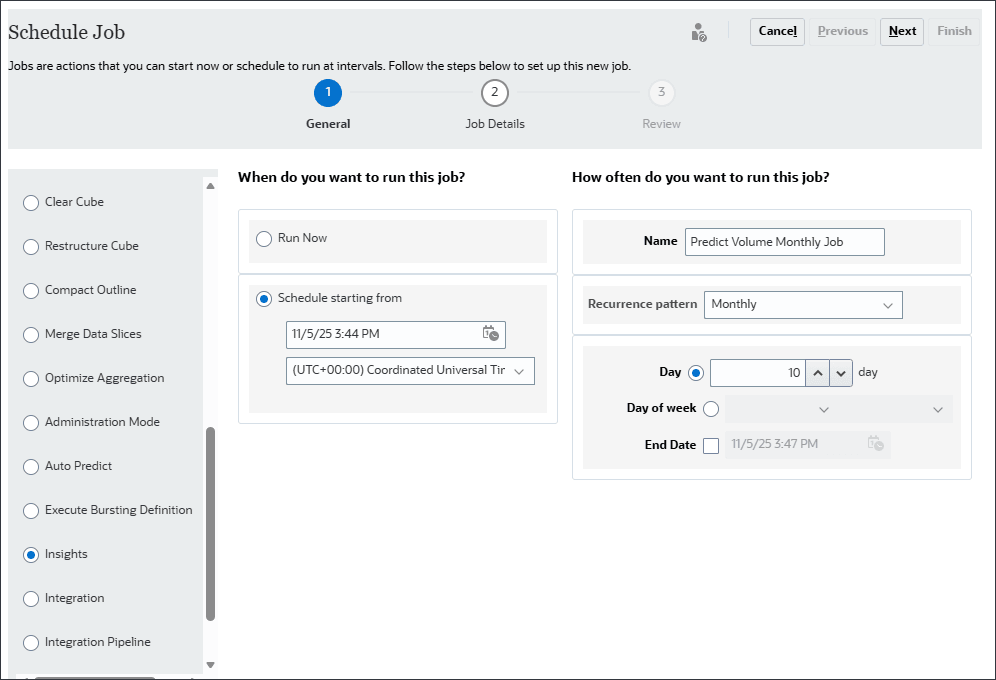
- On the left, under "What type of job is this?", scroll down and select Insights.
- Set up a monthly job. Set it to run on the 10th day of the month following today's date, similar to the following, and click Next.
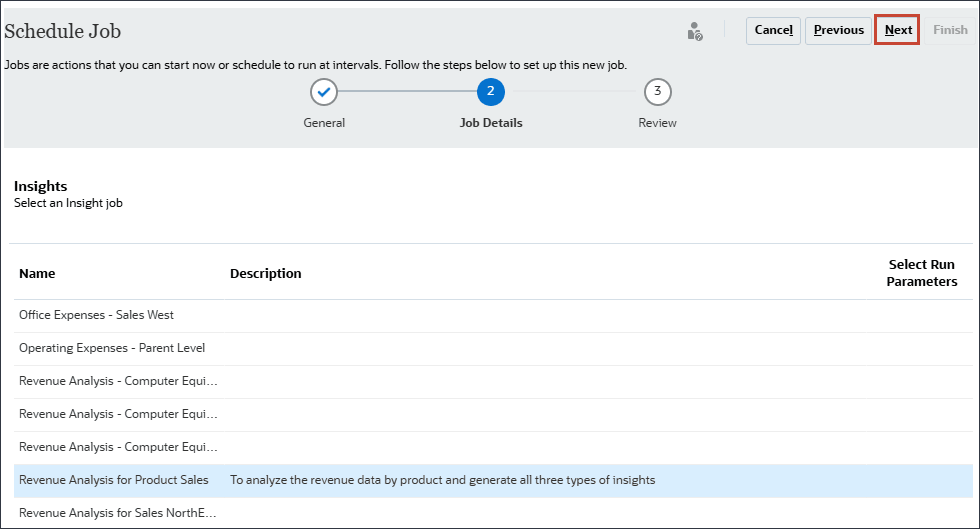
- Select Revenue Analysis for Product Sales, and click Next.
- Review the job selections, and click Finish.
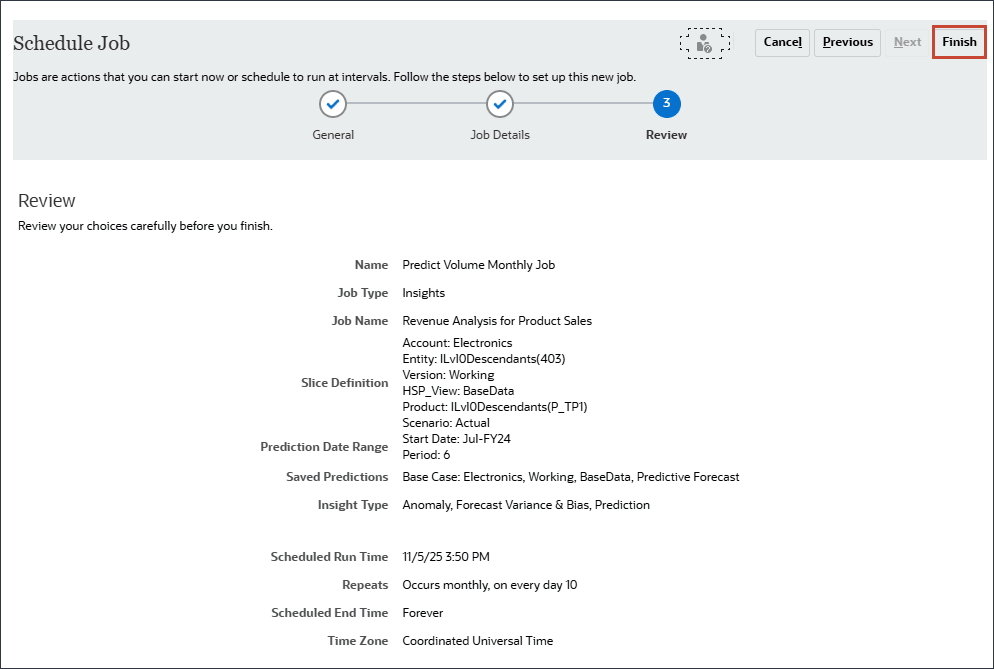
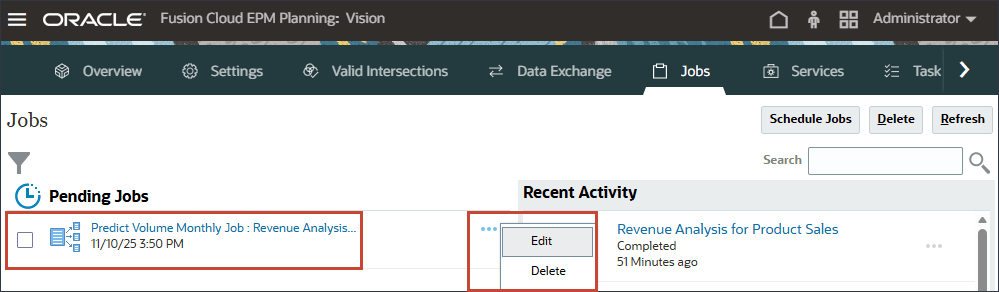
The job is scheduled and is listed under Pending Jobs. You can edit or delete the scheduled job.
More Learning Resources
Explore other labs on docs.oracle.com/learn or access more free learning content on the Oracle Learning YouTube channel. Additionally, visit Oracle University to view training resources available.
For product documentation, visit Oracle Help Center.