IQR (Interquartile Range)
IQR is another robust method for labeling outliers. The IQR (interquartile range) method of outlier detection was developed by John Tukey, the pioneer of exploratory data analysis. This was in the days of calculation and plotting by hand, so the datasets involved were typically small, and the emphasis was on understanding the story the data told.
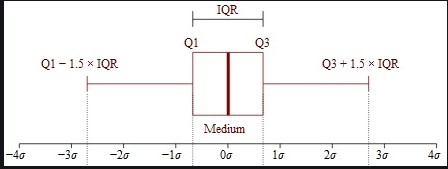
A box-and-whisker plot uses quartiles (points that divide the data into four groups of equal size) to plot the shape of the data. The box represents the 1st and 3rd quartiles, which are equal to the 25th and 75th percentiles. The line inside the box represents the 2nd quartile, which is the median.
The interquartile range, which gives this method of outlier detection its name, is the range between the first and the third quartiles (the edges of the box). Tukey considered any data point that fell outside of either 1.5 times the IQR below the first – or 1.5 times the IQR above the third – quartile to be outside or far out. In a classic box-and-whisker plot, the whiskers extend up to the last data point that is not outside.
The interquartile range (IQR) is a measure of variability, based on dividing a data set into quartiles. Quartiles divide a rank-ordered data set into four equal parts. Q1, Q2 & Q3. IQR is defined as Q3–Q1, and any data lying outside Q3+1.5*IQR or Q1-1.5*IQR is considered as an outlier.
