Z-Score
Description
The Z-score, or standard score, is a way of describing a data point in terms of its relationship to the mean and standard deviation of a group of points. Taking a Z-score is simply mapping the data onto a distribution whose mean is defined as 0 and whose standard deviation is defined as 1.
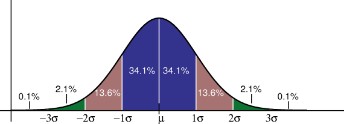
The goal of taking Z-scores is to remove the effects of the location and scale of the data, allowing different datasets to be compared directly. The intuition behind the Z-score method of outlier detection is that, once we have centered and rescaled the data, anything that is too far from zero (the threshold is usually a Z-score of 3 or -3) should be considered an outlier.
Assuming data is distributed normally (bell shaped curve), Mean + 3*SD (Standard Deviation) will capture 99.7% of the observations. Statistically, any value, which is falling outside this range, is considered as an anomaly.
