Getting More Information About a Prediction
After you run a prediction, you can get more information about the data in the chart and the predicted values.
To get more information:
-
Use the tooltips for each data series in the chart to get more information about the values.
-
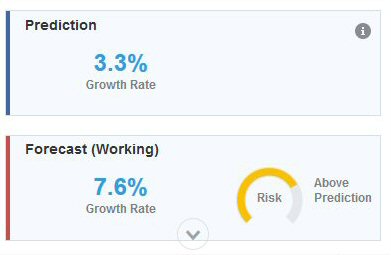
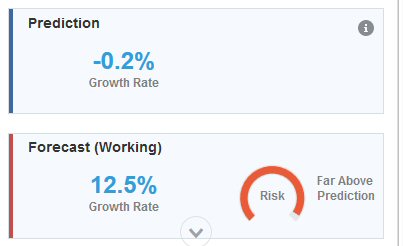
Use the Info Boxes to see details about each data series on the chart:

-
The risk gauge in the Info Box indicates the probability of a scenario occurring above or below the prediction.
-
Click
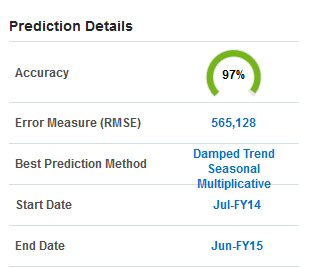
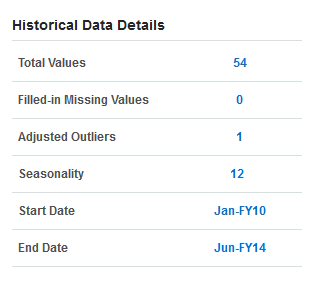
 (Details) to get more information about the prediction data or the historical data:


-
Use the tooltips to get insight about the detail information.
-
The Growth Rate makes it easy to quickly compare any two series.

The tooltips explain the comparison. For example, the growth rate statistic for the prediction indicates the year-over-year growth rate for the first year of future values compared to the last historical year.
- For more information, see Predictive Planning Forecasting and Statistical Descriptions.