Introduction
This 30-minute tutorial shows you how to adjust your forecasts in Planning.
Background
As you adjust your forecast, you can apply several techniques to modify data. You can copy data and paste it and then make further changes to that data. You can adjust data by a percentage or amount, and you can use quick commands to make your adjustments.
Data is spread automatically from summary to base time periods. You also can specify an amount or percentage by which values across multiple dimensions on the form are increased or decreased, based on the existing values in the target cells.
Include additional details to justify your forecasts by adding comments, attachments, and supporting details.
As you review and modify your data, you can control which rows or columns are displayed (or hidden). You can also sort the values in a row or column. Emphasize certain data by applying formatting.
Prerequisites
Before starting this tutorial, you must:
- Have Service Administrator access to a Cloud EPM Enterprise Service instance.
- Have the Planning sample application (Vision) created in your instance.
- Set the navigation flow to Financial Flow - Admin.
- Upload and import this Word document into your Planning instance.
Performing Data Actions in Planning
In this section, you perform data actions including copying and pasting data, adjusting data by a percentage, and adjusting data with quick commands.
Navigating to the Set Operating Expenses for Overhead Page
You navigate to an expense form to adjust data.
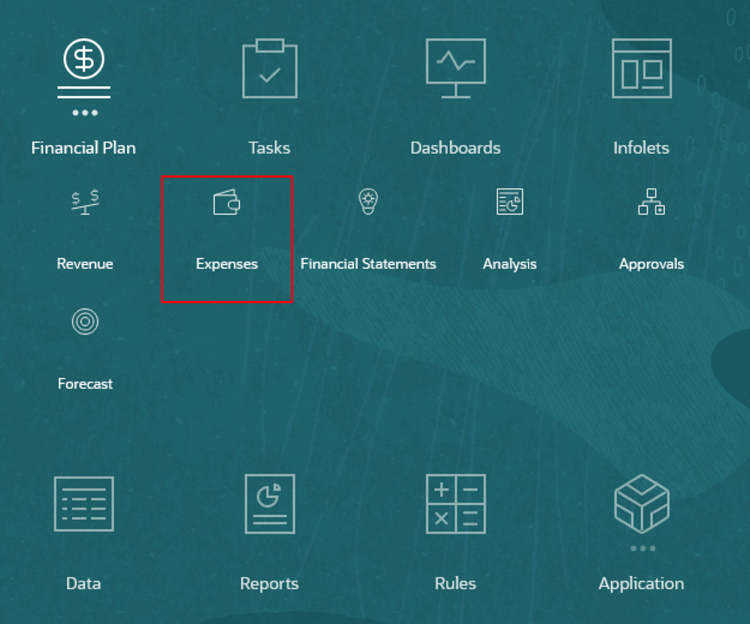
- From the Home page, click Financial Plan and then Expenses.
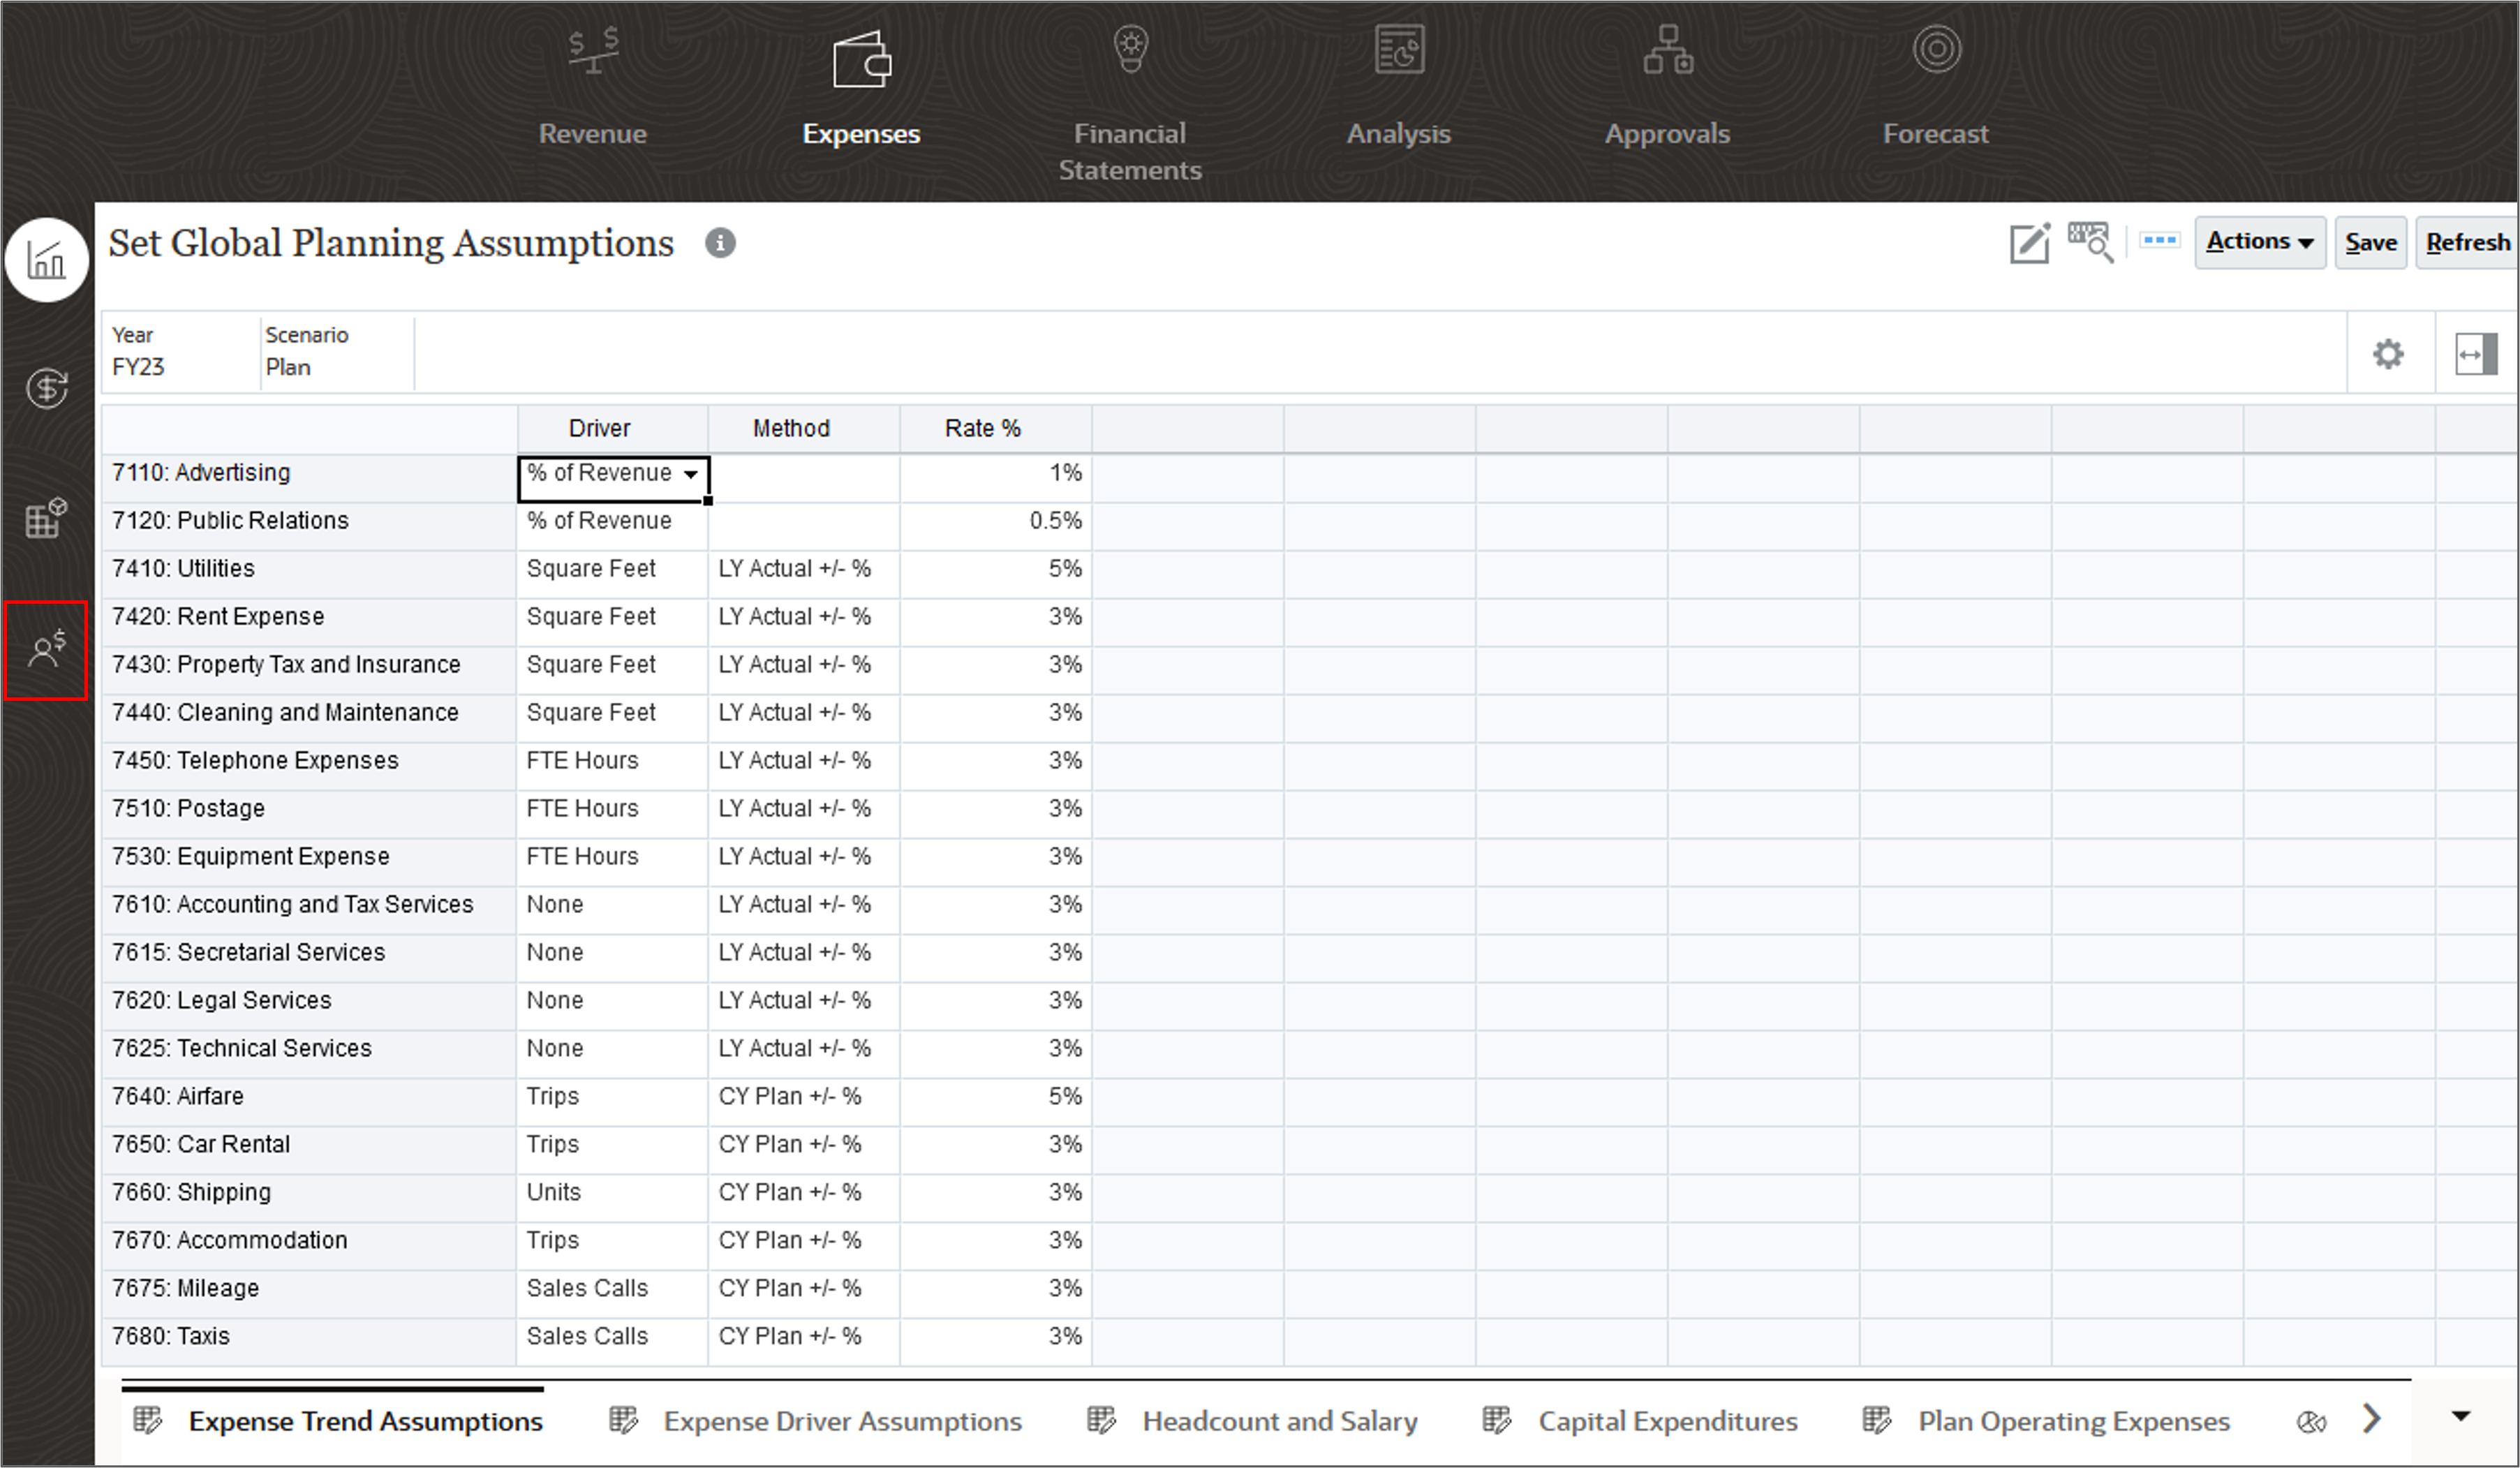
- Select the fourth tab, Other Expenses.
- Click Entity.
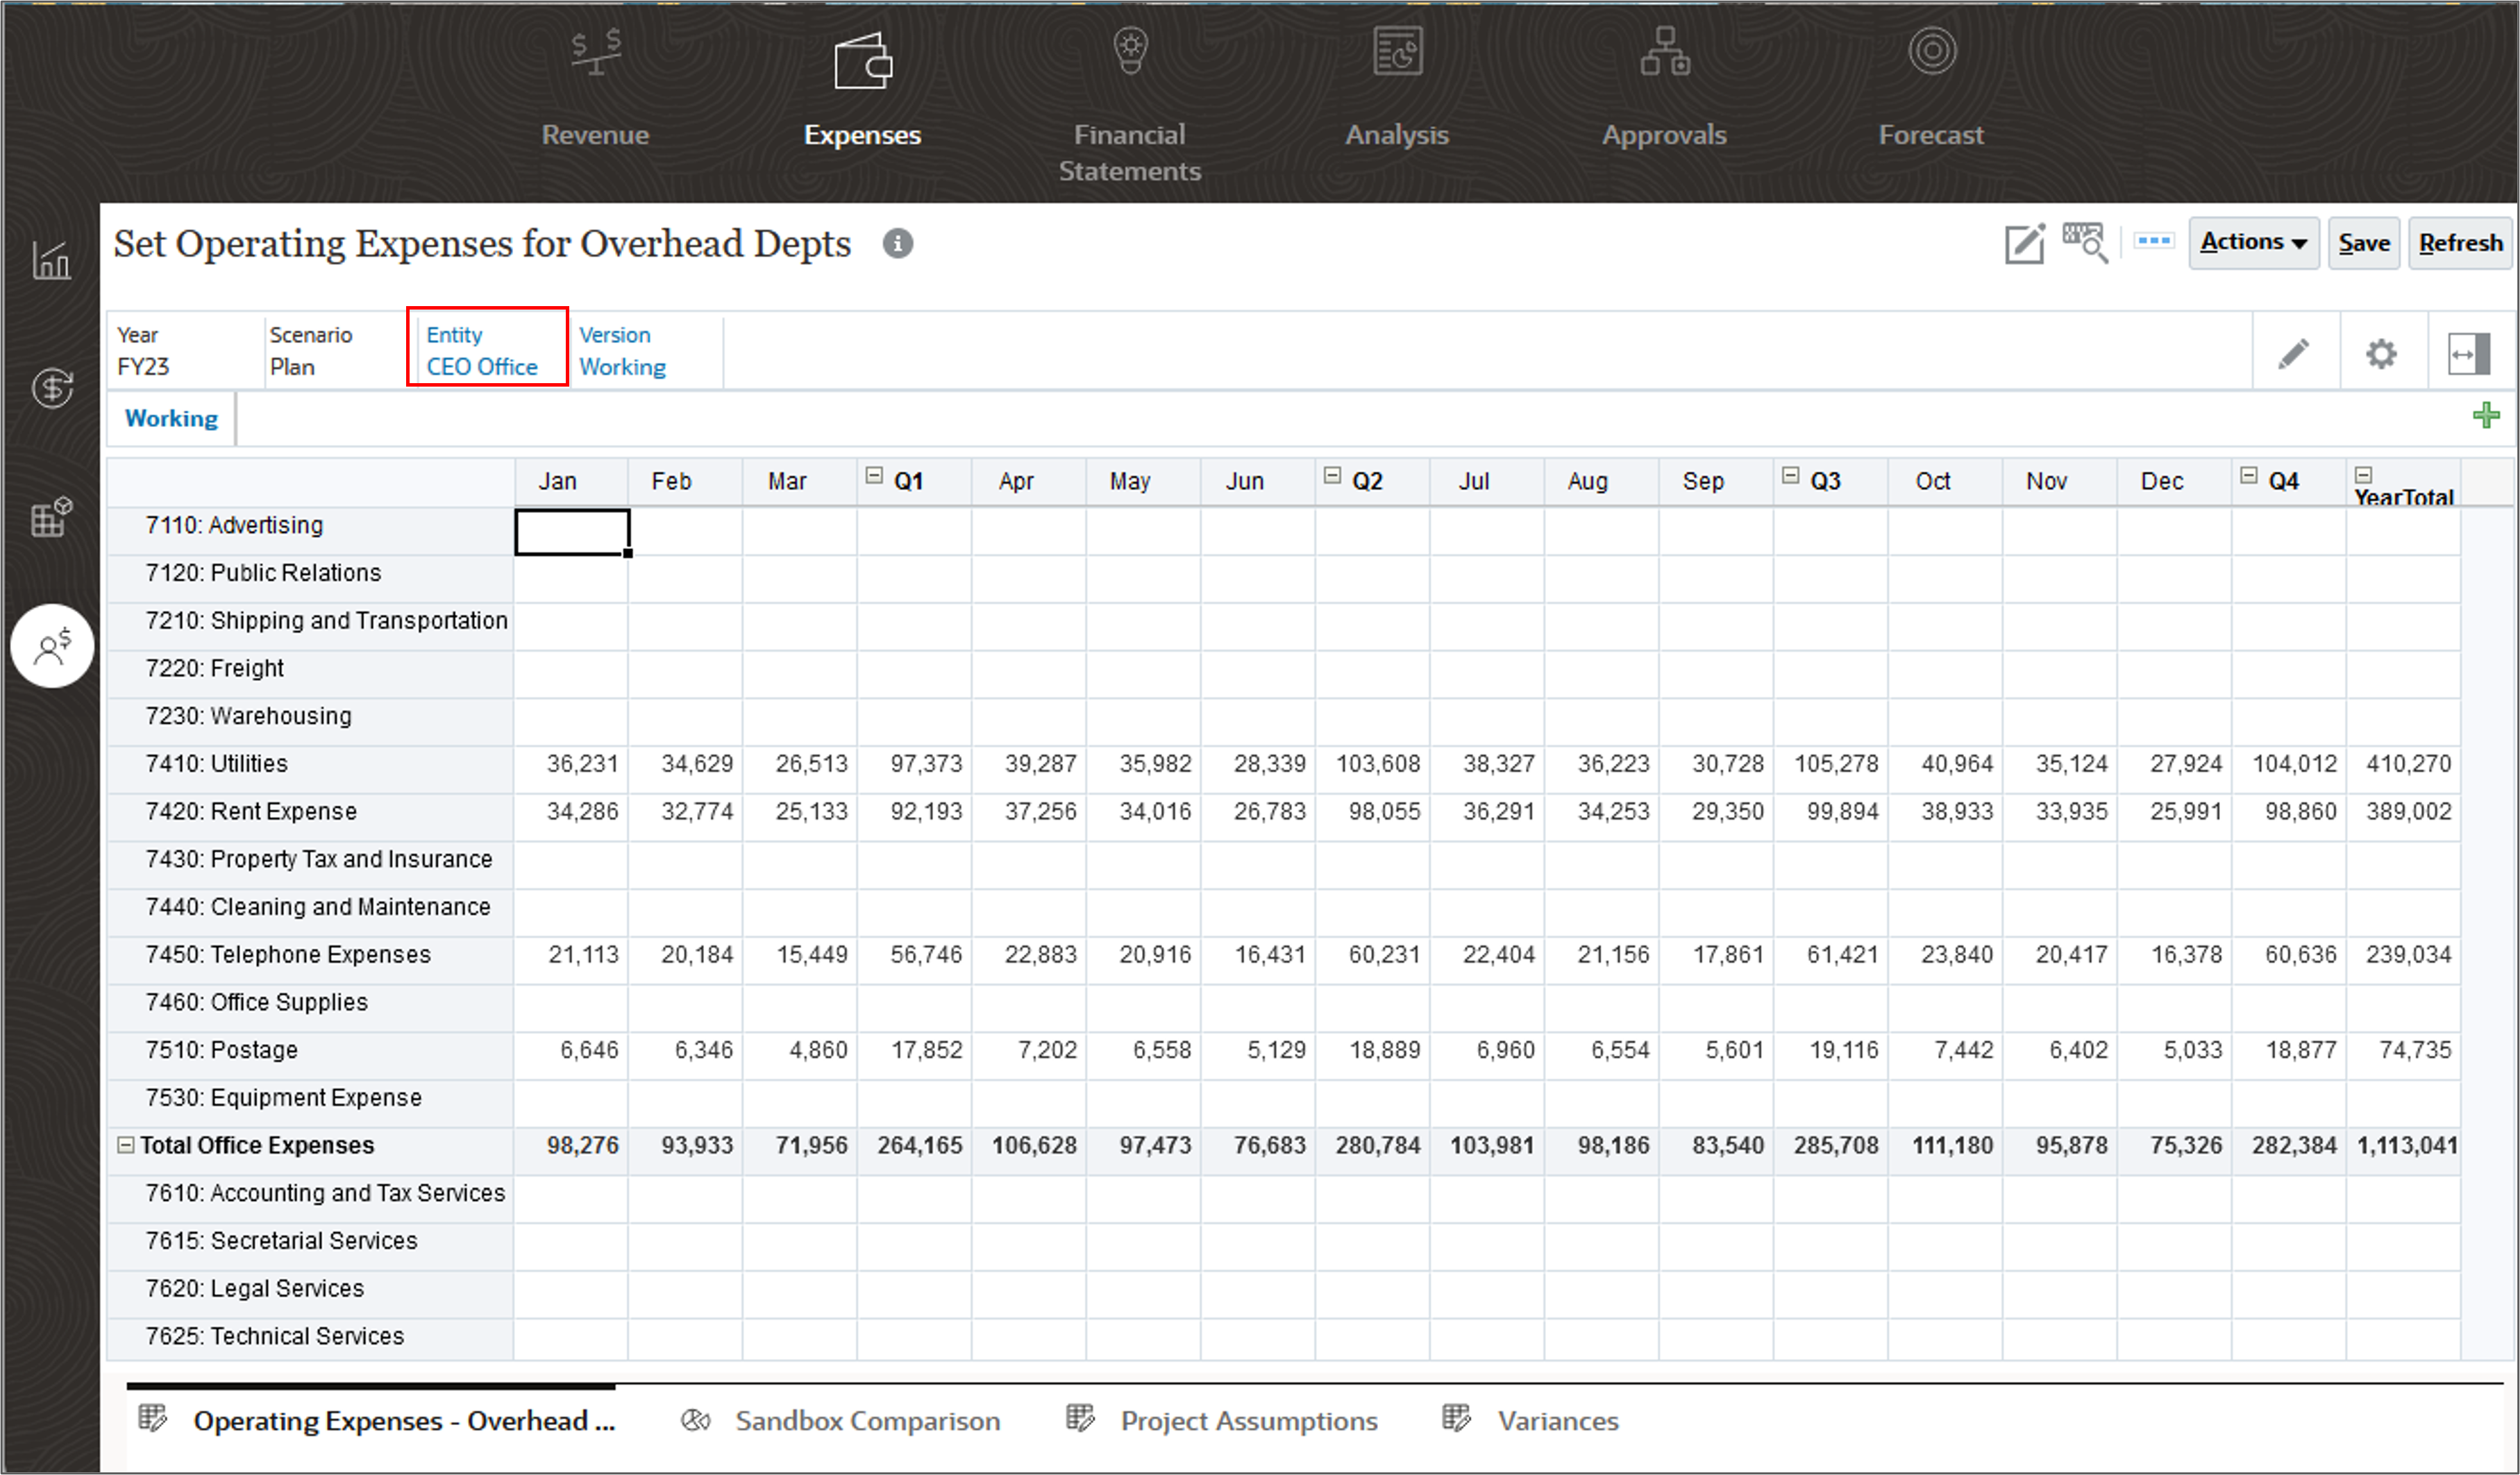
- Select CFO Office and click OK.
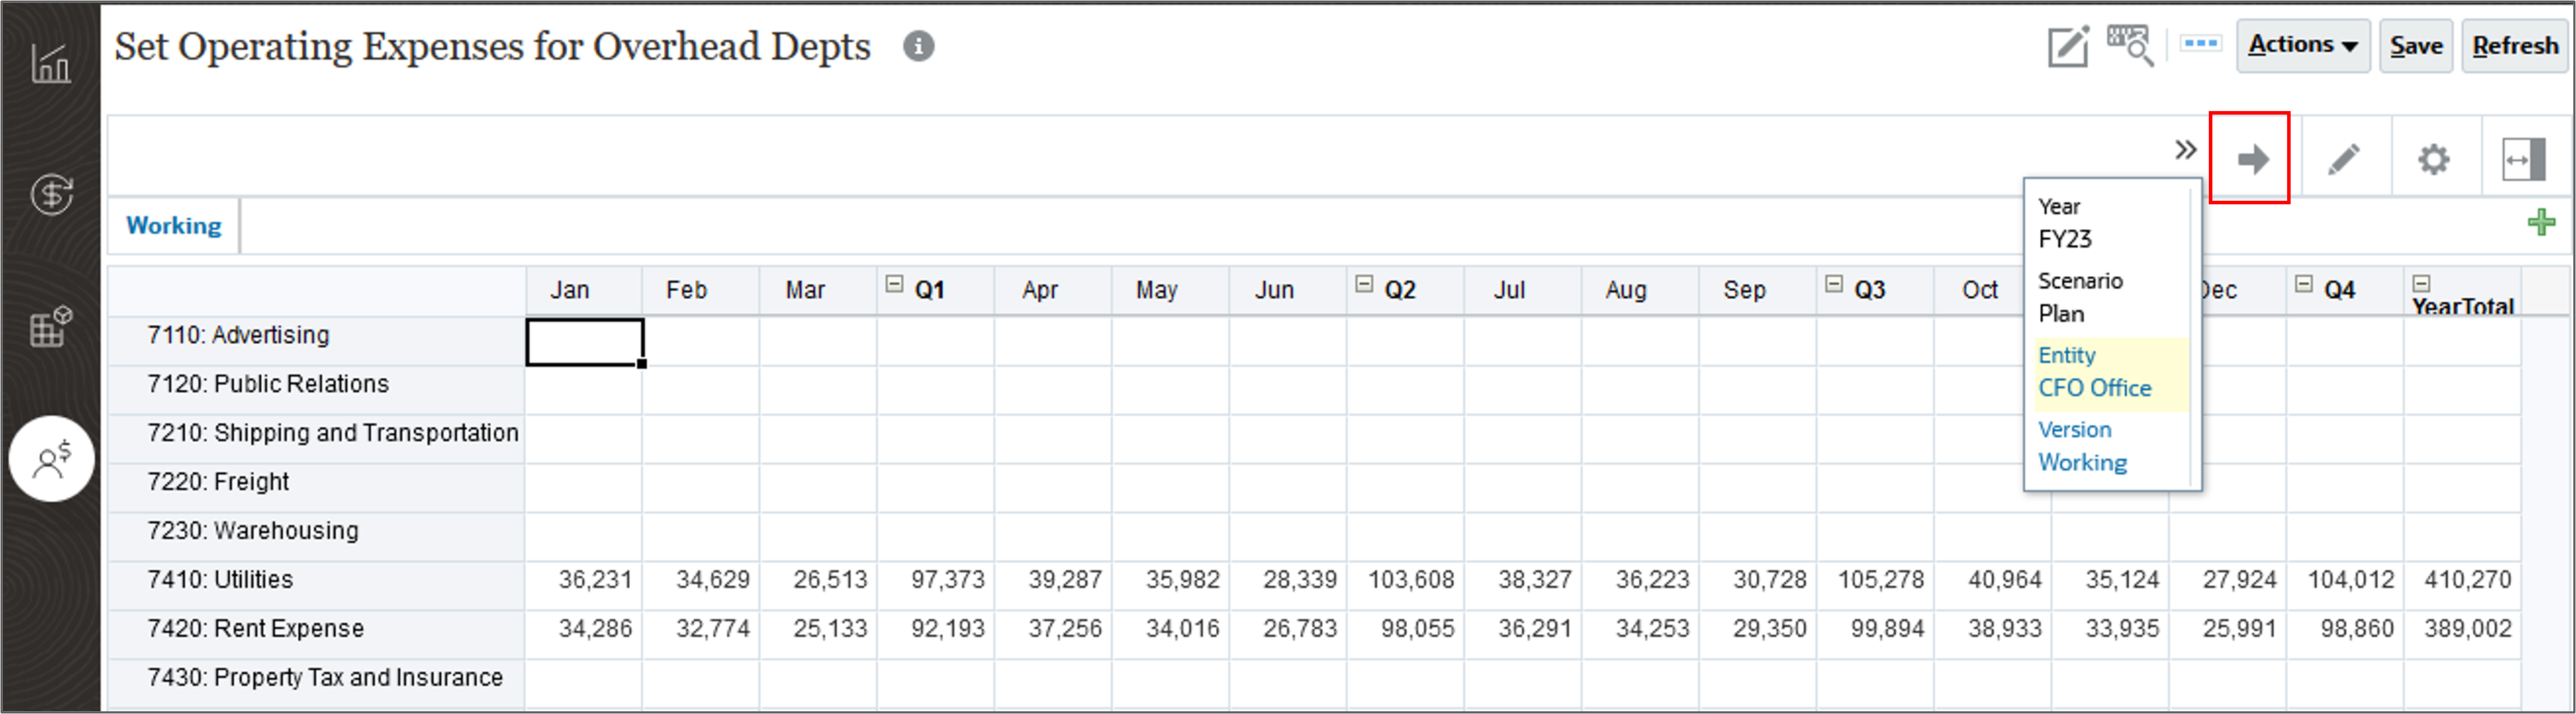
- On the POV and Page row, click
 (Go).
(Go).
Copying and Pasting Form Data in Planning
You can copy data within a form, from one form to another, or from another product, such as Microsoft Excel. When you copy within or among forms, Planning copies and pastes the cells' stored values, not the values that display based on the precision setting.
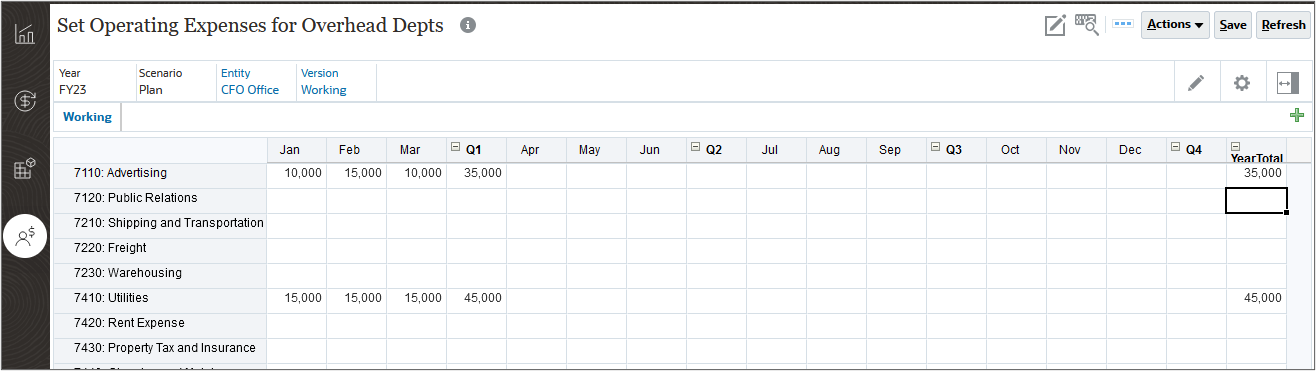
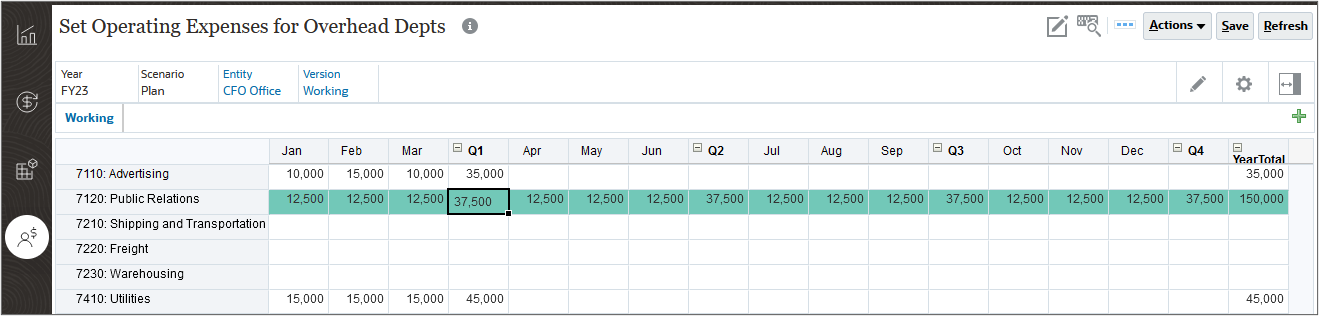
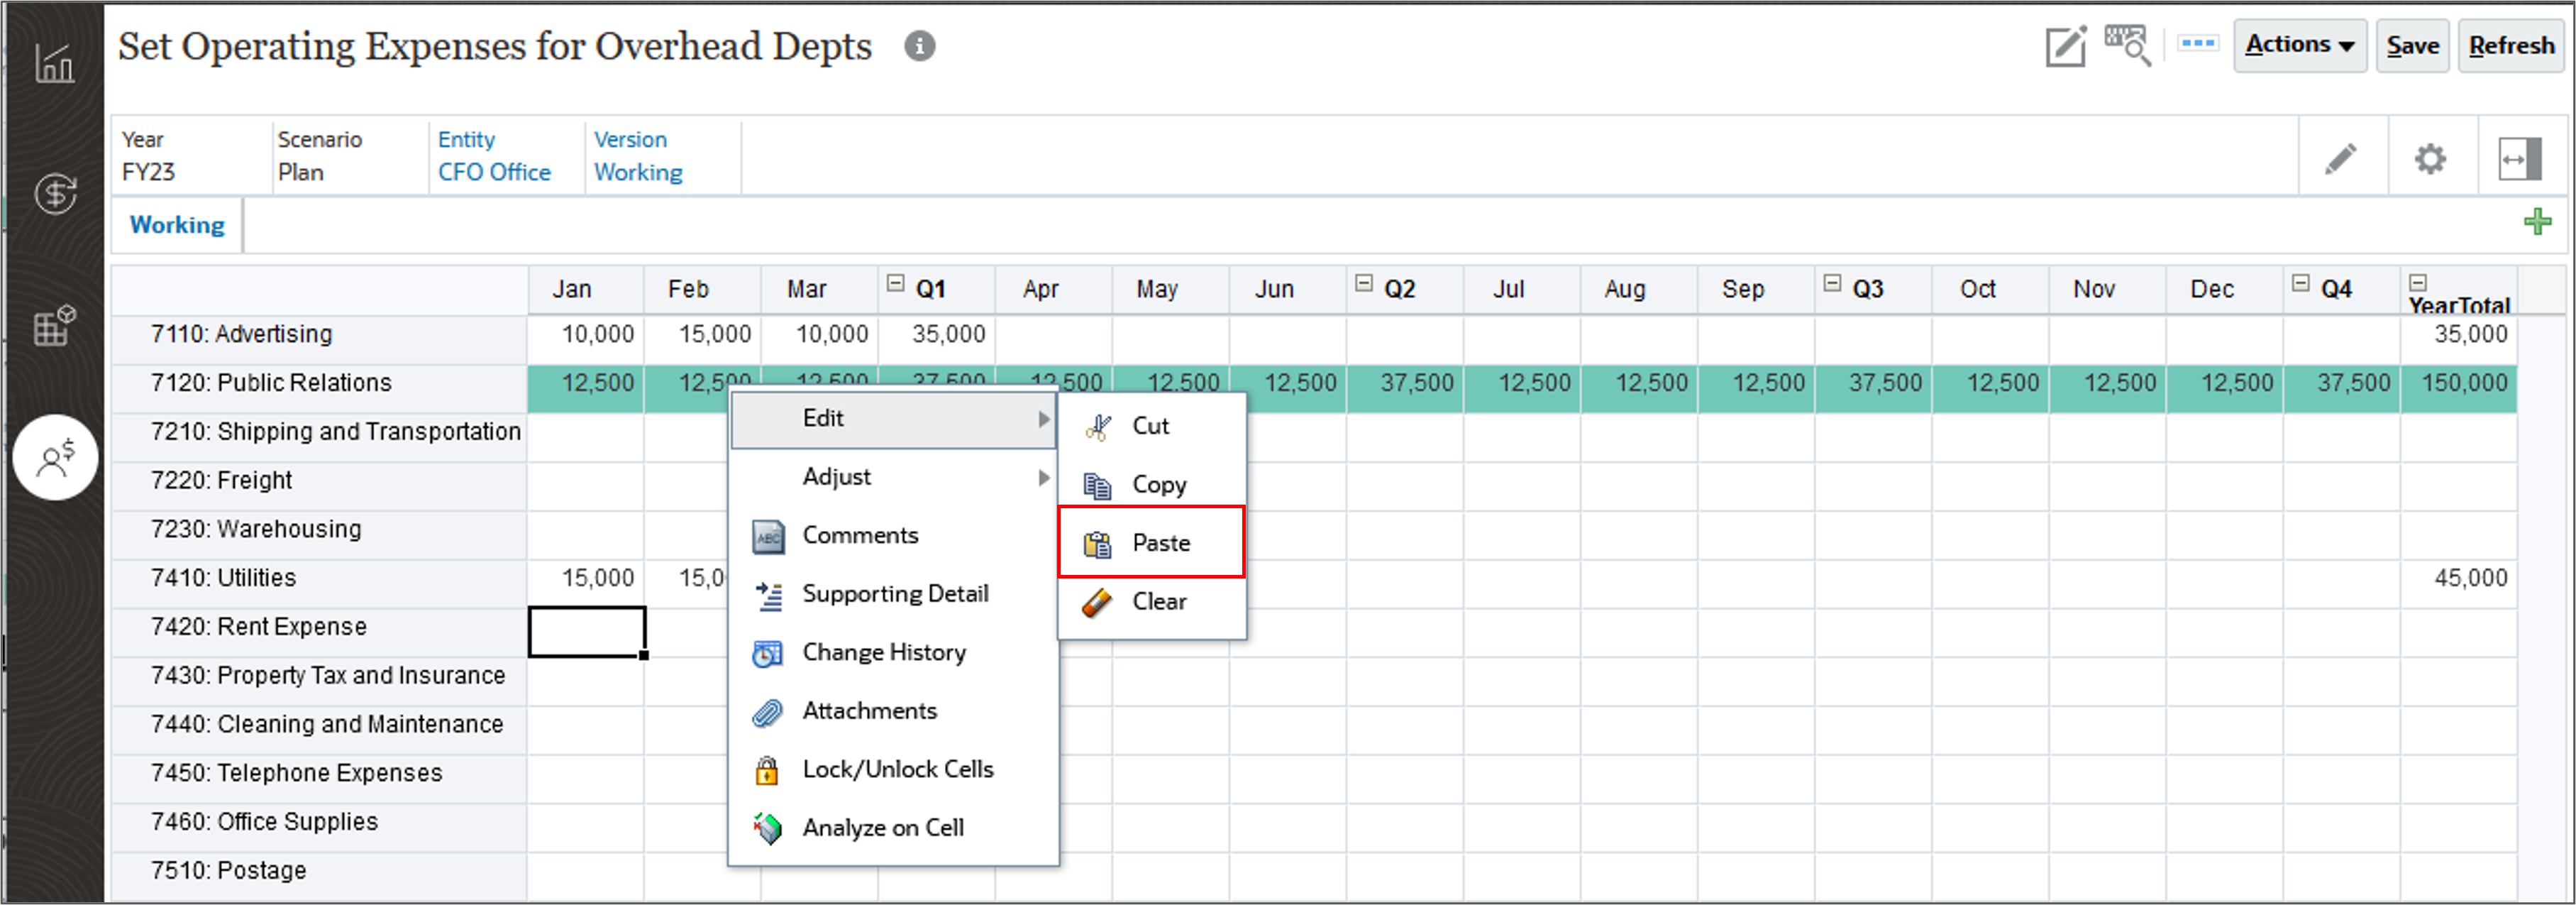
- On the Set Operating Expenses for Overhead Depts page, for Public Relations, in YearTotal, enter 150,000.
- Place your cursor in the Public Relations Q1 cell.
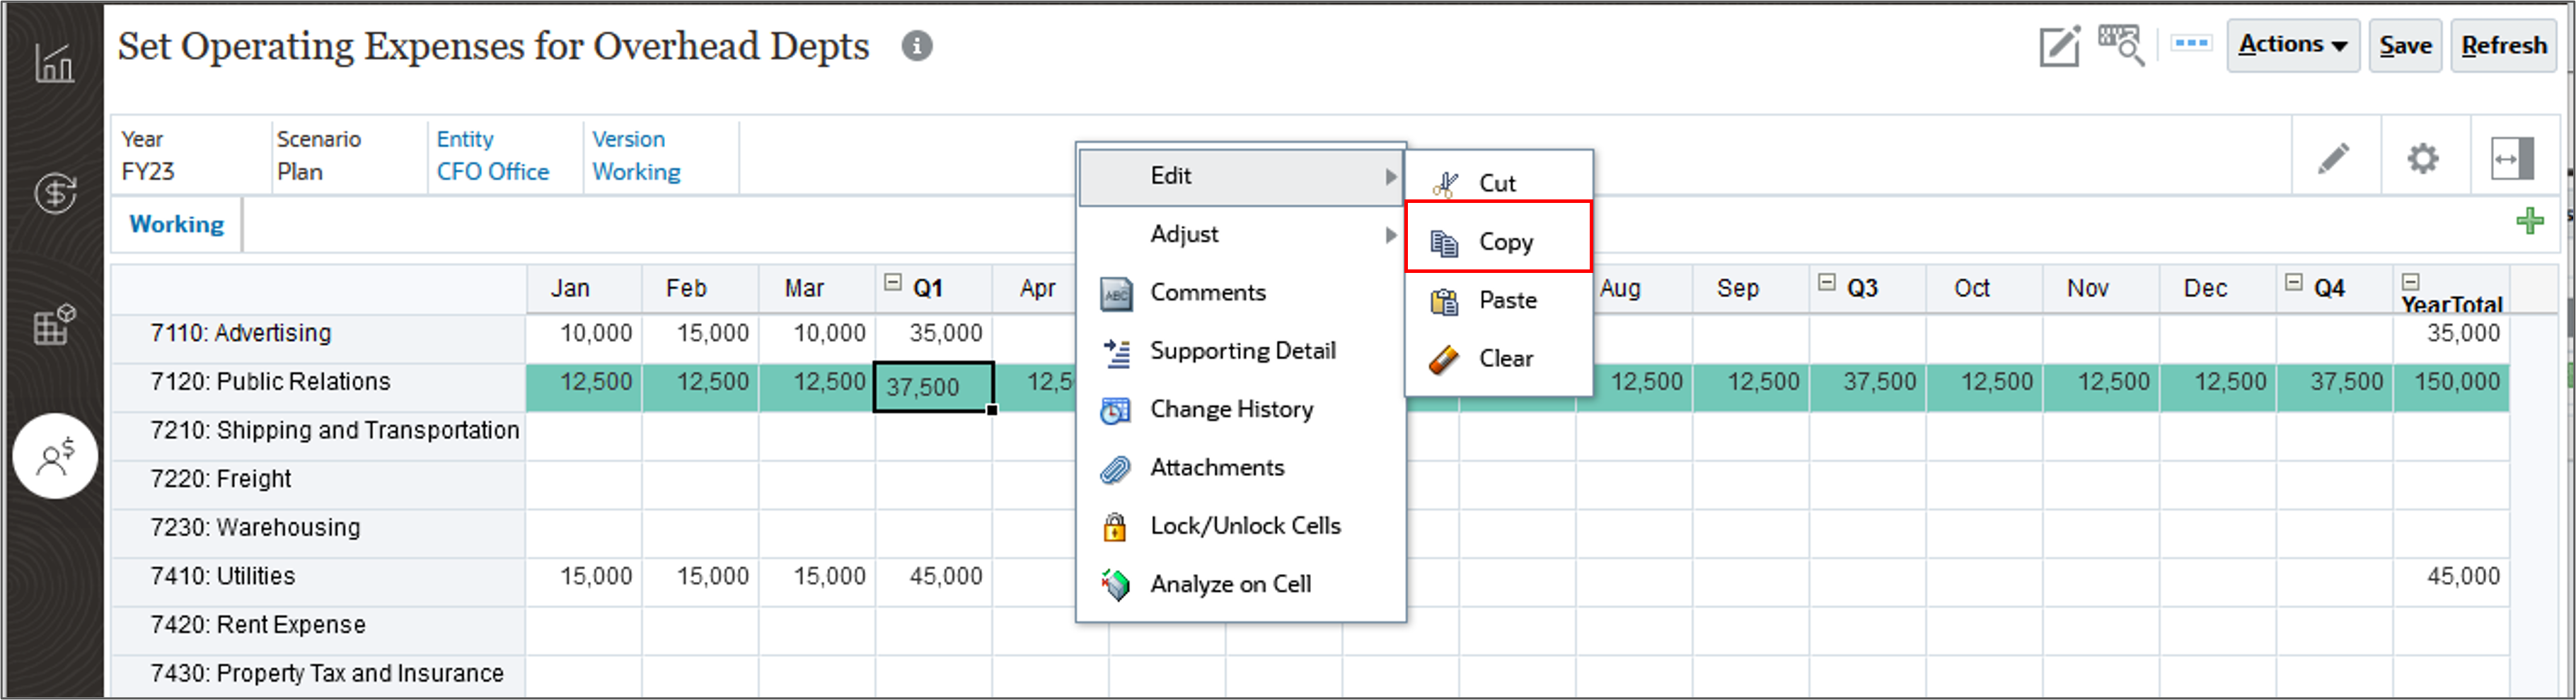
- Right click for the Actions menu, select Edit and then Copy.
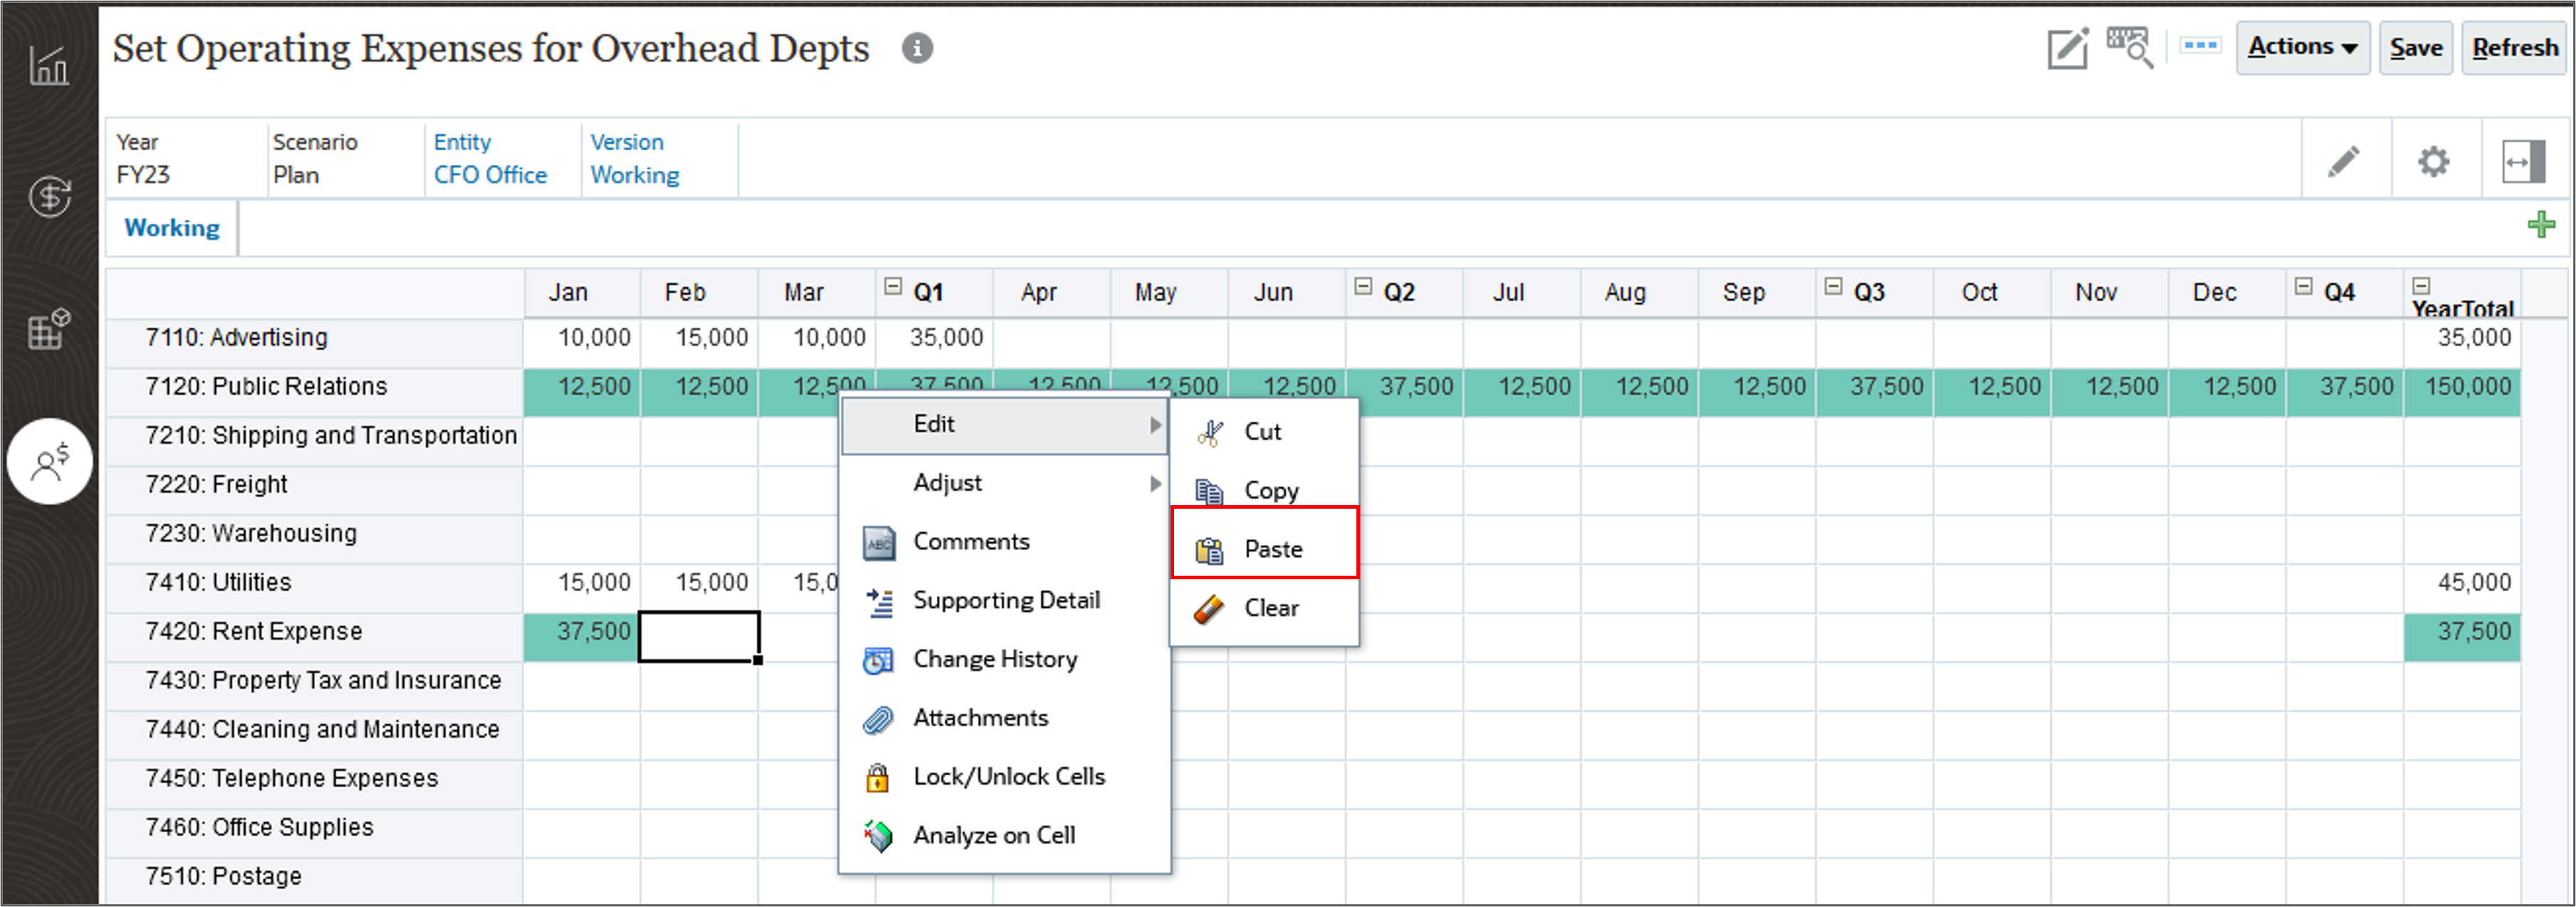
- Place your cursor in the Jan cell for Rent Expense, and right click for the Actions menu, select Edit and then Paste.
- Place your cursor in the Feb cell for Rent Expense, and right click for the Actions menu, select Edit and then Paste.
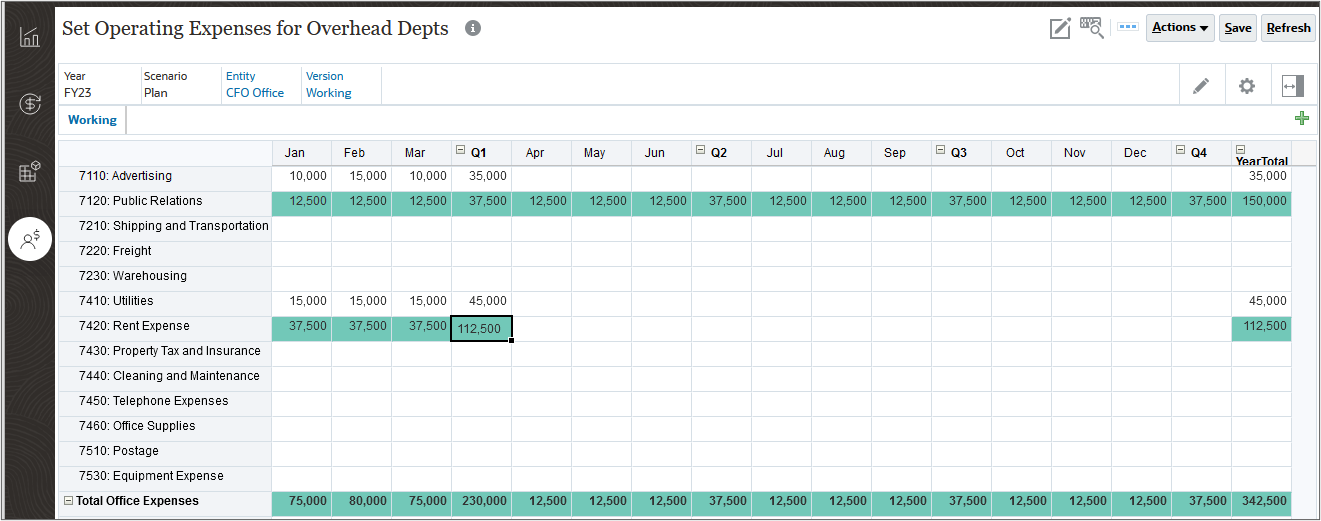
- Place your cursor in the Mar cell for Rent Expense, and right click for the Actions menu, select Edit and then Paste.
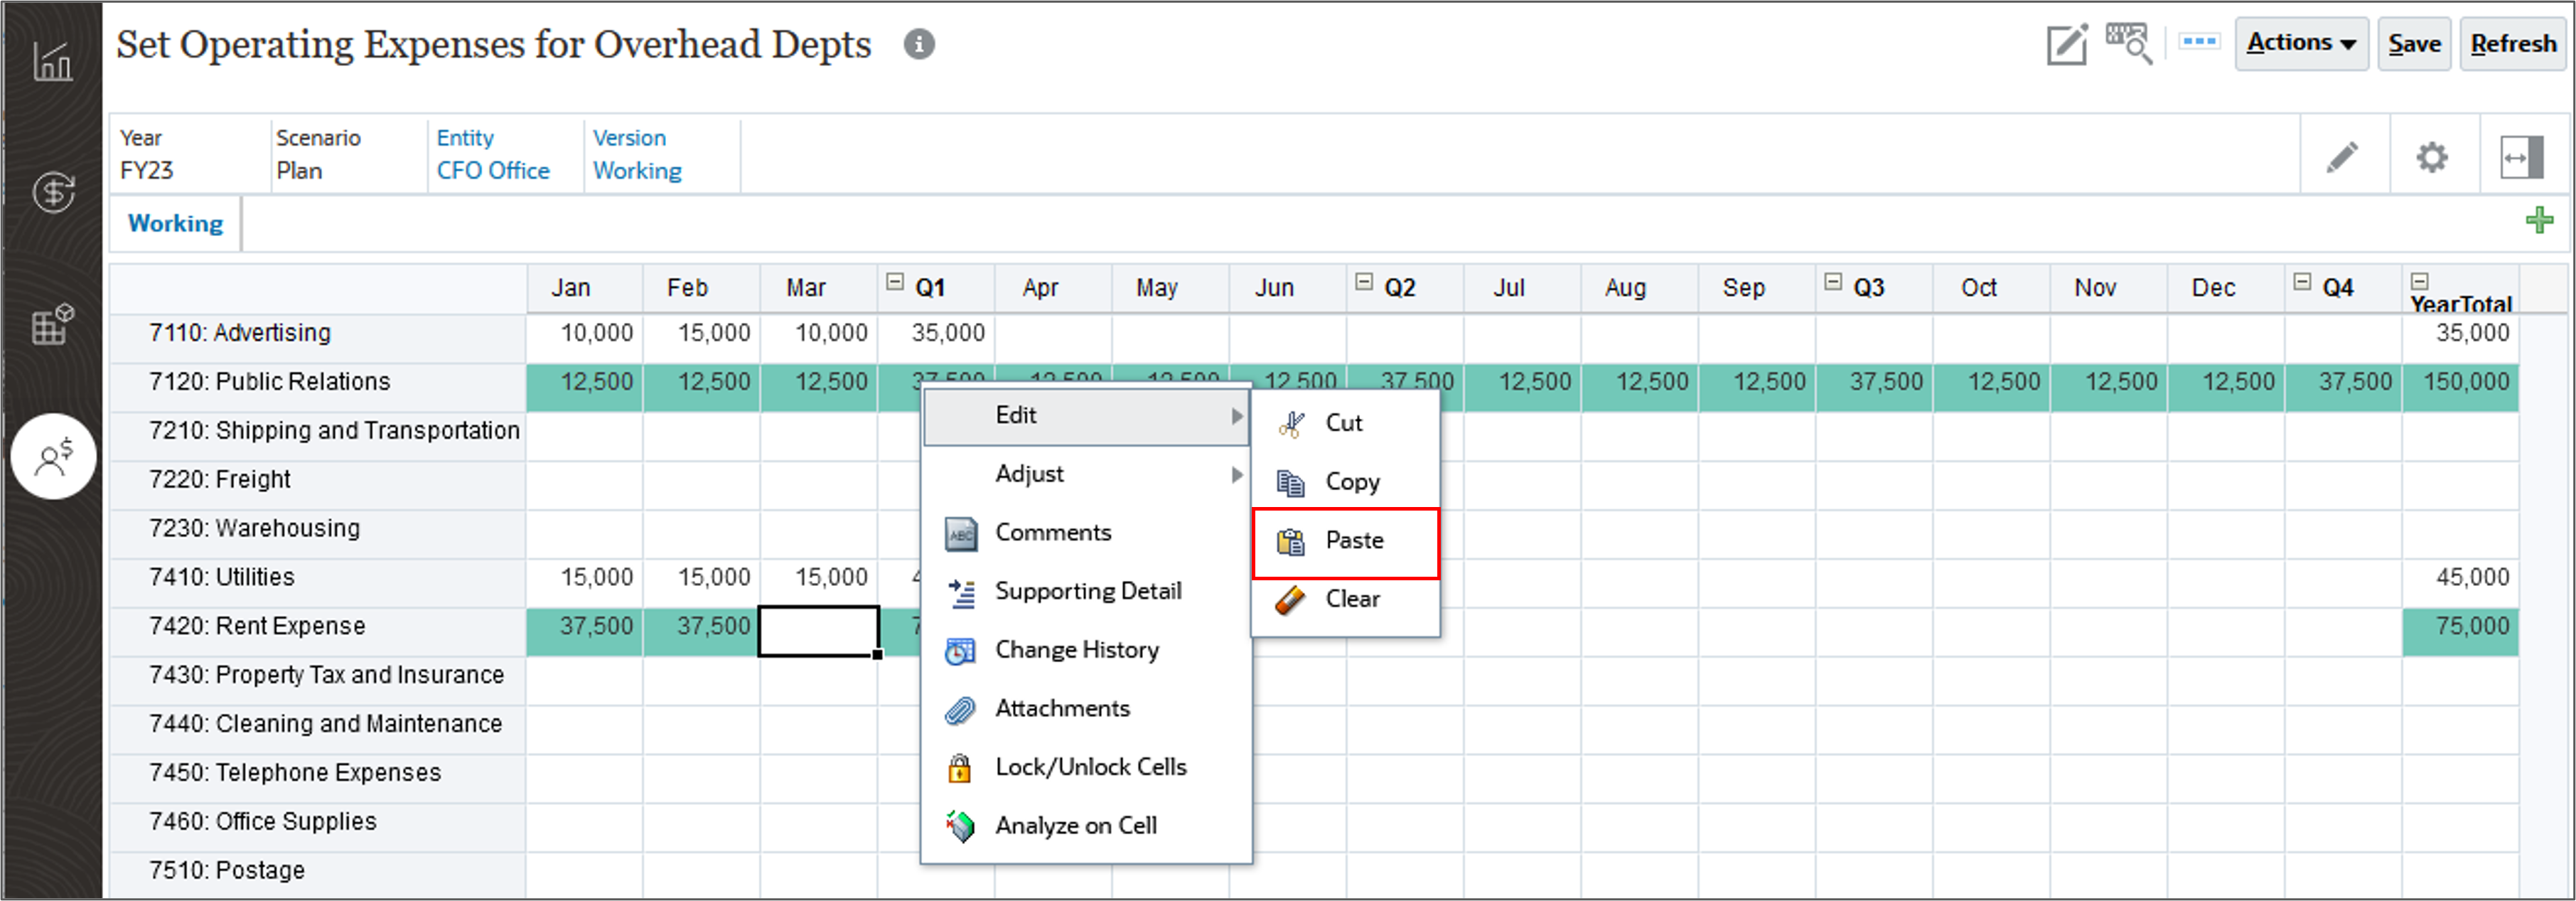
The data is copied to Rent Expense. Q1 for Rent Expense is updated and the data is automatically saved indicated by the green cells.
Adjusting Data by a Percentage in Planning
You can adjust data by a percentage or value. You can enter an Adjust by value and then select to either adjust by amount or percentage. Precede the value by a minus sign to decrease the value.
- After entering a value in Adjust By, for an amount click
 (Value).
 - After entering a value in Adjust By, for a Percent click
 (Percentage).
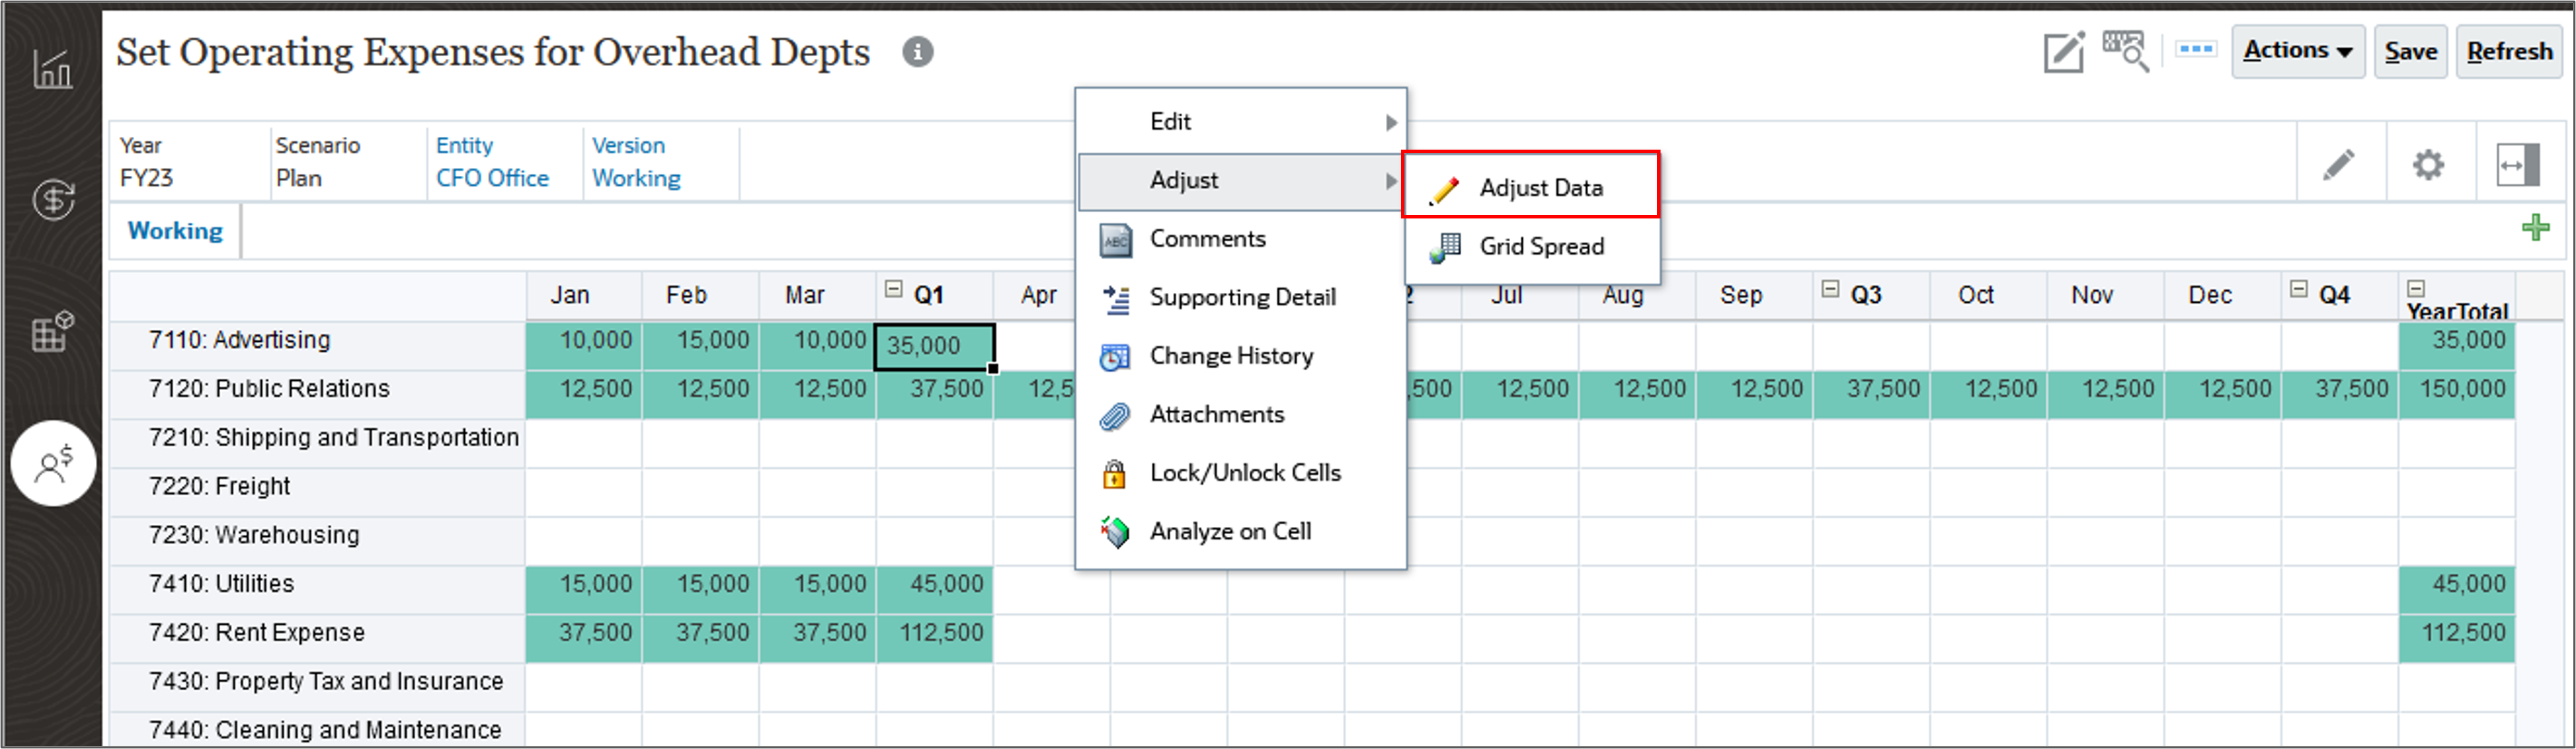
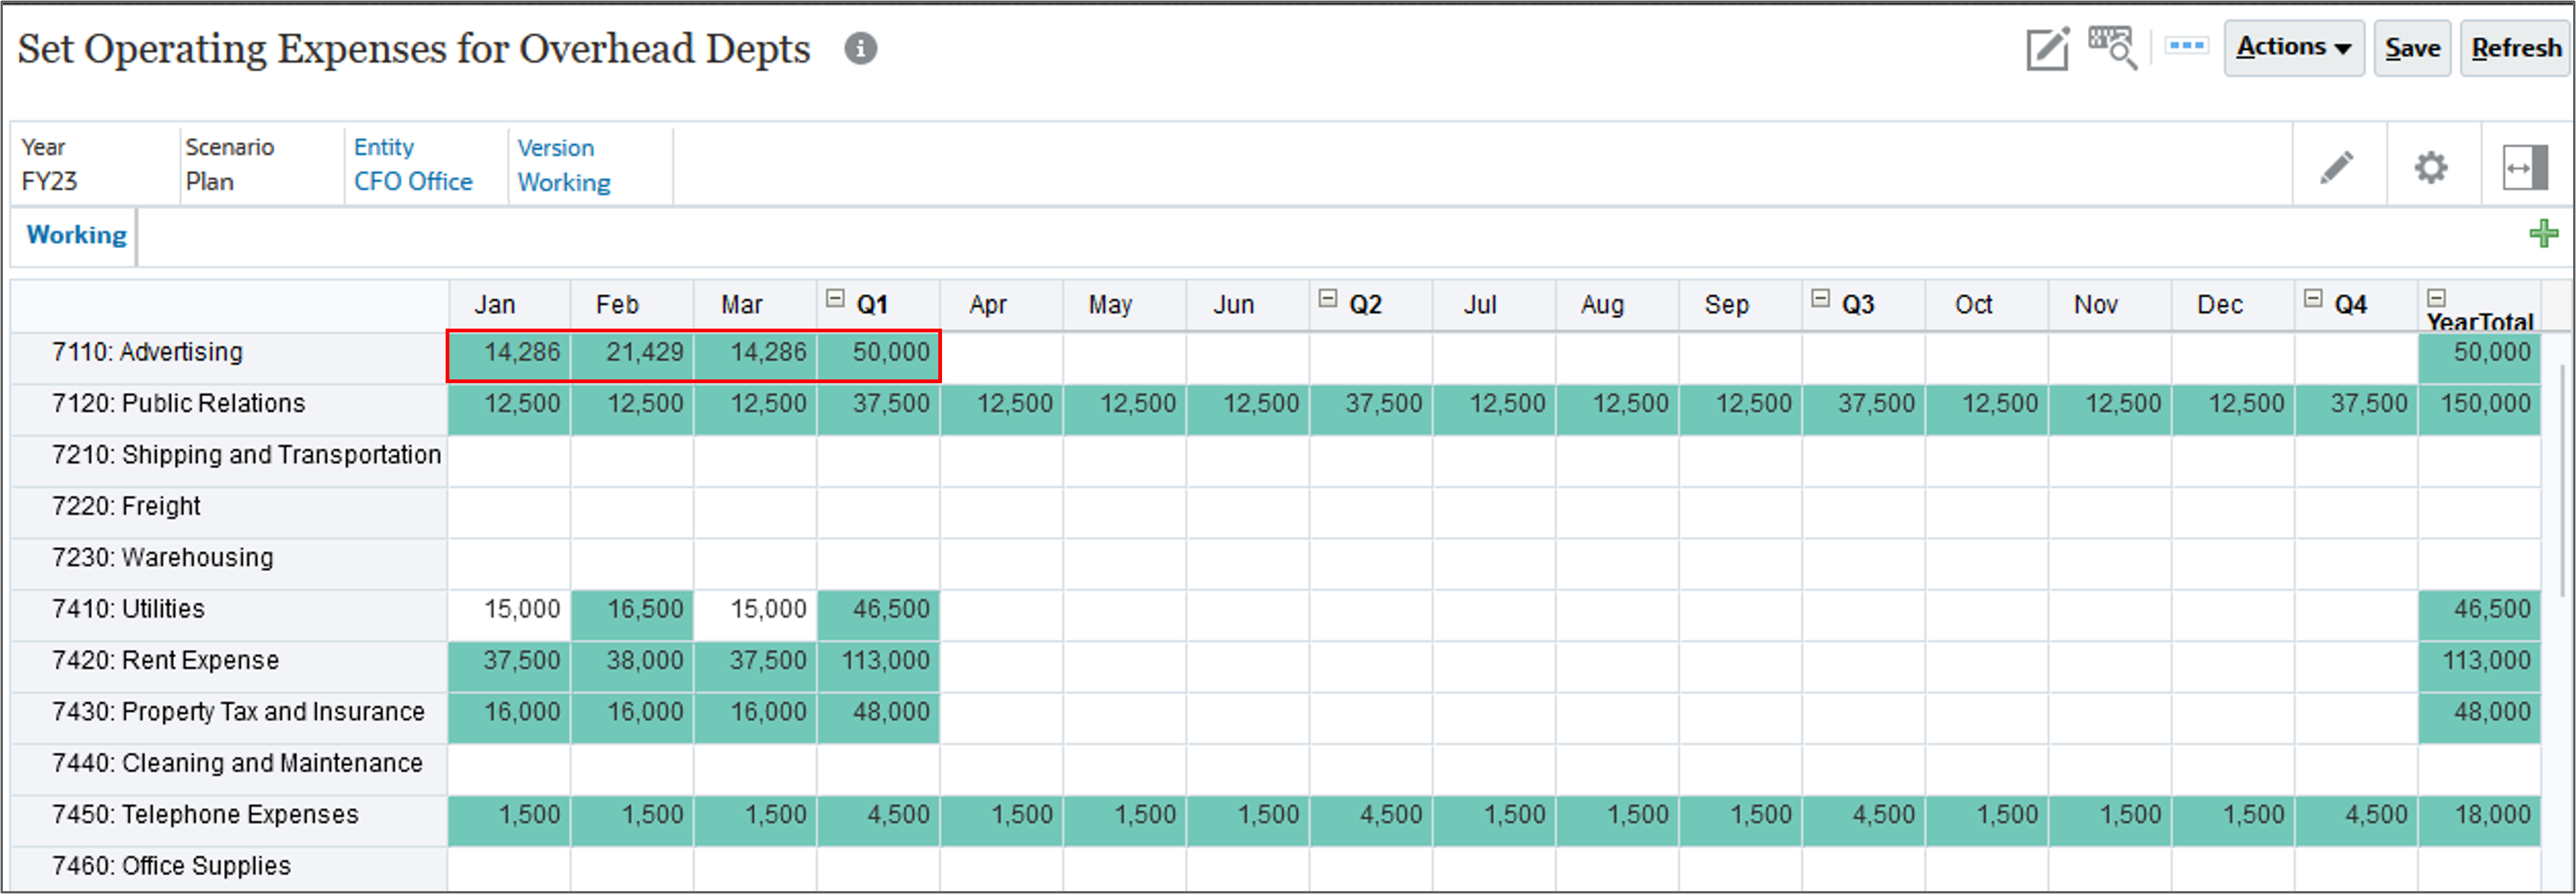
- On the Set Operating Expenses for Overhead Depts page, place your cursor in Q1 for Advertising, and right click for the Actions menu, select Adjust, and then Adjust Data.
- In Adjust By, enter 25, and click Percentage, and click Apply.
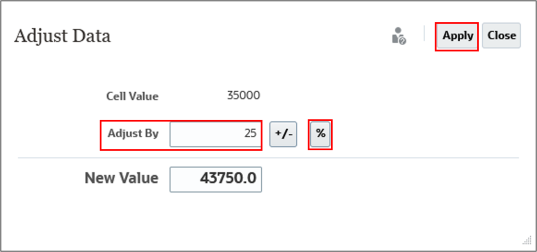
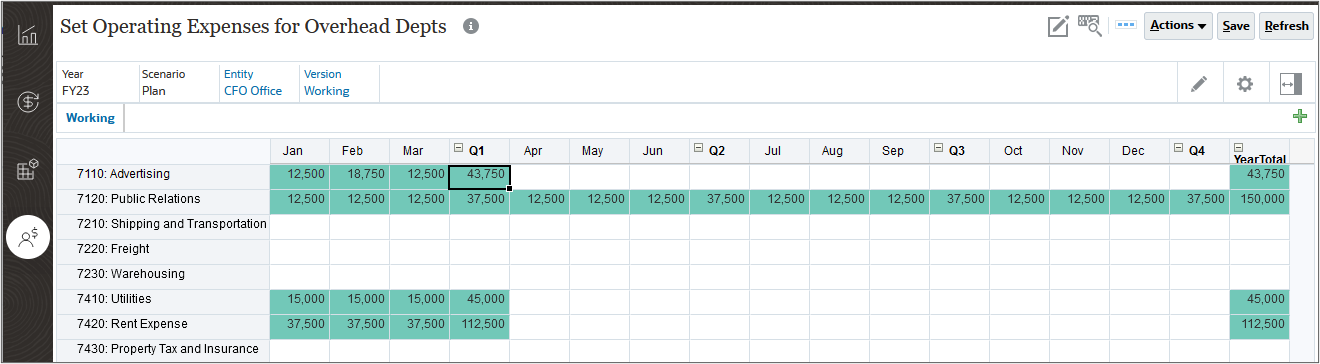
The value is adjusted, and the data is automatically saved.
Adjusting Data with Quick Commands in Planning
You can use these shortcuts in simple forms to enter data.
| Key or Symbol | Result | Example |
|---|---|---|
| K | Enters a value in thousands. | Enter 5K for 5,000. |
| M | Enters the value in millions. | Enter 5M for 5,000,000 |
| Add or + | Adds a number to the cell value. | If the cell value is 100, entering Add10 after 100 results in 110. |
| Sub or ~ | Subtracts a number from the cell value. | If the cell value is 100, entering Sub10 after 100 results in 90.. |
| Percent or per | Multiplies the cell value by the percentage you enter. | If the cell value is 100, entering per10 after 100 results in 10% of the current cell value, or 10.. |
| Increase or inc | Increases the cell value by the percentage you enter. | If the cell value is 200, entering inc10 after 200 increases the cell value by 10%. |
| Decrease or dec | Decreases the cell value by the percentage you enter. | If the cell value is 200, entering dec10 after 200 decreases the cell value by 10% or 200 (20), to 180. |
| Power or pow | Changes the cell value to the number, added as an exponent. | If the cell value is 100, entering pow2 after 100 multiplies the cell value by an exponent of 2, to 10,000. |
| gr | Grows a cell by a percentage. | If the cell value is 200, entering gr50 after 200 increases the cell value by 100, to 300.. |
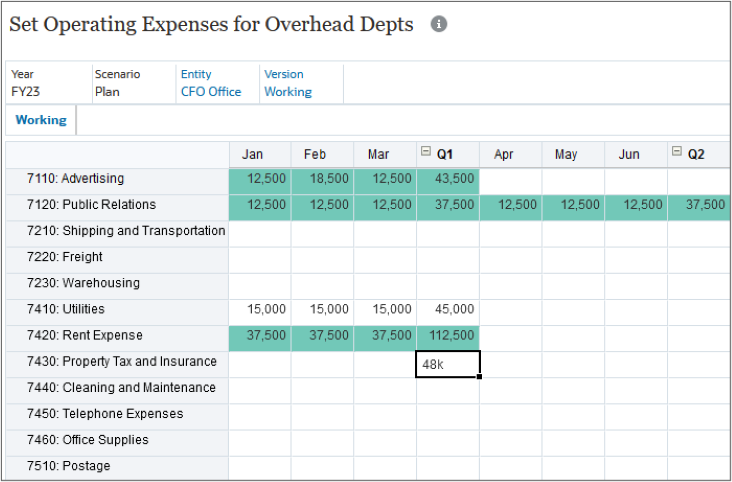
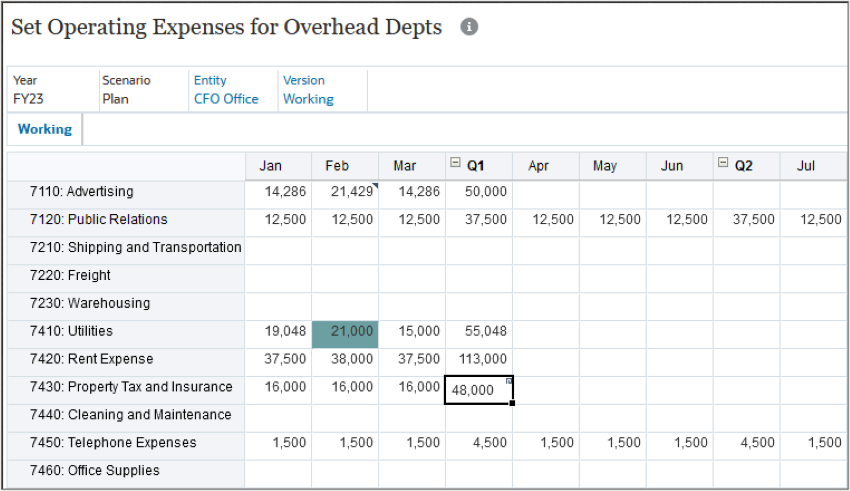
- On the Set Operating Expenses for Overhead Depts page, place your cursor in Q1 for Property Tax and Insurance, and enter 48k.
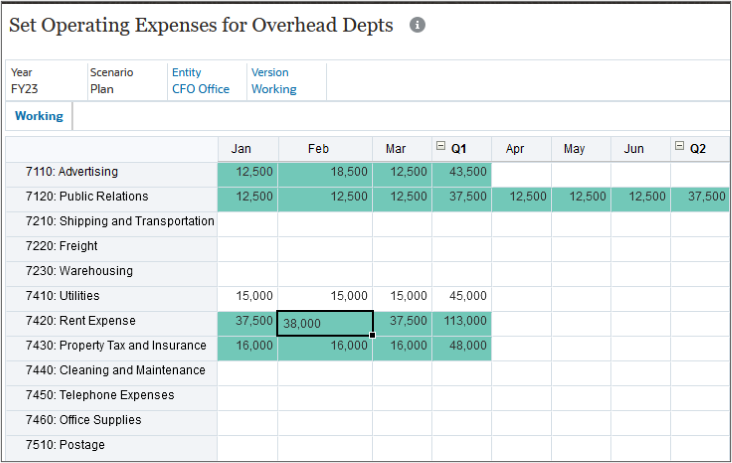
- For Rent, place your cursor in Feb, and type 37500Add500.
- After typing the command, enter it.
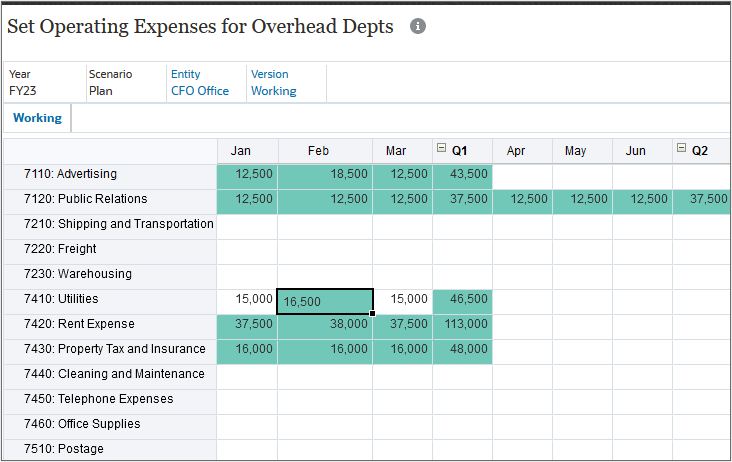
- For Utilities place your cursor in Feb, and type 15000Per110.
- After typing the command, enter it.
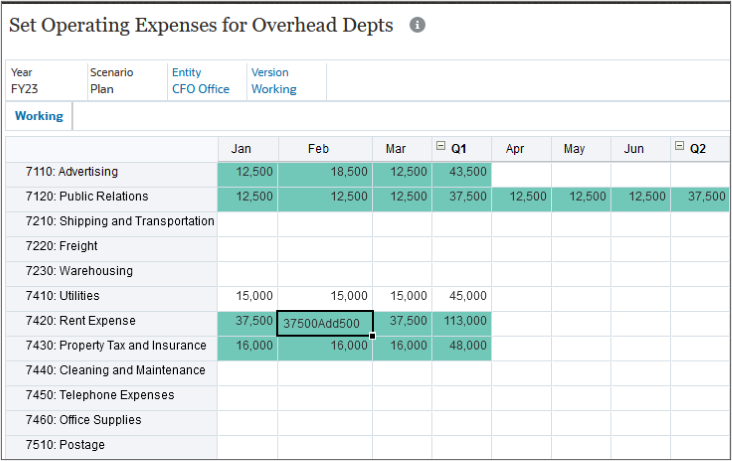
The value is adjusted. It is increased by five hundred.
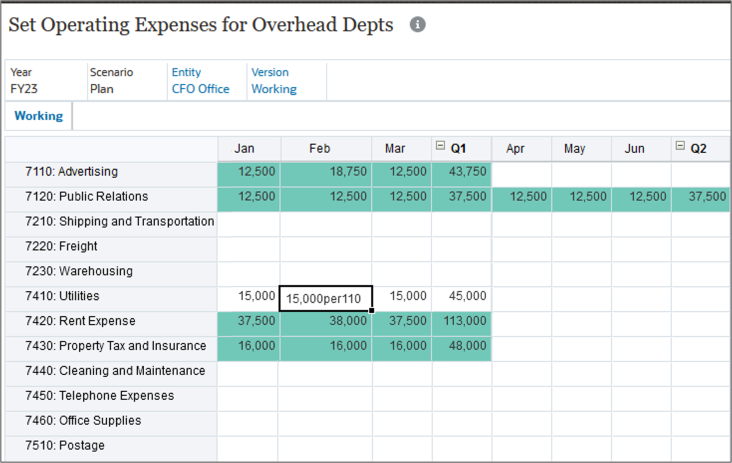
The value is adjusted. It is increased by ten percent.
Spreading Data in Planning
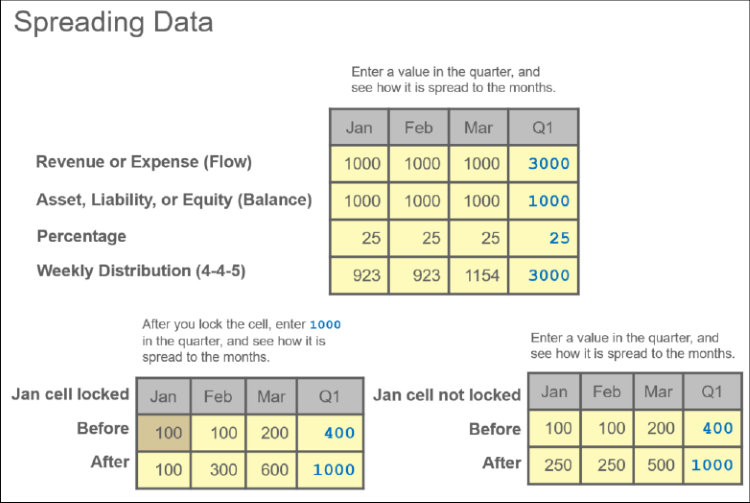
In this section, you spread data from summary time periods to base time periods. Planning automatically distributes values from summary periods to base periods. Base periods are the bottom-level members of the Period dimension.
Note:
Date and text values are excluded when spreading data.Reviewing the Impact of Account Type and Data Type on Spreading Data in Planning
Factors such as account type, the Time Balance property, existing distribution, member hierarchies, and data type affect how values are distributed, assuming that no data cells are locked.
Spreading data is depicted in the following illustration:
Spreading Expense Data in Planning
- On the Set Operating Expenses for Overhead Depts page, ensure the POV is FY23, Plan, CFO Office and Working, and for Telephone Expenses, in YearTotal, enter 18k.
- For Advertising, in YearTotal, enter 50k.
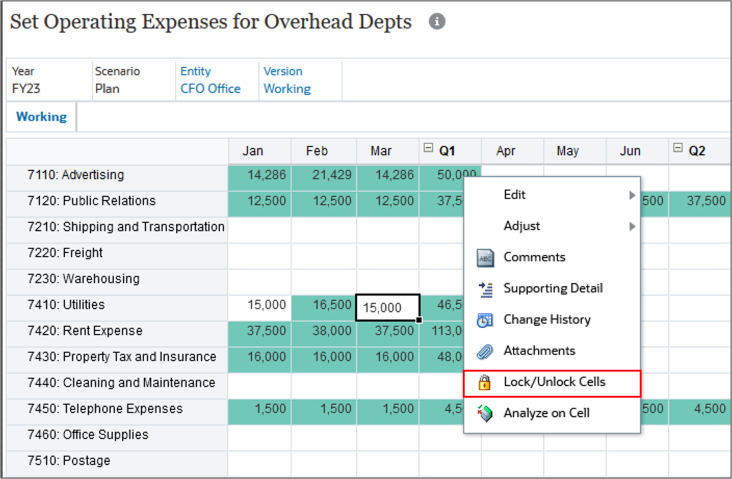
- For Utilities, right-click in the Mar cell and select Lock/Unlock Cells.
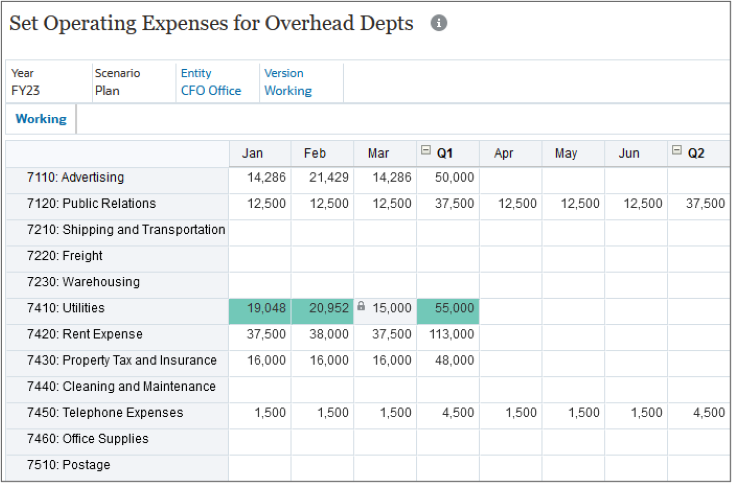
- For Utilities, in Q1, enter 55k.
- Click
 (Home).
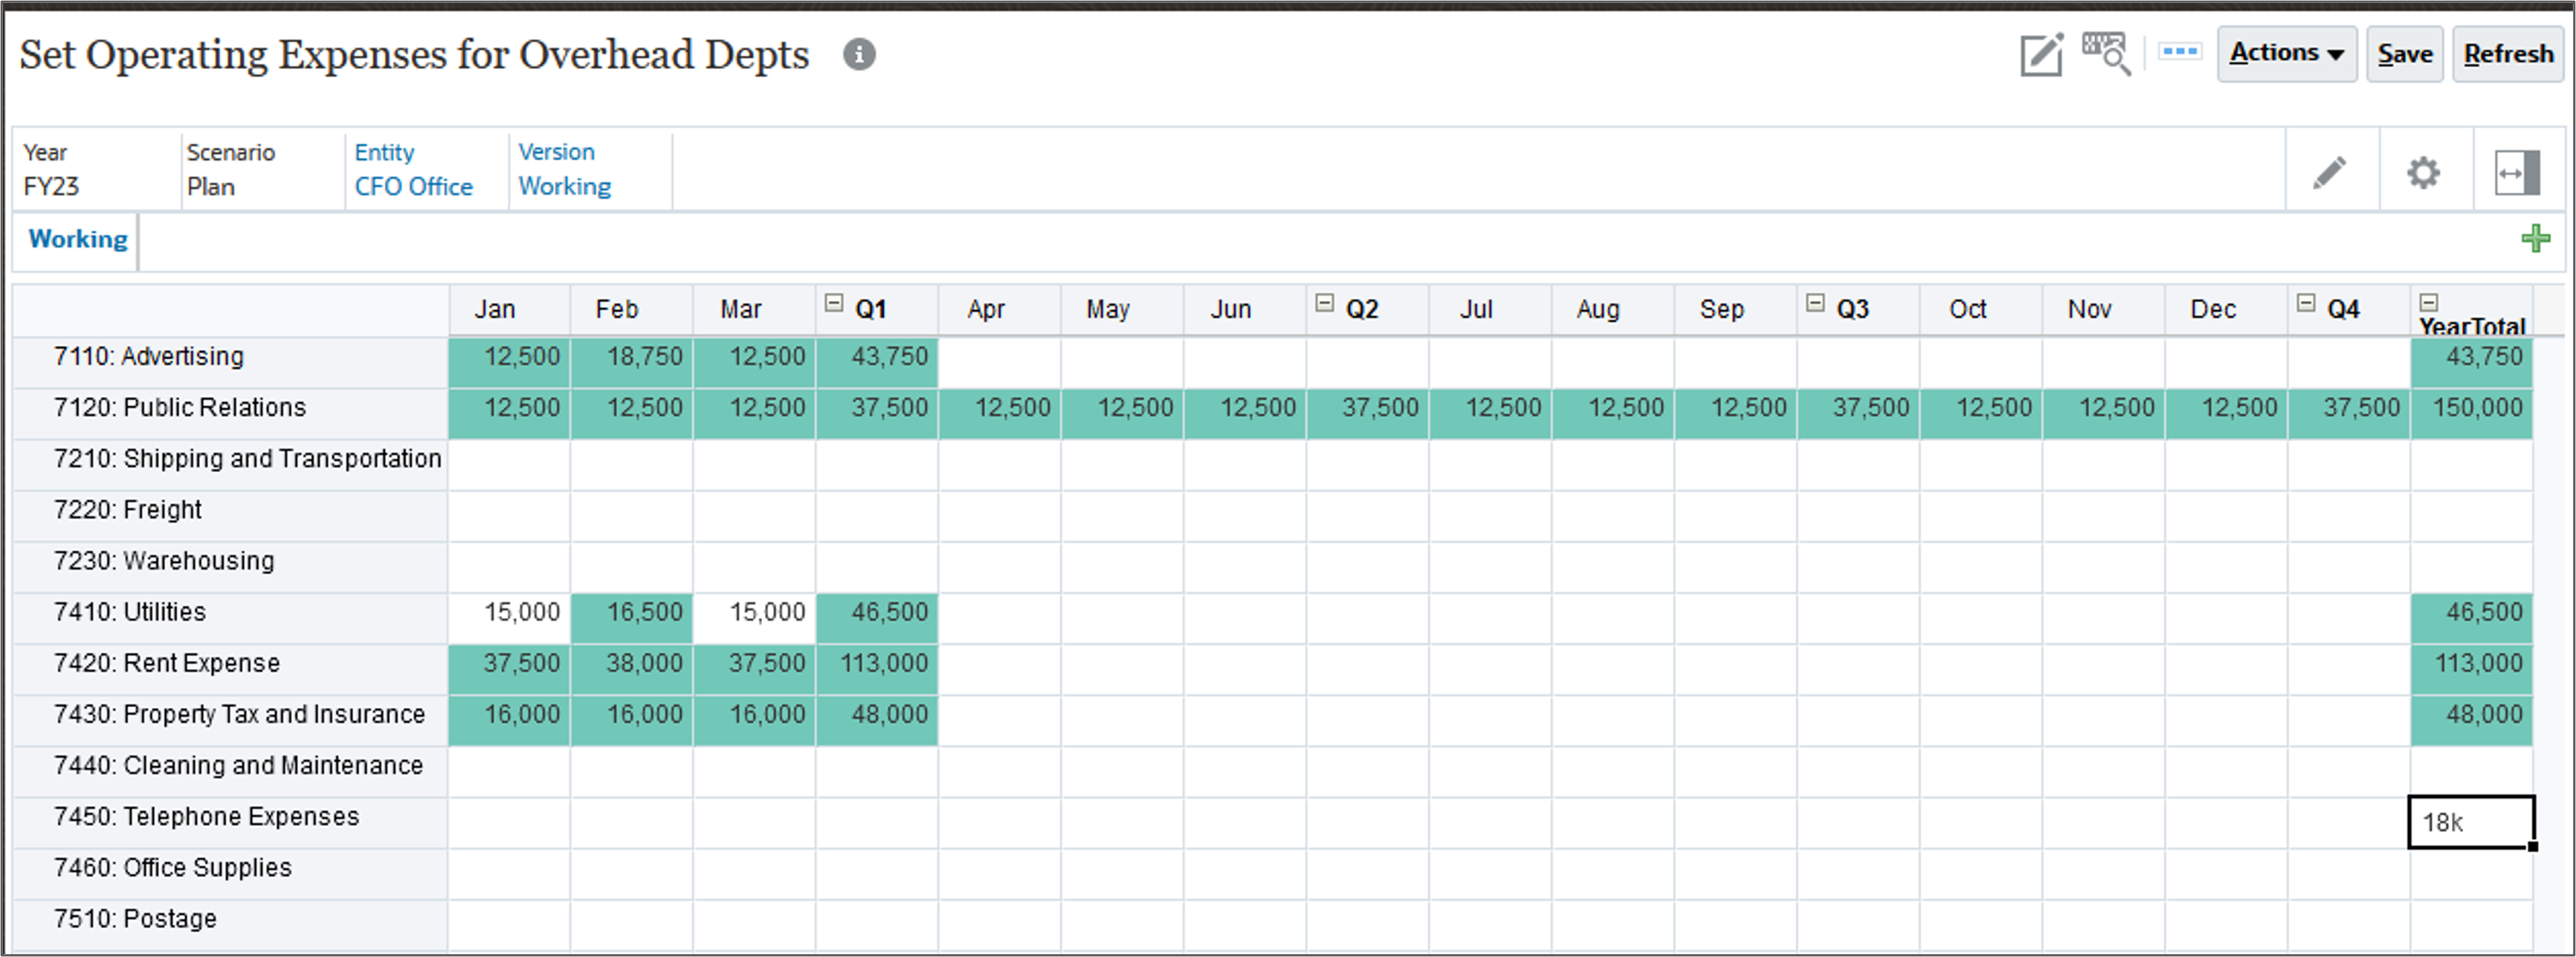
Because there were no values in Telephone Expenses, the value was spread evenly to all time periods.
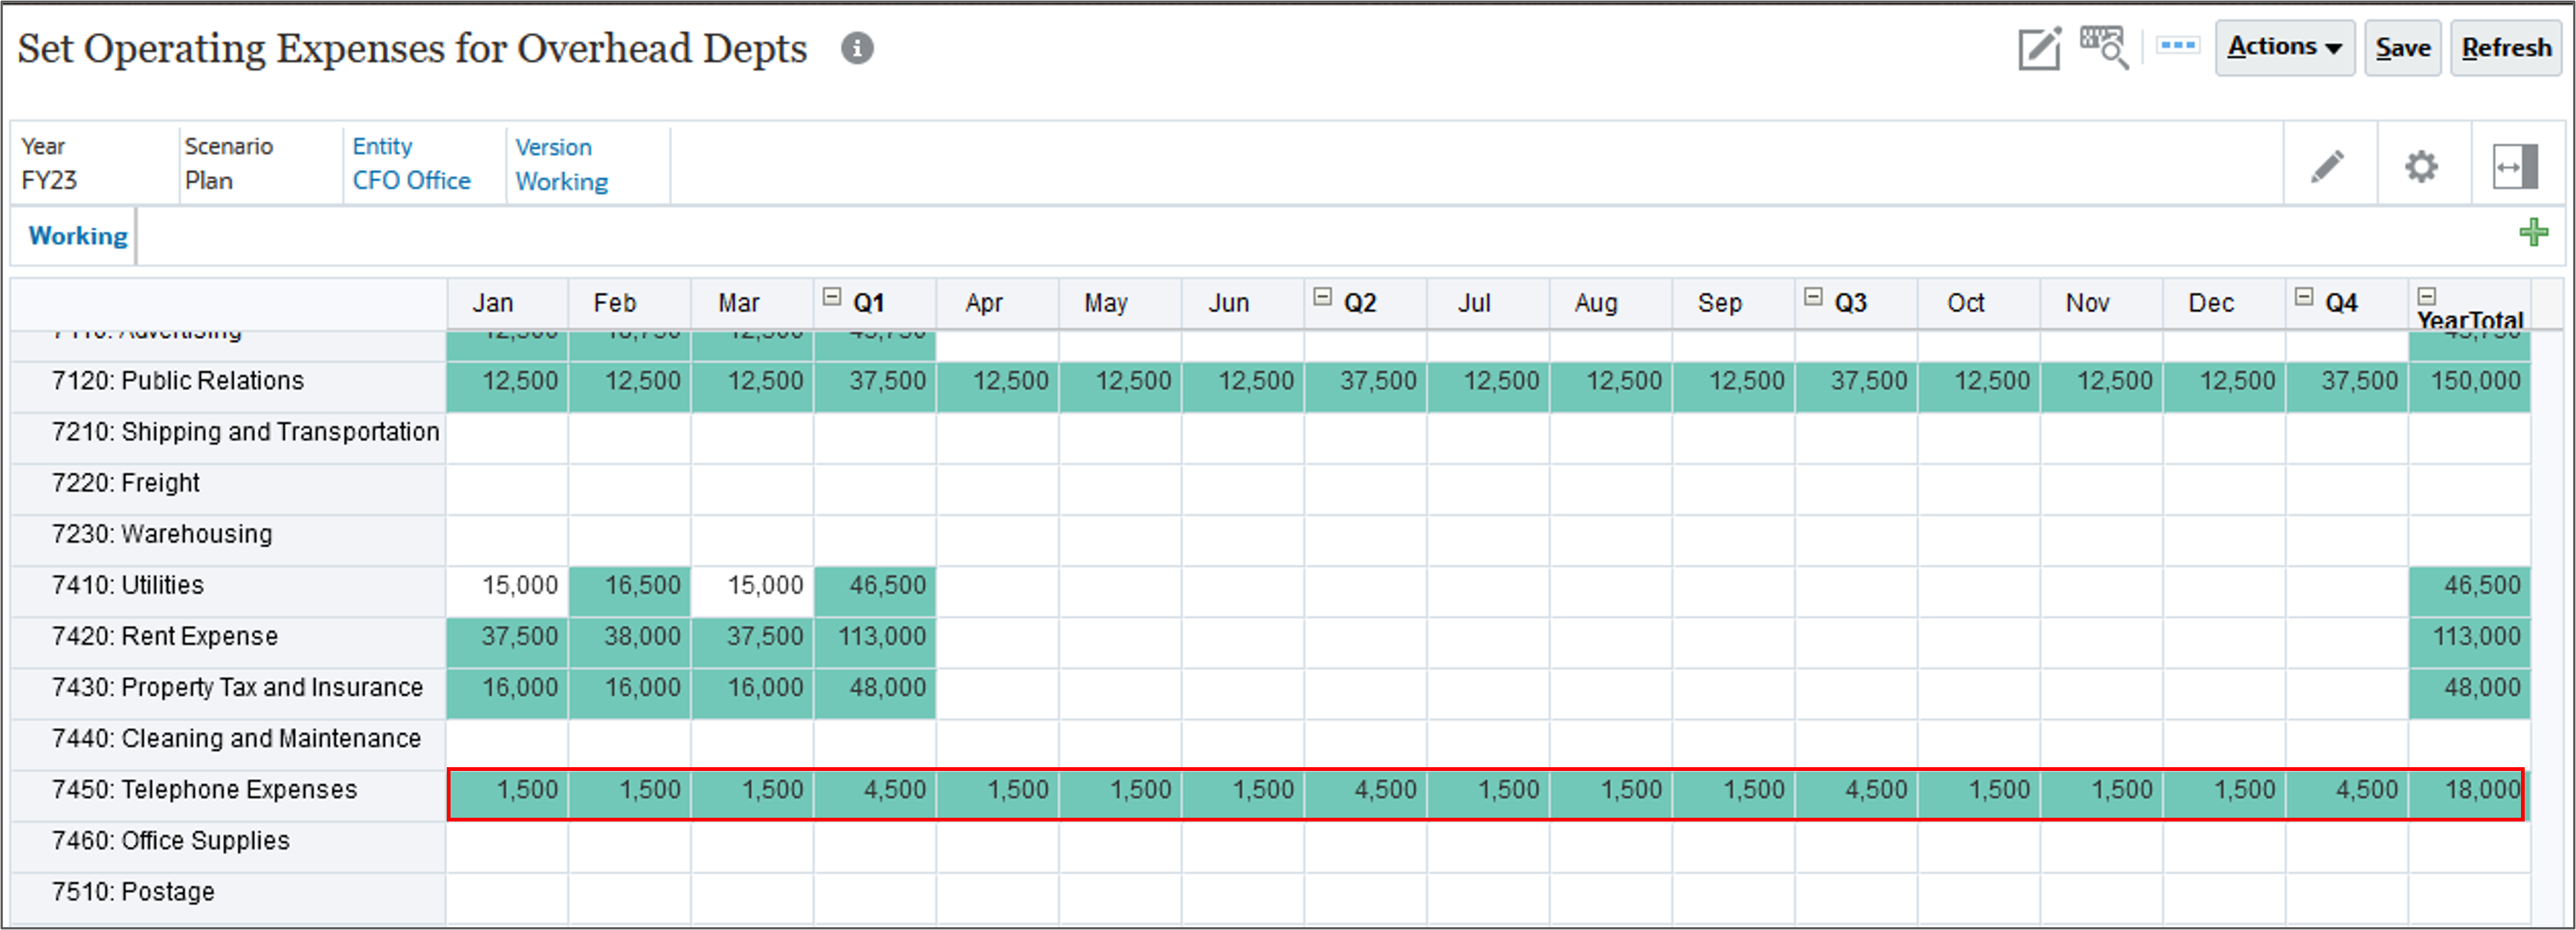
Because there were already some values for the first quarter, the values were spread proportionally.
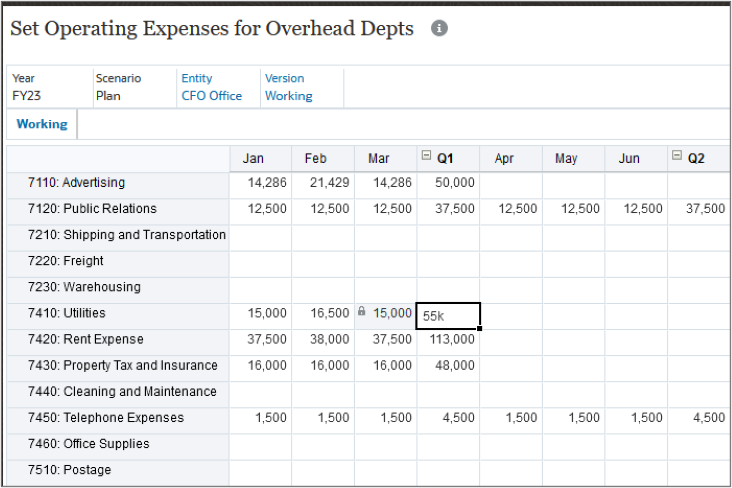
Because March was locked, the change in the Q1 value was spread to January and February proportionally.
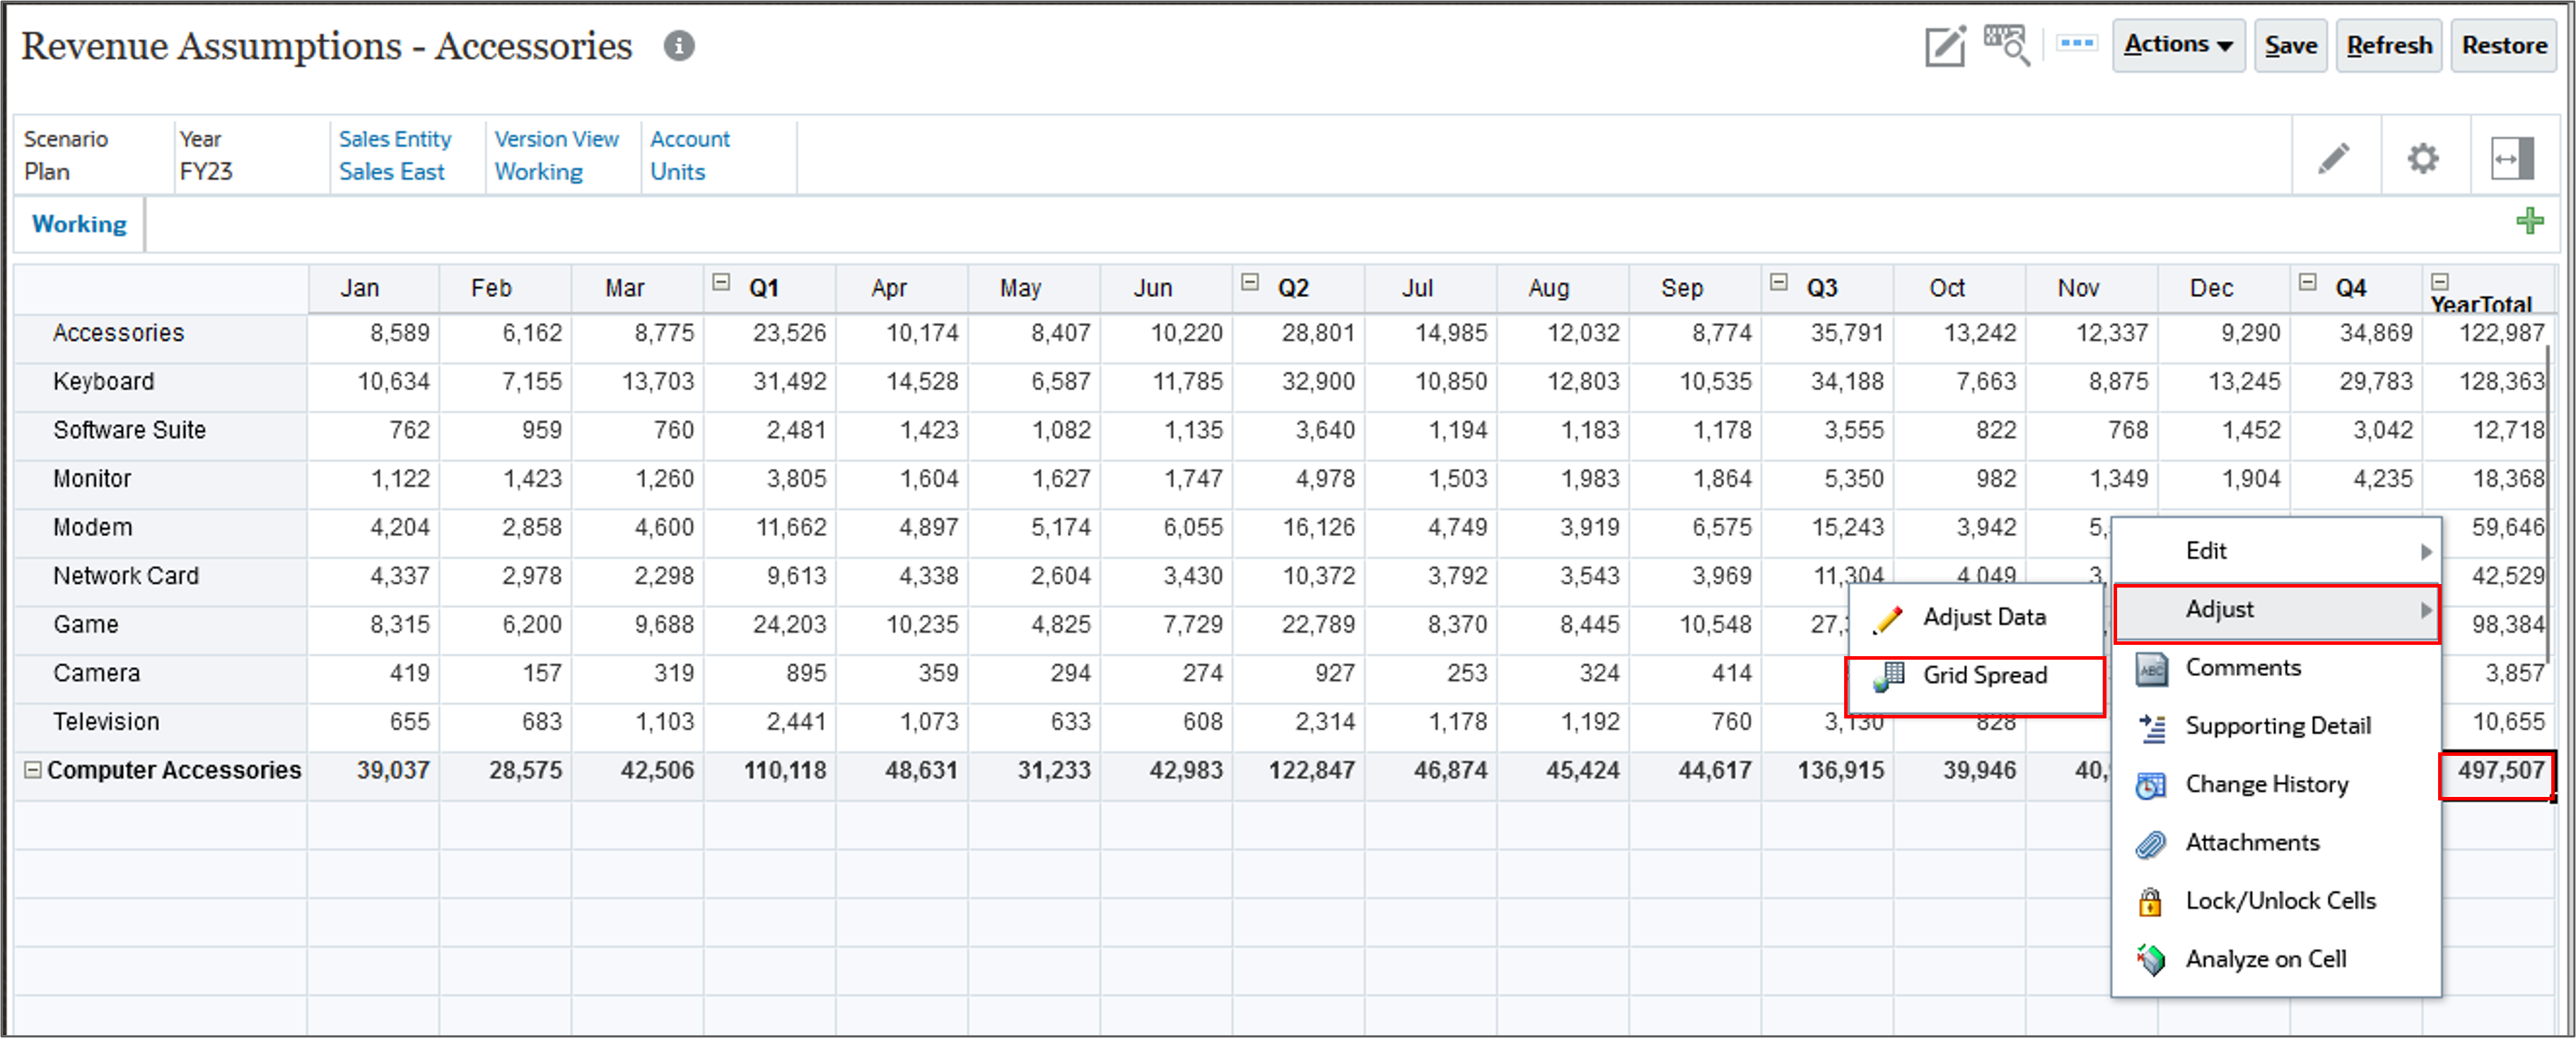
Spreading Data with Grid Spread in Planning
If your administrator has enabled Grid Spread as a form property, you can specify an amount or percentage by which values across multiple dimensions on the form are increased or decreased, based on the existing values in the target cells. Precede the value by a minus sign to decrease the value.
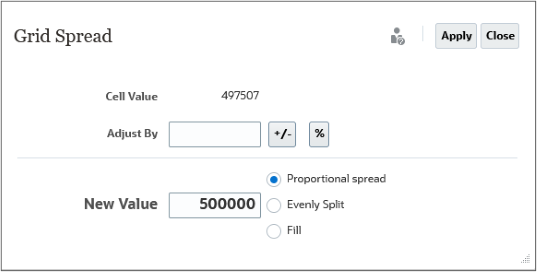
You can also, set a new value. When you set a new value, select a spread option:
- Proportional spread: Spreads the value proportionally, based on the existing values in the target cells (default).
- Evenly Split: Spreads the value evenly among the target cells.
- Fill: Replaces the value in all target cells.
You immediately see the result in the form. If the form is not set up to save automatically then you can save the new data or discard it. When calculating the spread data, Planning ignores read-only and locked cells and cells that have Supporting Detail. Data integrity is ensured by spreading values only to cells you have write permission to.
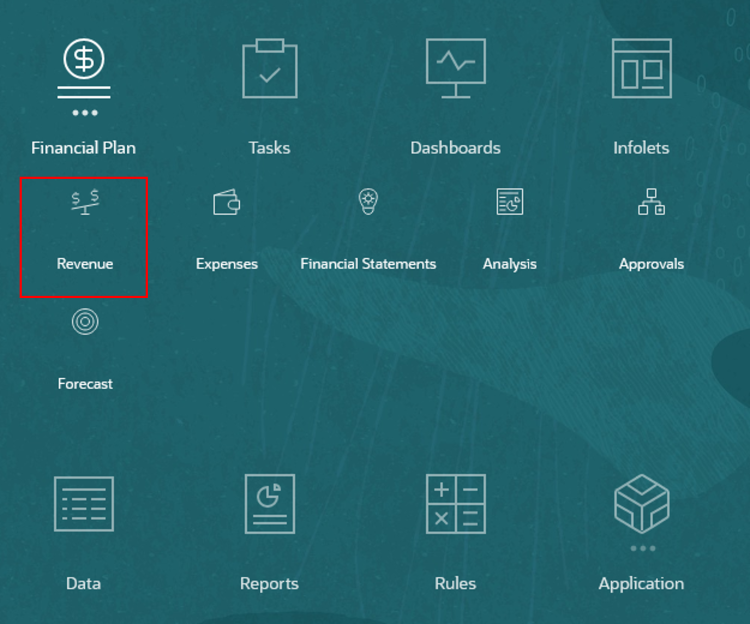
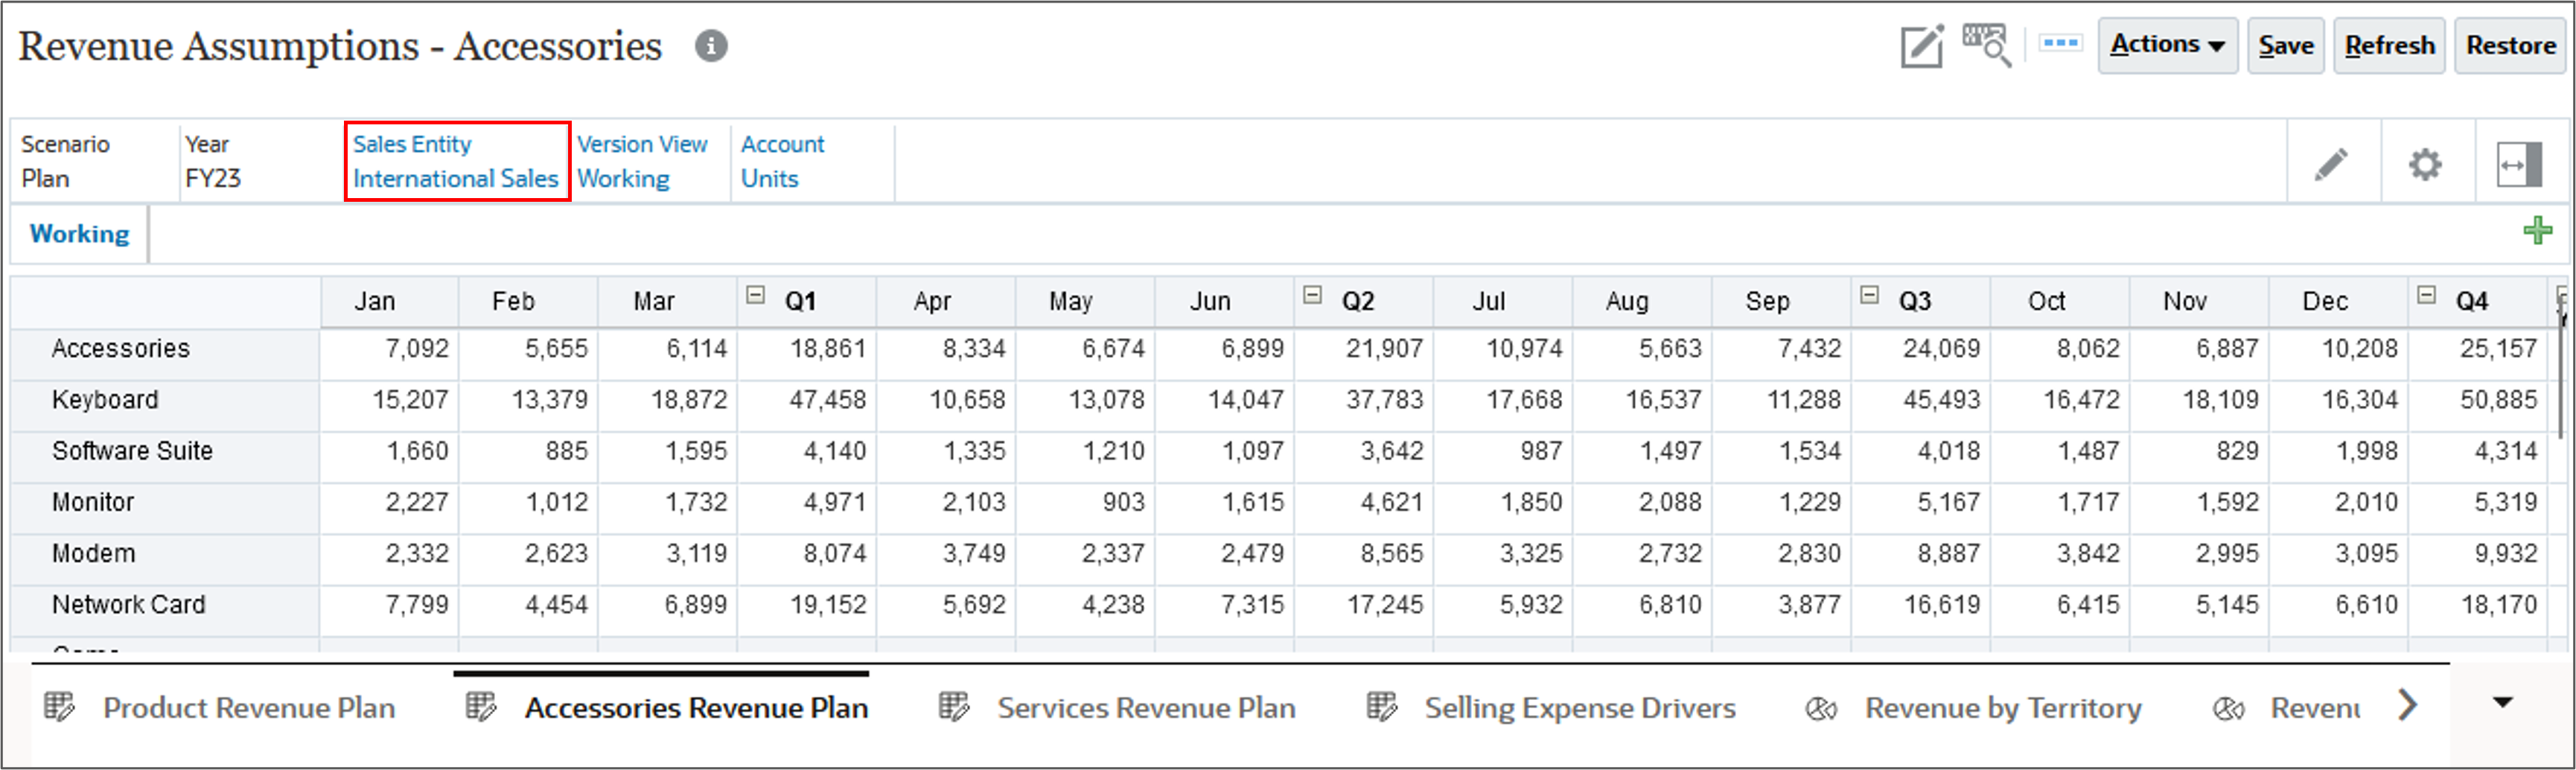
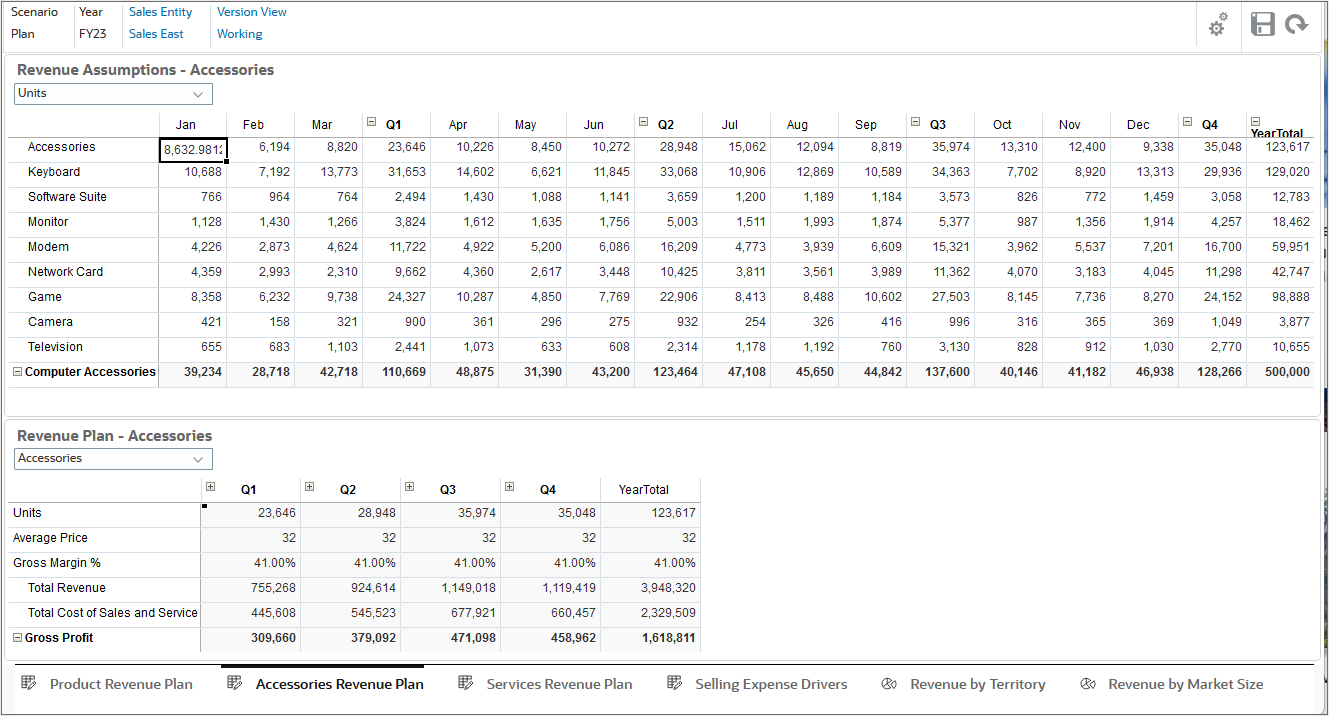
- From the Home page, click Financial Plan and then Revenue.
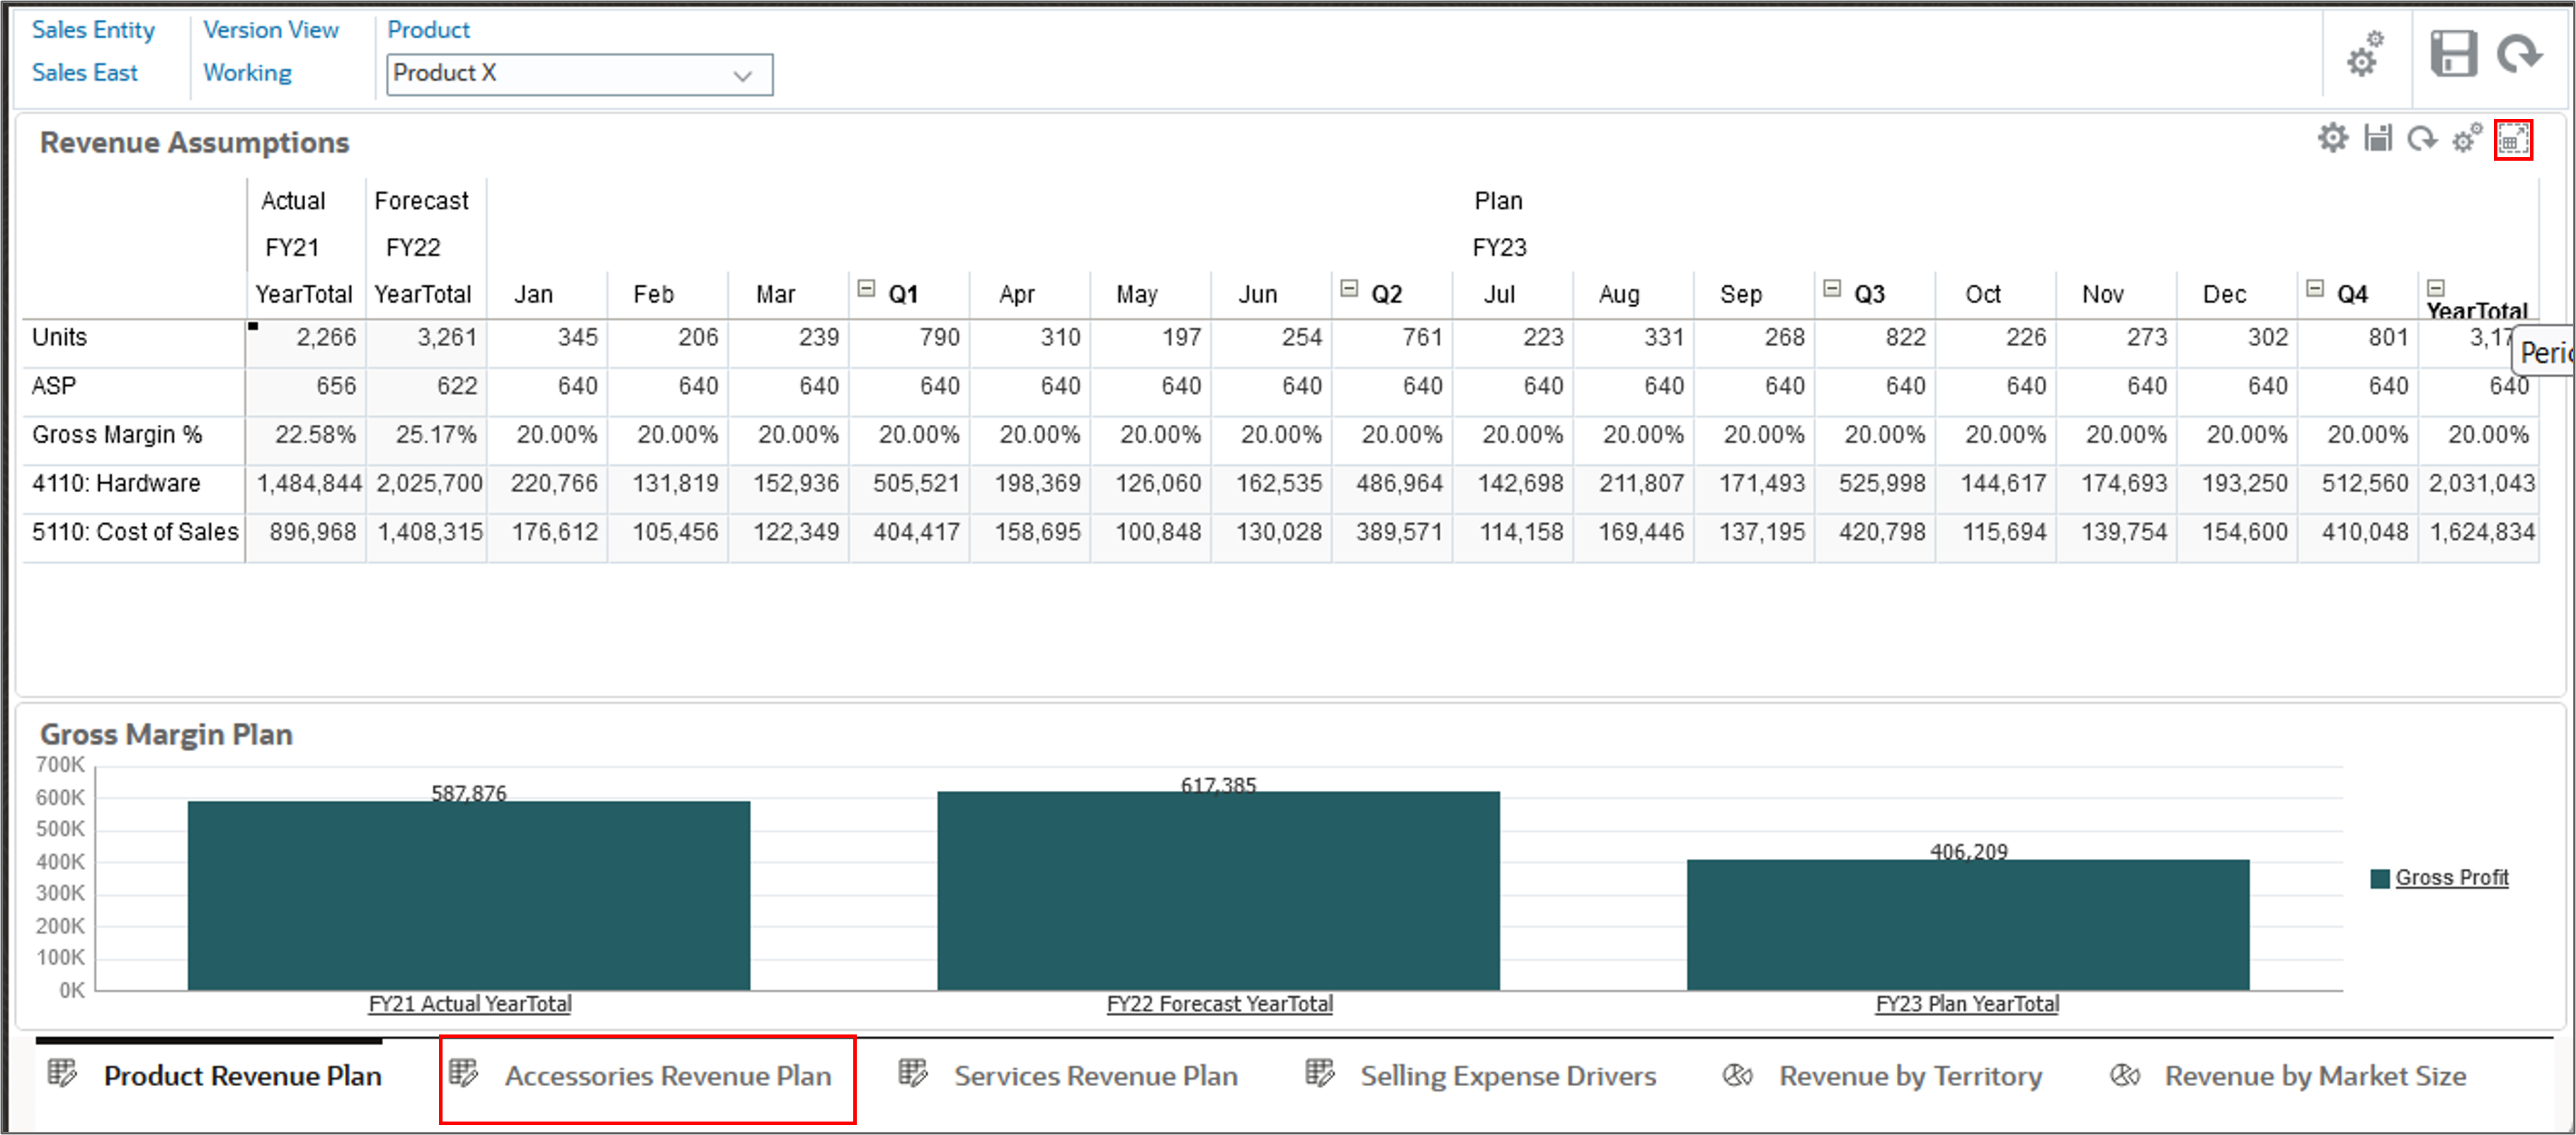
- Select the second horizontal tab – Accessories Revenue Plan.
- In the upper right of the top grid, click
 (Maximize).
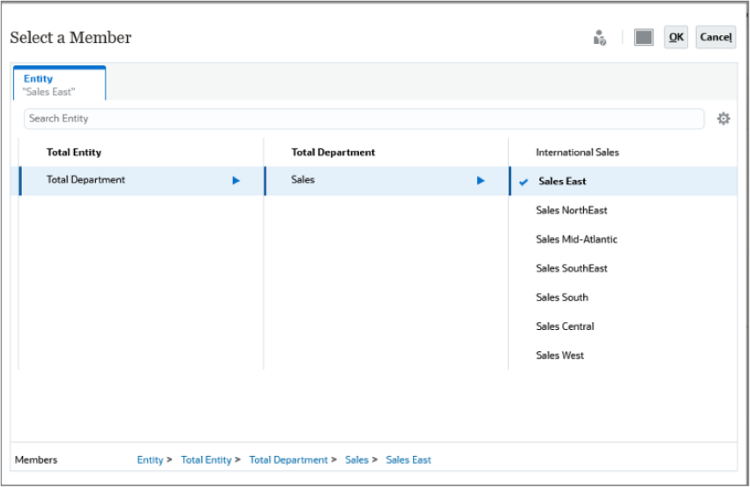
 - Click Sales Entity.
- Select Sales East and click OK.
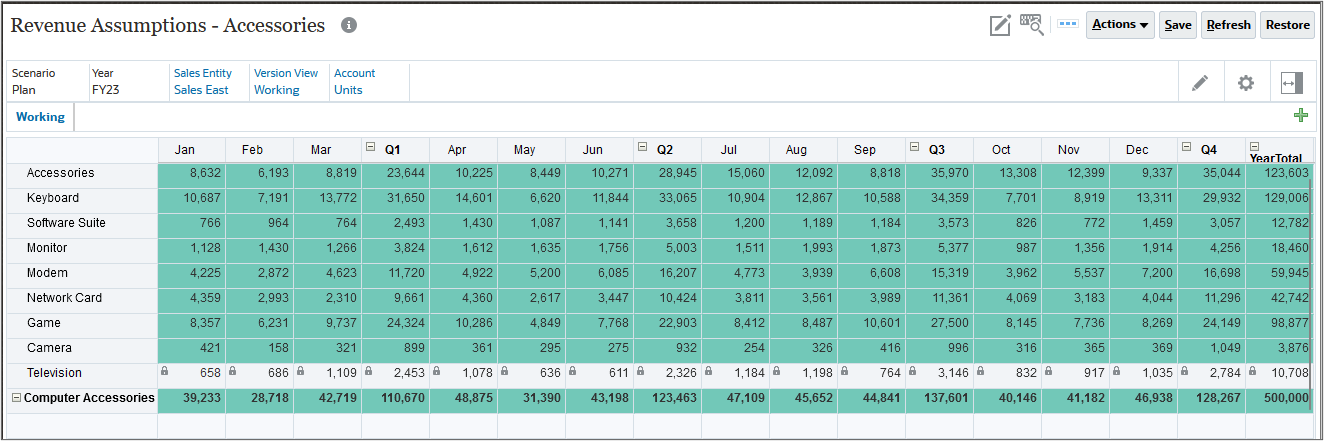
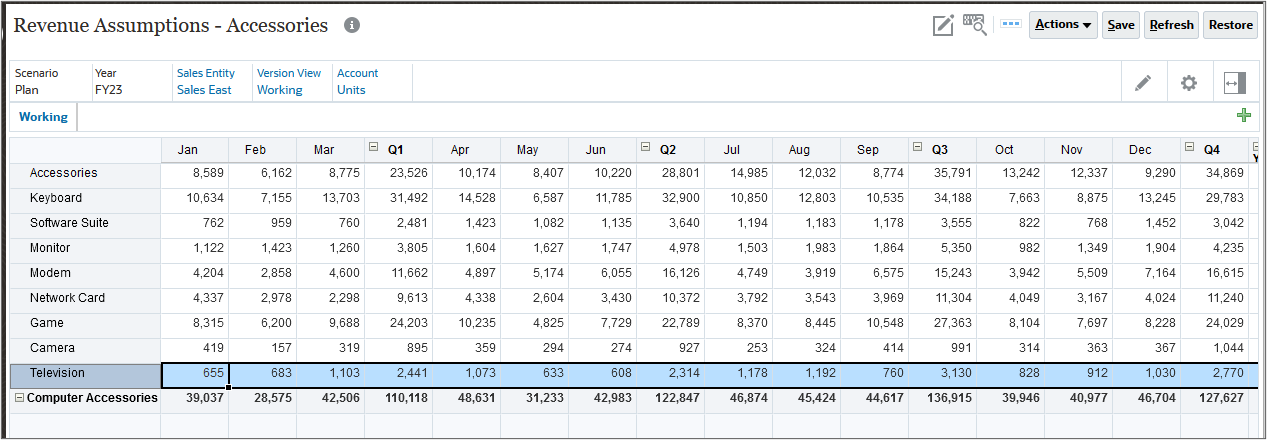
- Select the Television row.
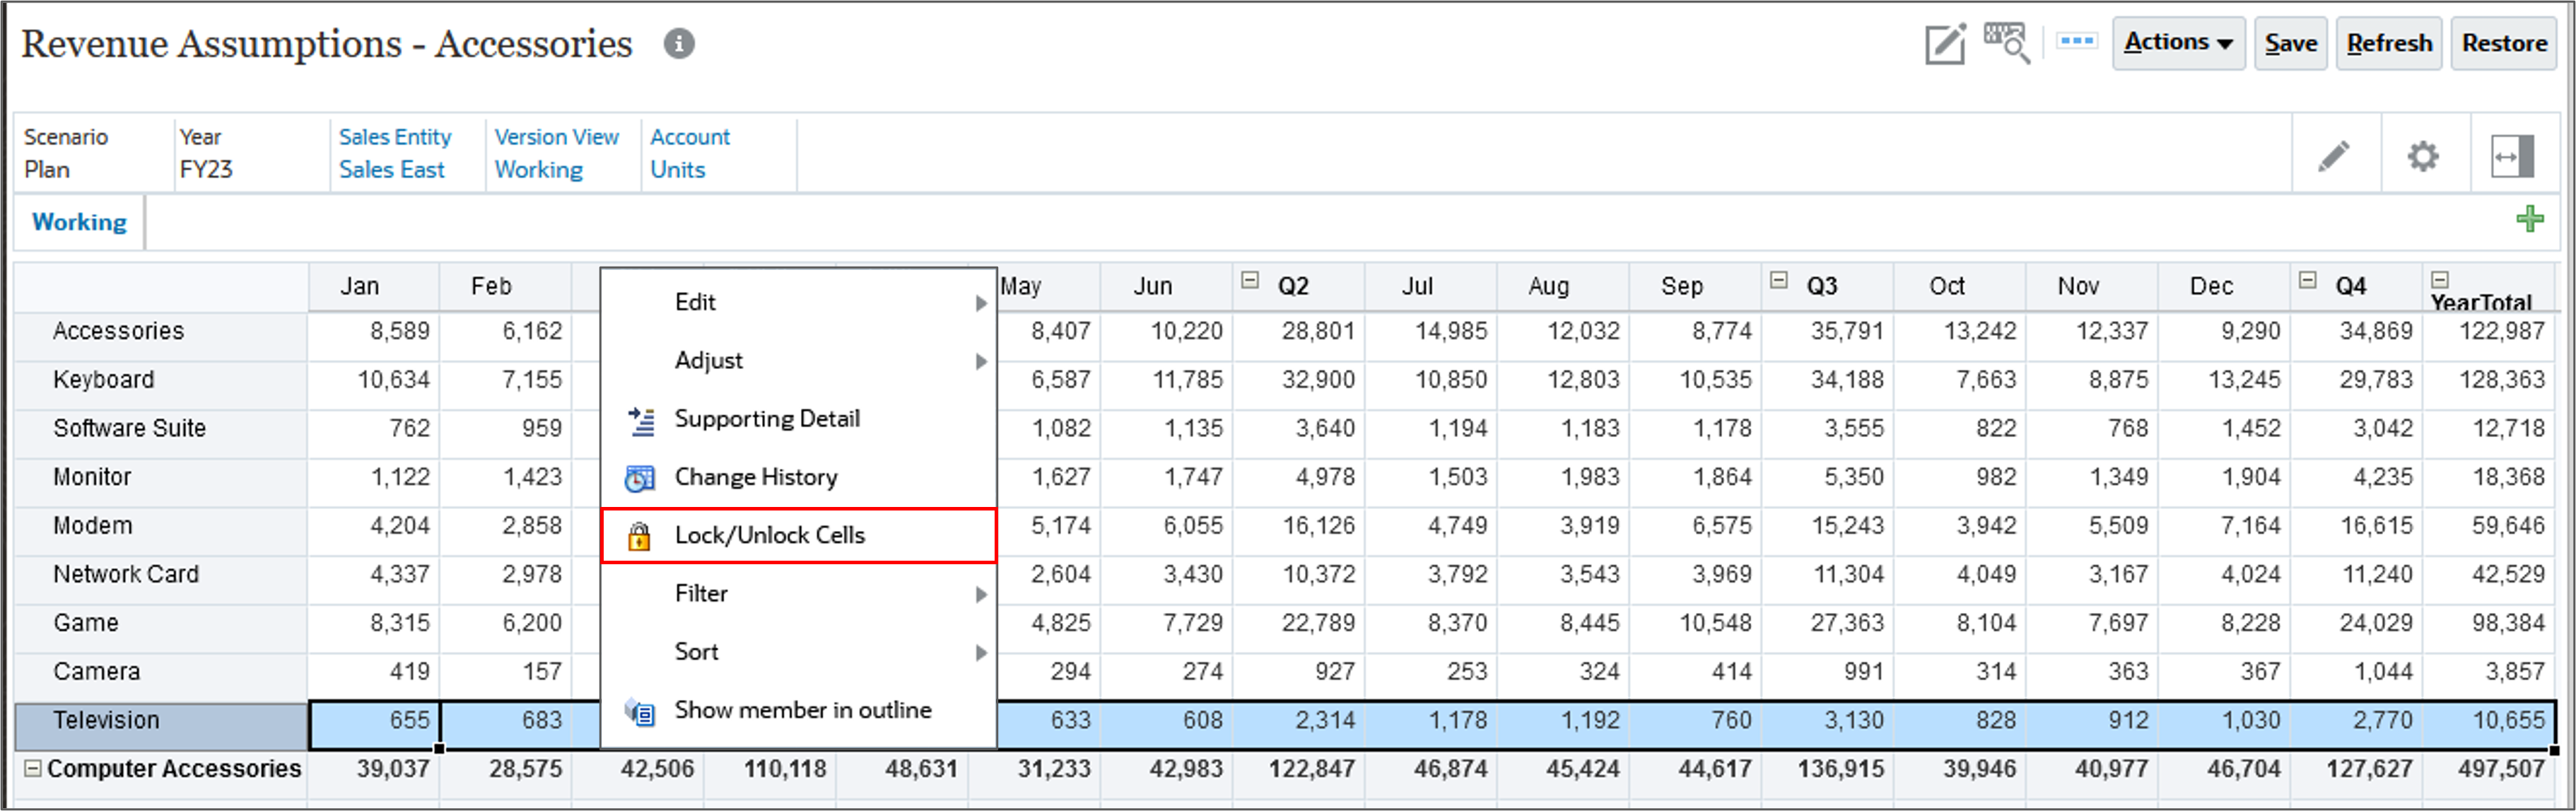
- Right-click in the cell for Actions, and select Lock/Unlock cells.
- Right-click YearTotal for Computer Accessories, and select Adjust then Grid Spread.
- In new value, enter 500,000, and click Apply to apply a top-level value to increase all accessories based on current sales trends.
Values are spread proportionally to all the unlocked cells.
- Click Restore.
- Click (Home).
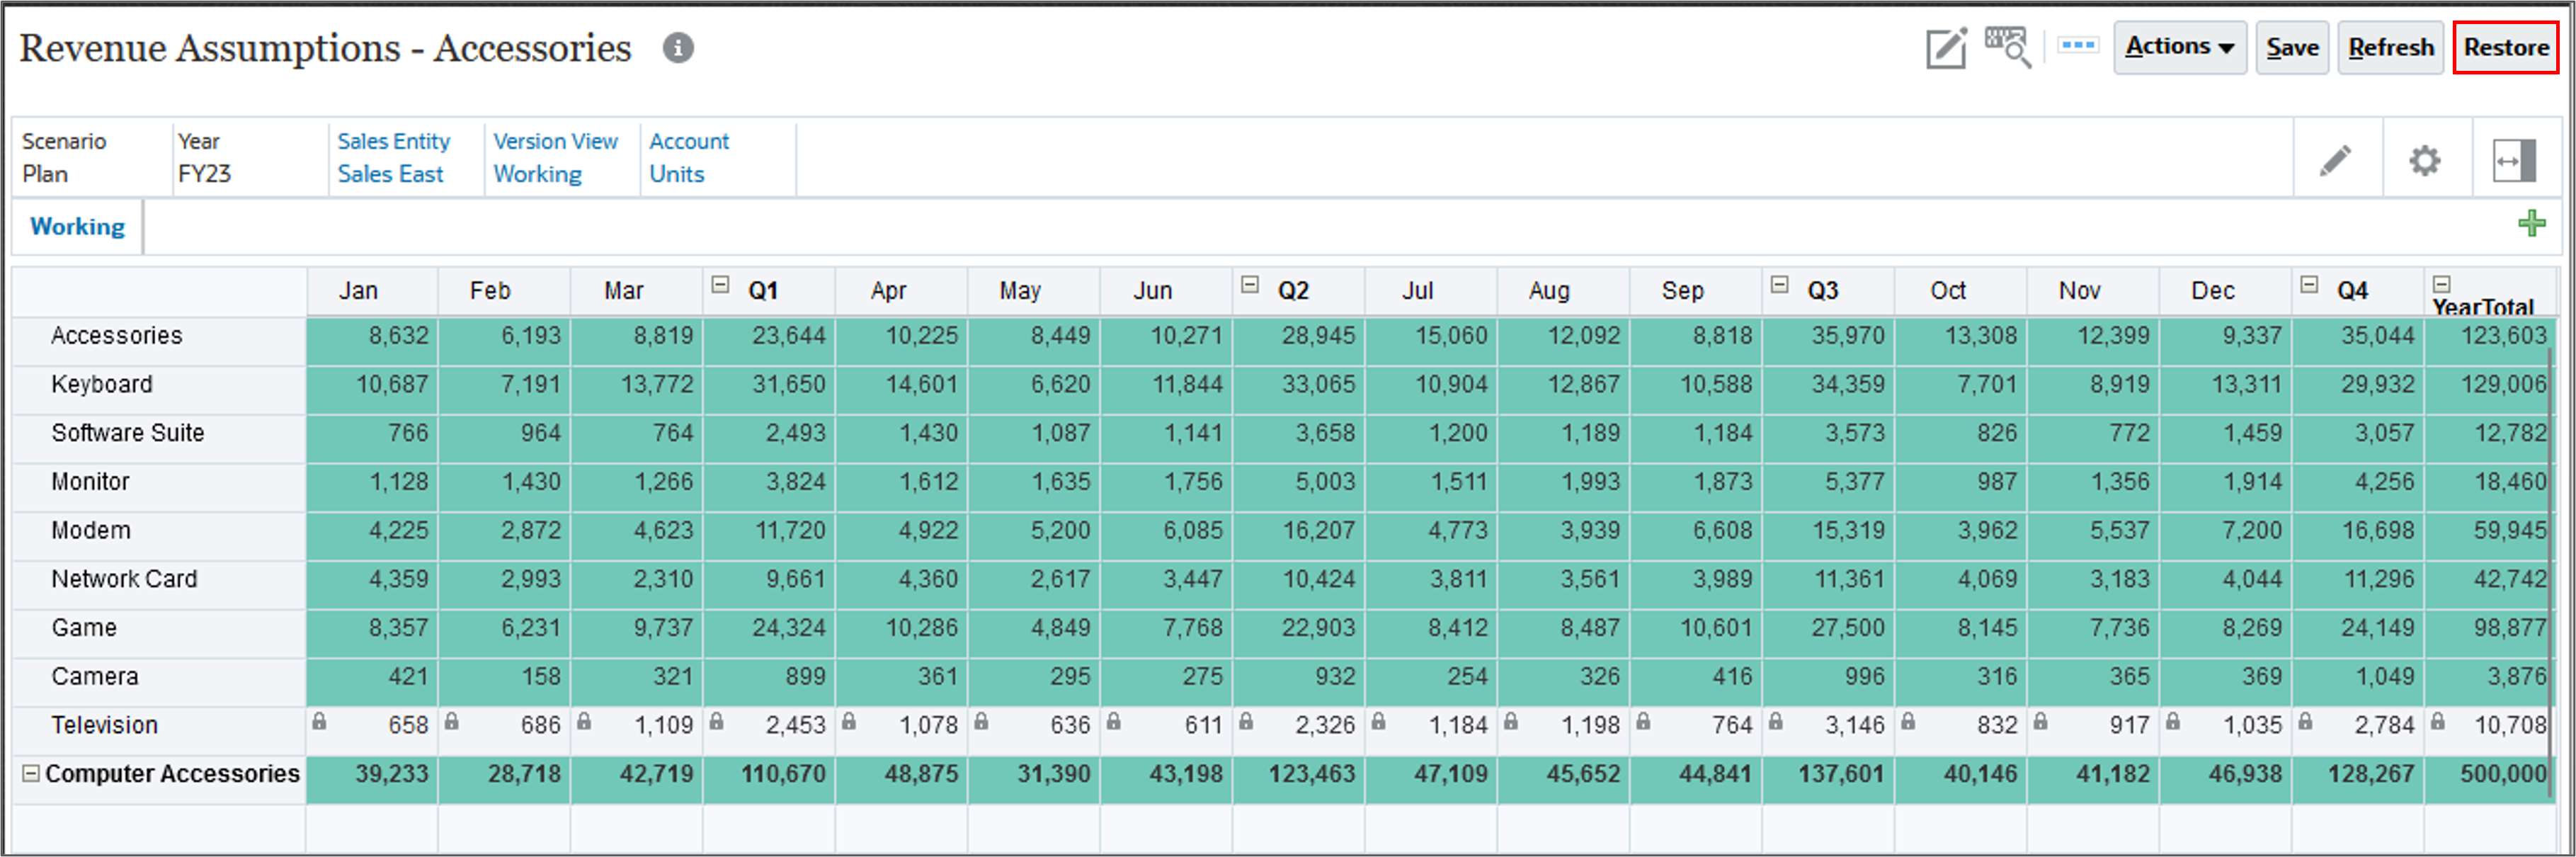
Values in cells are restored.
Adding Details in Planning
In this section, you learn about adding documentation to your plan to provide justification. You can add documentation at different levels, depending on how general or specific the explanation needs to be. For example, enter very specific details at the cell level (called comments and supporting detail) and attach documents, such as reports or spreadsheets, to the cells.
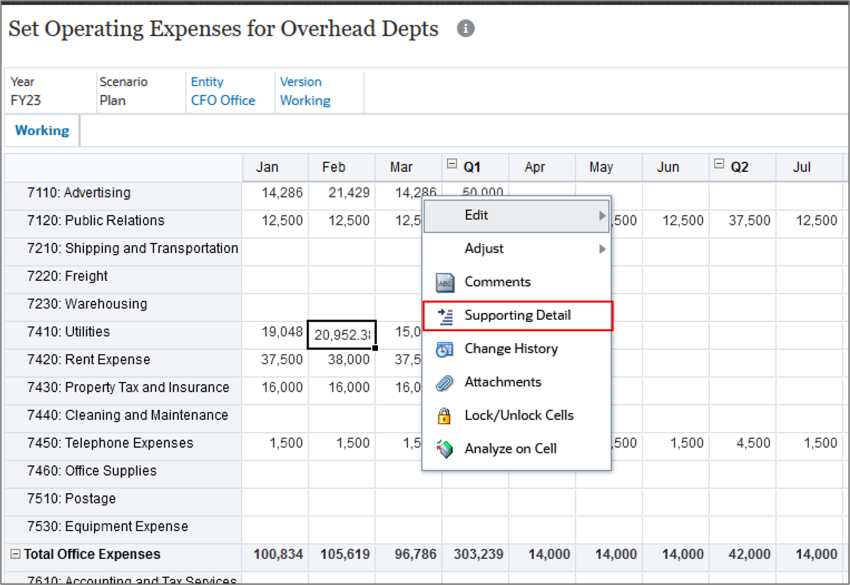
Adding Supporting Details in Planning
You can add supporting detail to data to annotate how data values were derived. You can build logic into how a cell value is calculated, by using the built-in calculator, called Supporting Detail, to develop that value and save your assumptions behind the value.
For example, for an account called Travel Expense, add supporting detail to include detailed data for airfare, hotel, and other expenses.
- Start by navigating to the Other Expense tab by following the steps in the section “Navigating to the Set Operating Expenses for Overhead Page”, and ensure that the POV includes FY23, Plan, CFO Office, and Working.
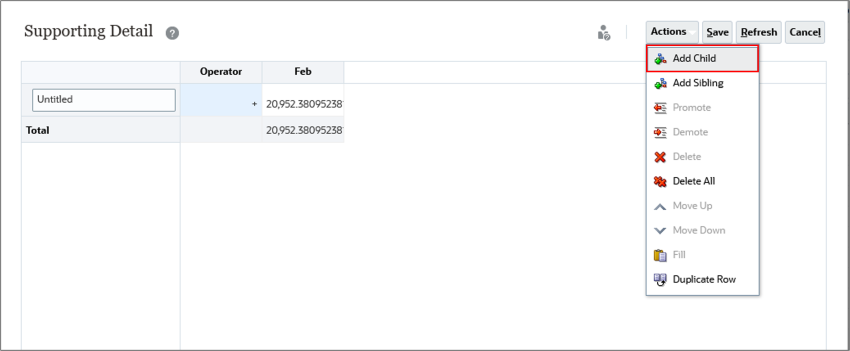
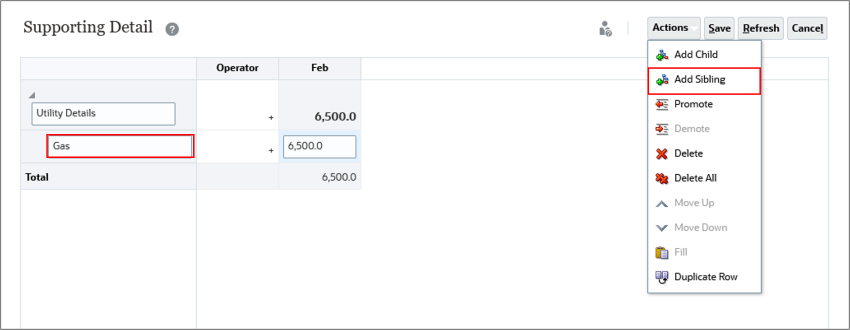
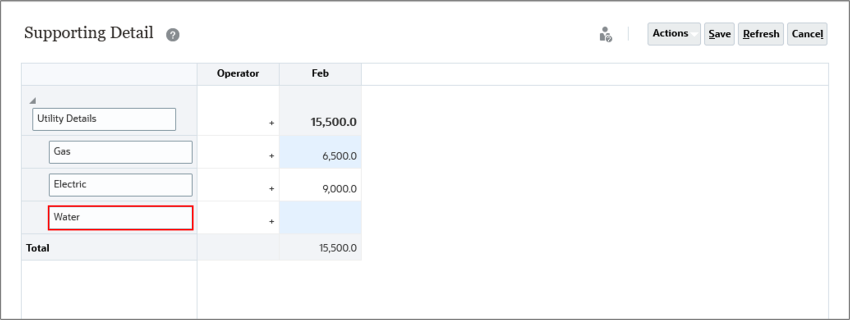
- For Utilities, right-click Feb, select Supporting Detail.
- Select the Untitled row, and click Actions, and select Add Child.
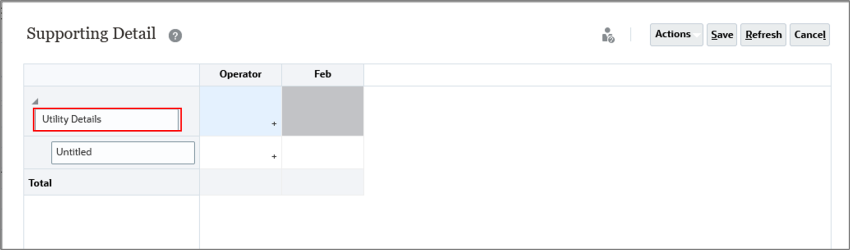
- In the top Untitled row, enter Utility Details.
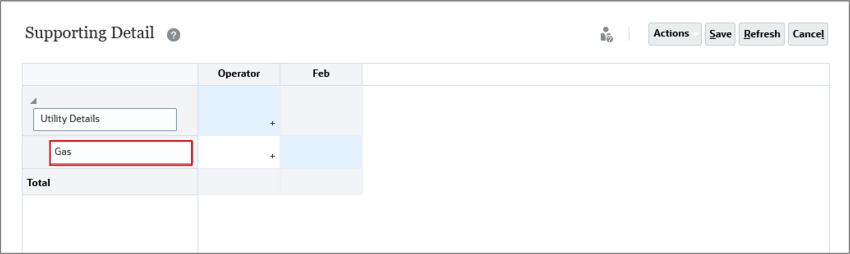
- For the Untitled row, enter Gas.
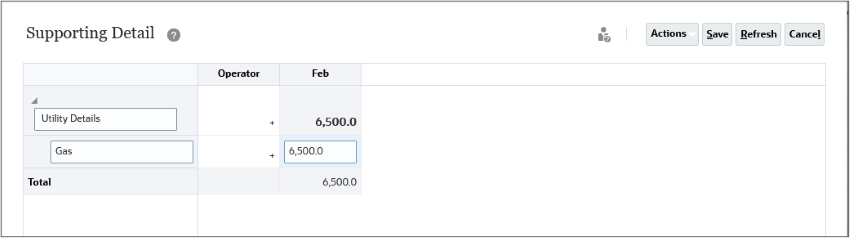
- For Gas, click in Feb and enter 6500.
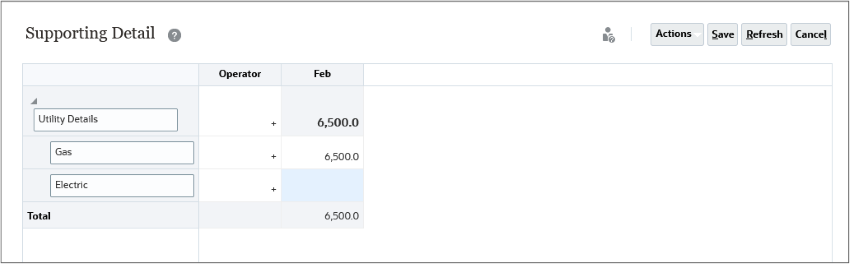
- Select the Gas row, click Actions, and select Add Sibling.
- For the Untitled row, enter Electric.
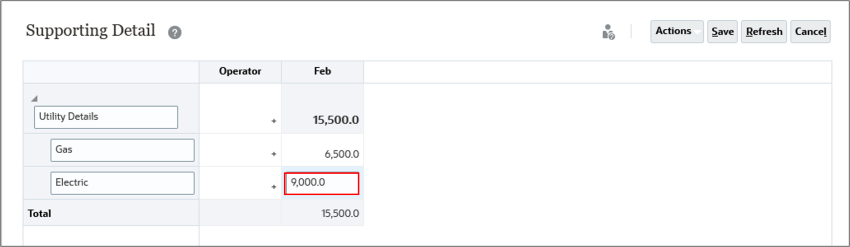
- For Electric, click in Feb and enter 9000.
- Select the Gas row, click Actions, and select Add Sibling.
- For the Untitled row, enter Water.
- For Water, click in Feb and enter 5500, and click Save.
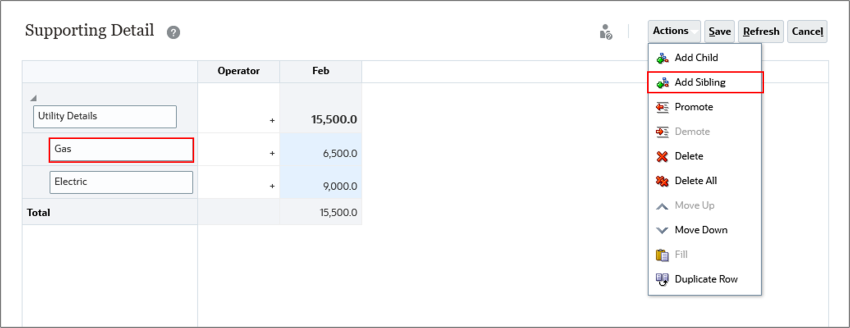
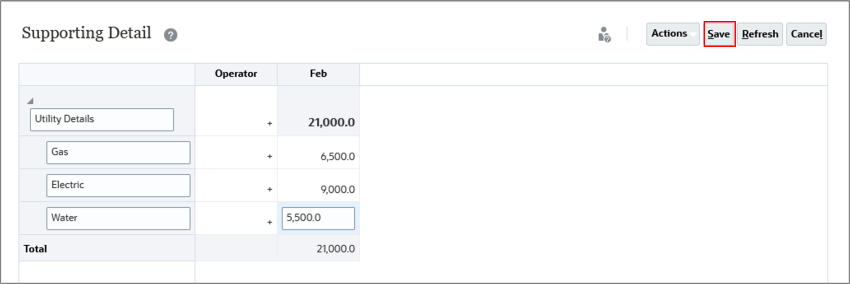
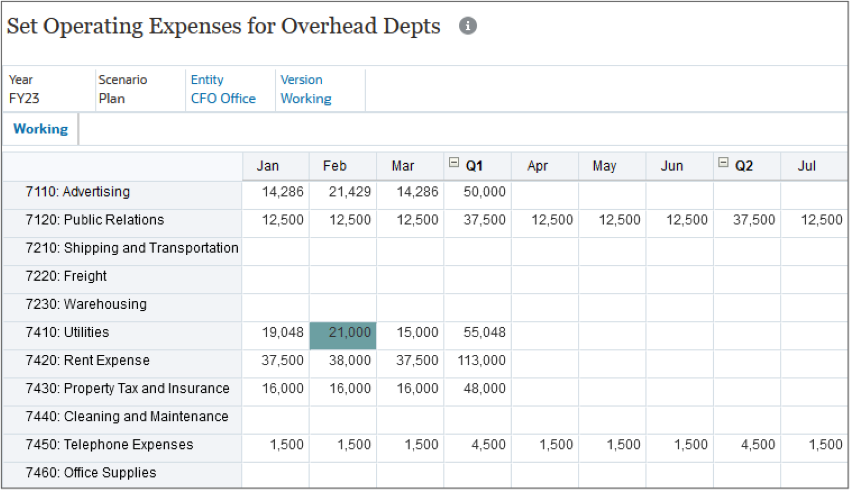
The data is saved. The cell with supporting detail is displayed with a teal color.
Adding Comments in Planning
To explain data or provide background, you can add comments to a cell or to a range of cells across multiple dimensions. After you add comments, a small triangle in the upper right of a cell indicates that it has a comment.
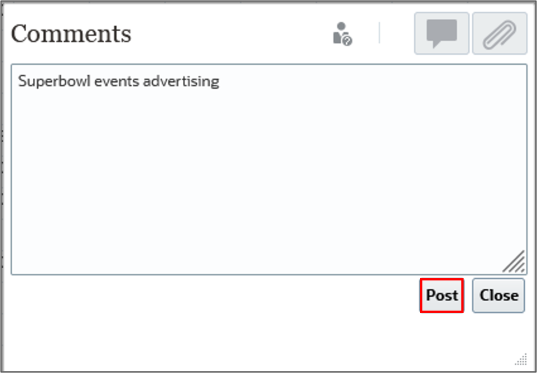
- For Advertising, right-click the February cell, and select Comments. .
- Enter Superbowl events advertising, and click Post.
- Click Close.
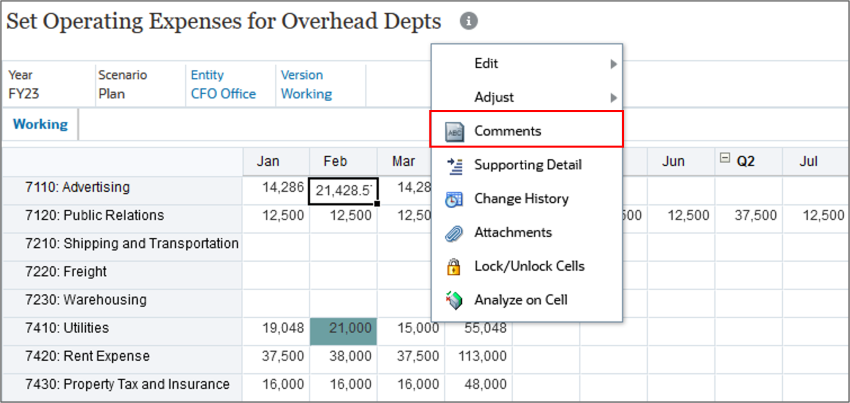
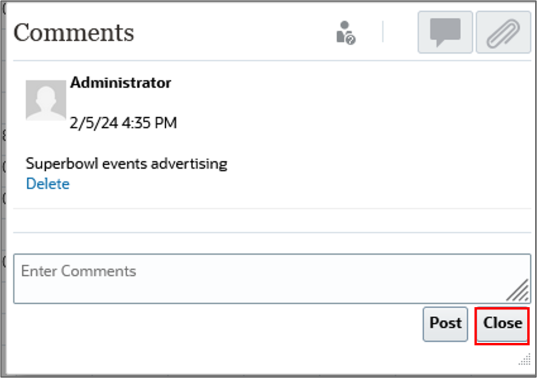
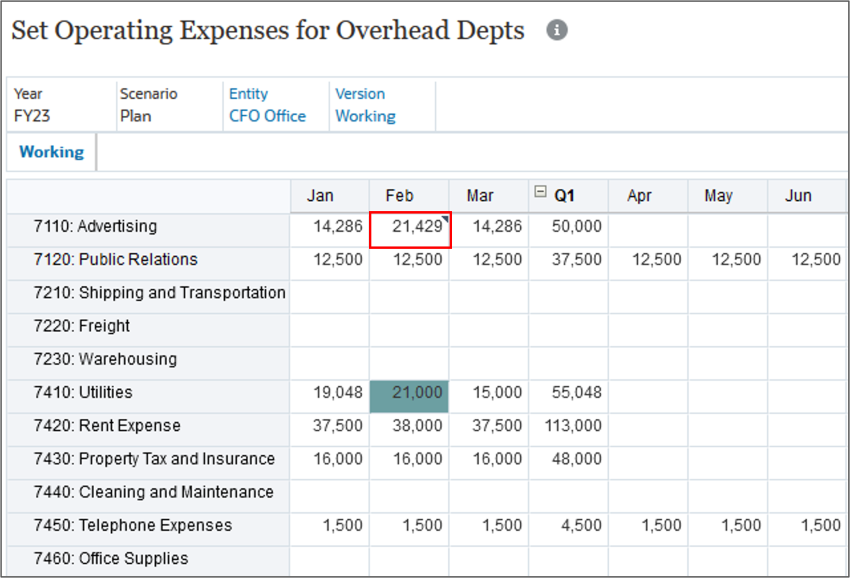
A small triangle in the upper right of a cell indicates that it has a comment.
Adding Attachments in Planning
You can provide background information on data by attaching a file to a cell or range of cells.
If your administrator selects the Enable Cell-Level Document property for the form, you can add attachments to cells. These attachments can be any file type such as an XLS file. You could attach several documents to a cell, each with updated assumptions behind the cell's sales data. The attachment icon indicates that a cell has an attachment.
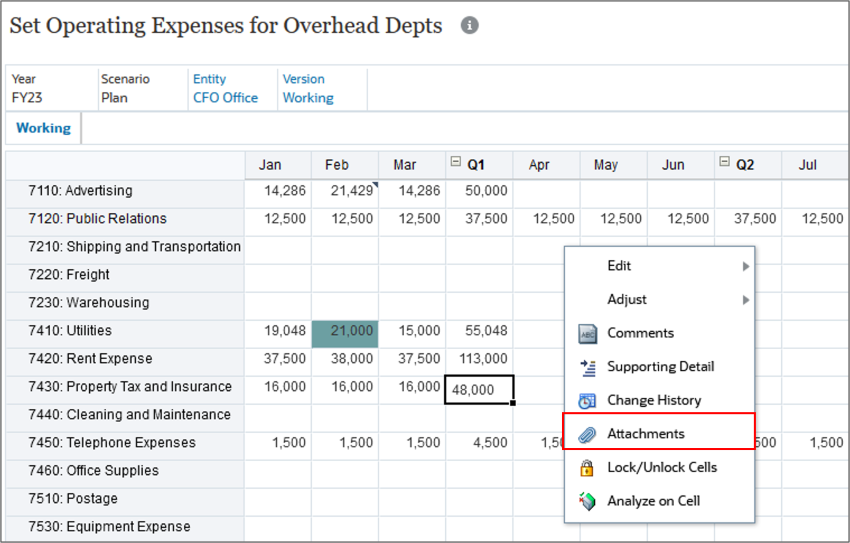
- For Property Tax and Insurance, right-click Q1, and select Attachments.
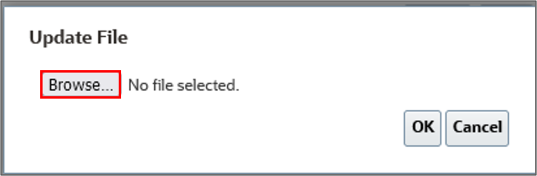
- Click Browse.
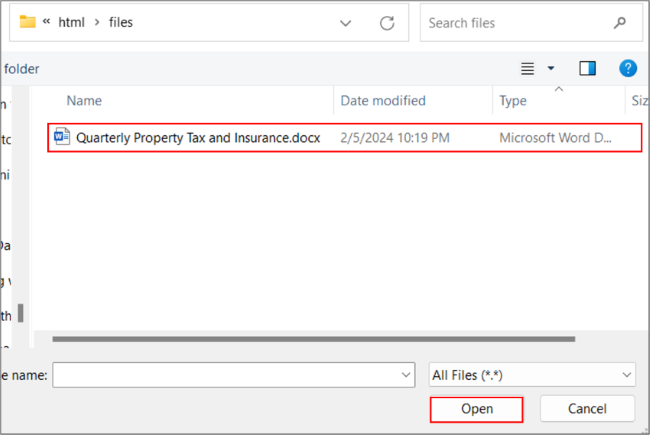
- Select a file and click Open.
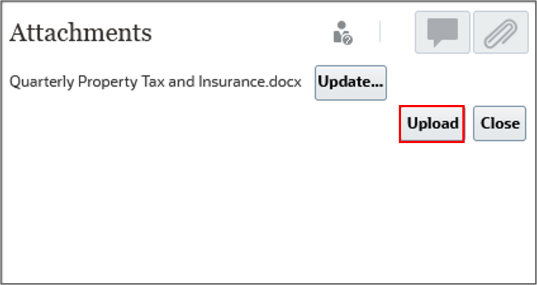
- Click Upload.
- Click Close.
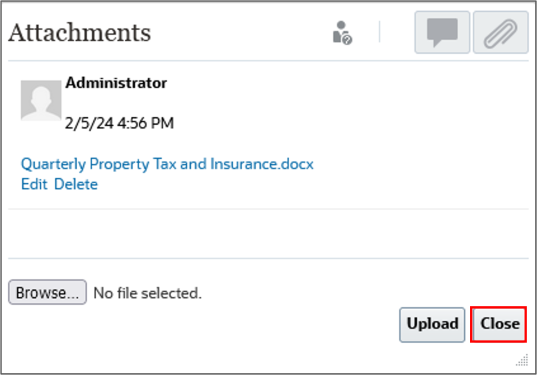
The attachment icon indicates that a cell has an attachment.
Organizing and Formatting Members and Data in Planning
In this section, you learn about simplifying the data presentation by controlling which rows or columns are displayed (or hidden). You can also sort the values in a row or column either in ascending or descending order. You can improve the presentation quality of the data by setting formatting options such as font, font size, and color.
Filtering Data in Planning
You can filter rows and columns to select which rows or columns to display on forms. You can filter data to keep or exclude members by using simple functions that compare against a specified value.
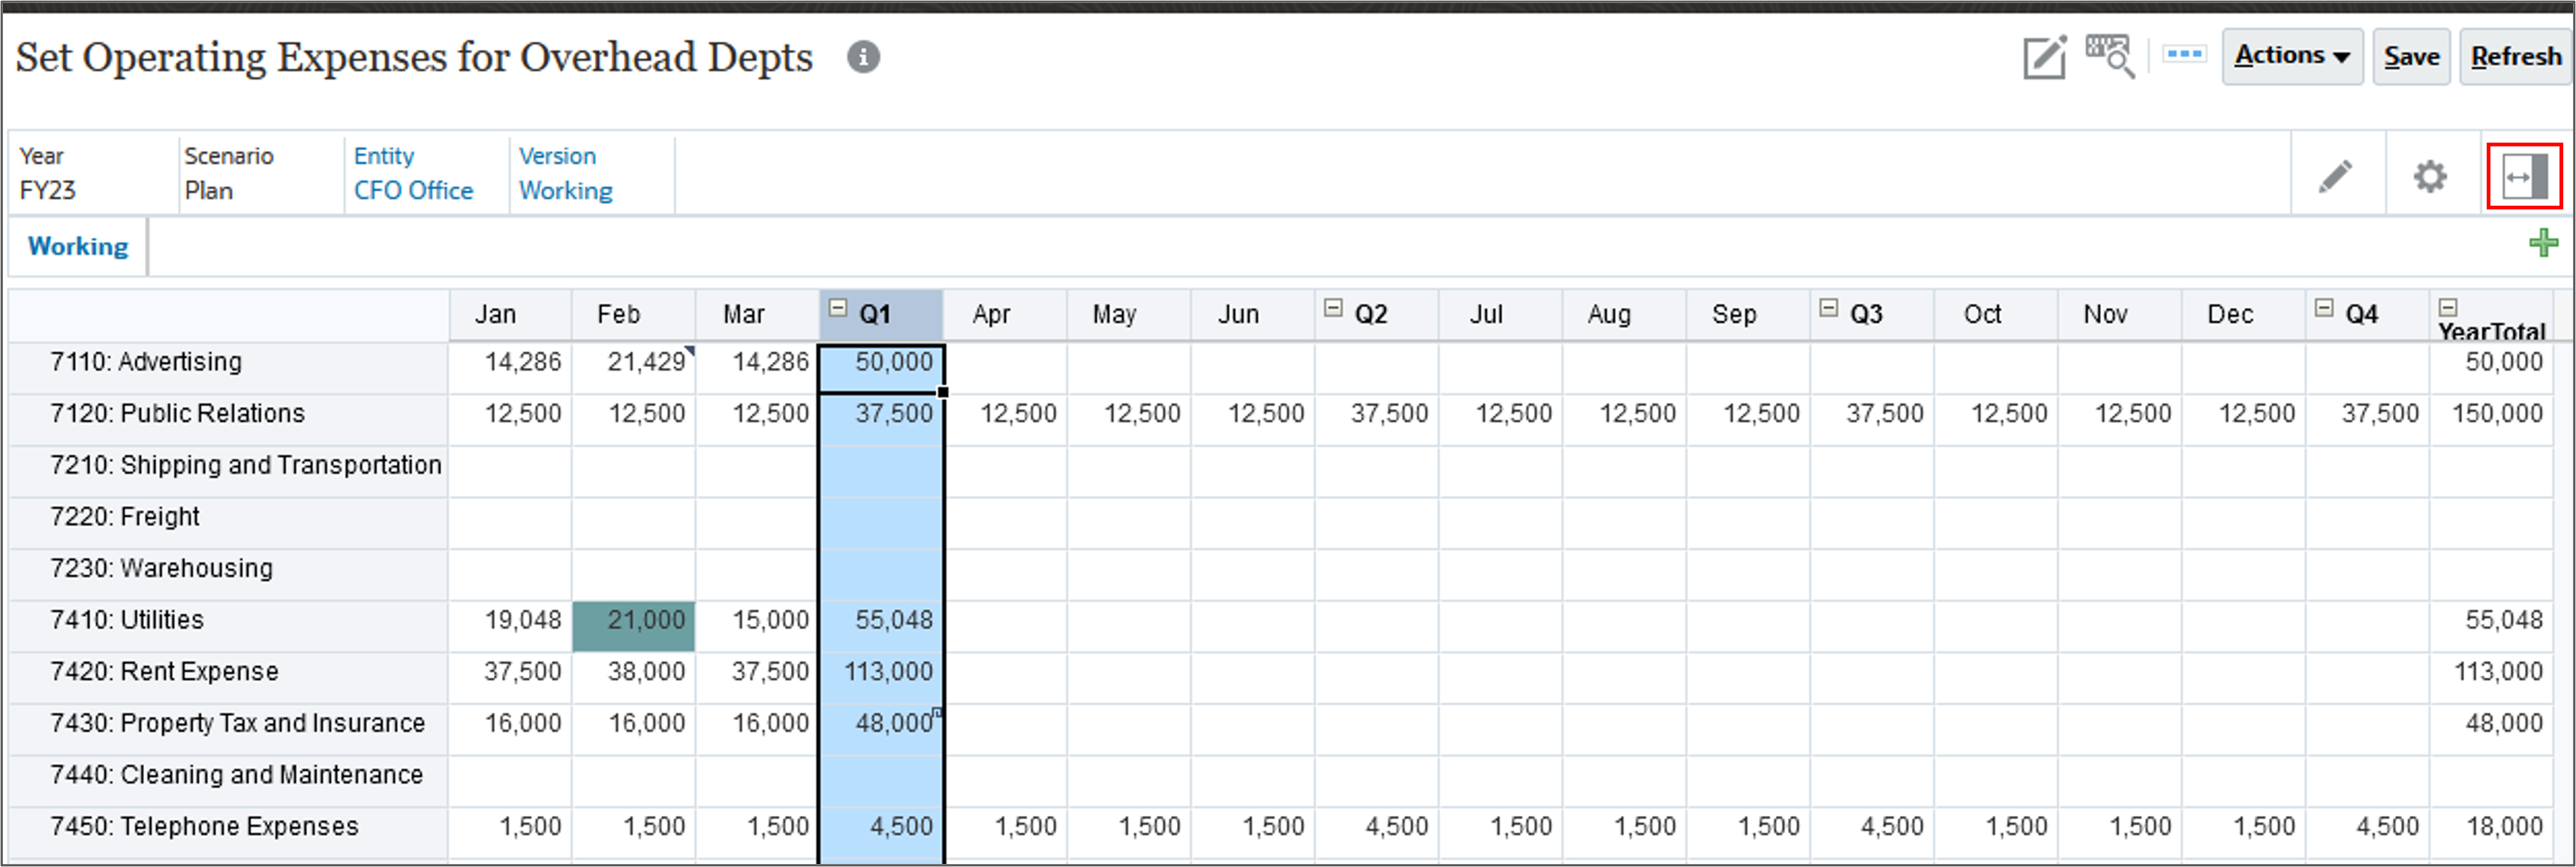
- Start by navigating to the Other Expense tab by following the steps in the section “Navigating to the Set Operating Expenses for Overhead Page”, and ensure that the POV includes FY23, Plan, CFO Office, and Working.
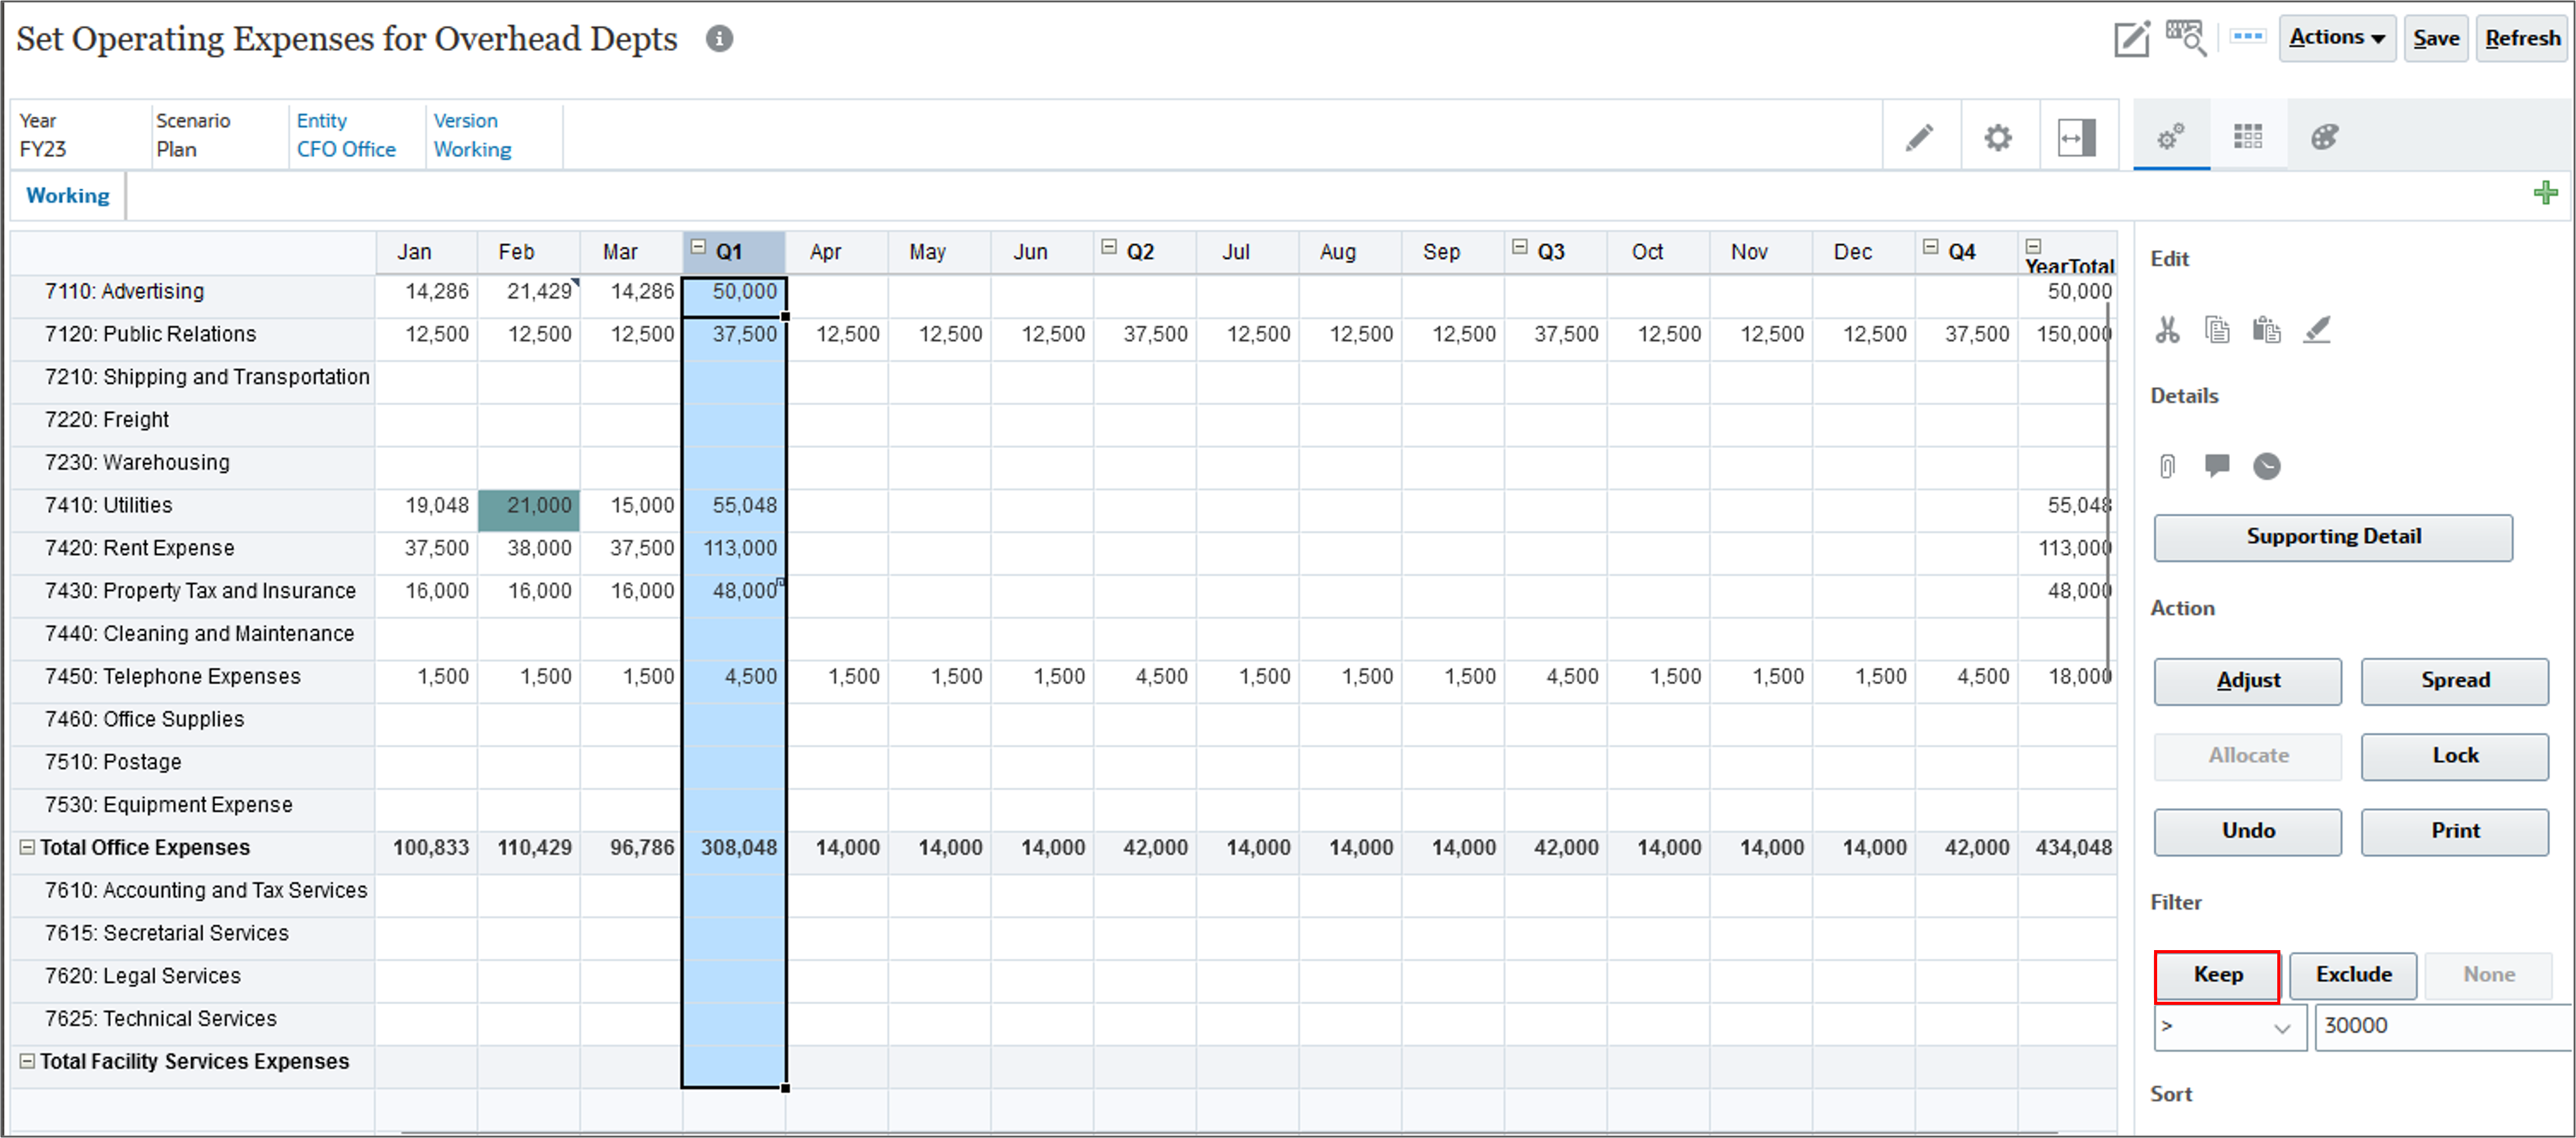
- Select the Q1 column, and click
 (Property Panel) to view the properties.
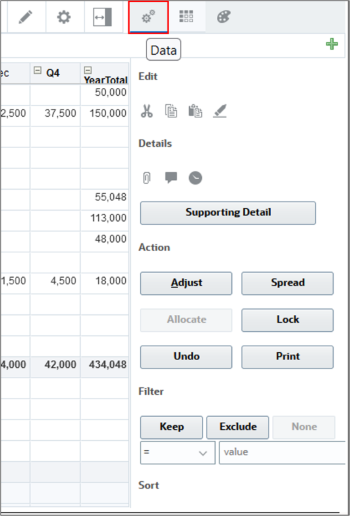
 - Click
 (Data).
 - In Filter, select > and in value, enter 30000.
- Click Keep.
- Select the Q1 column, in Filter, click None.
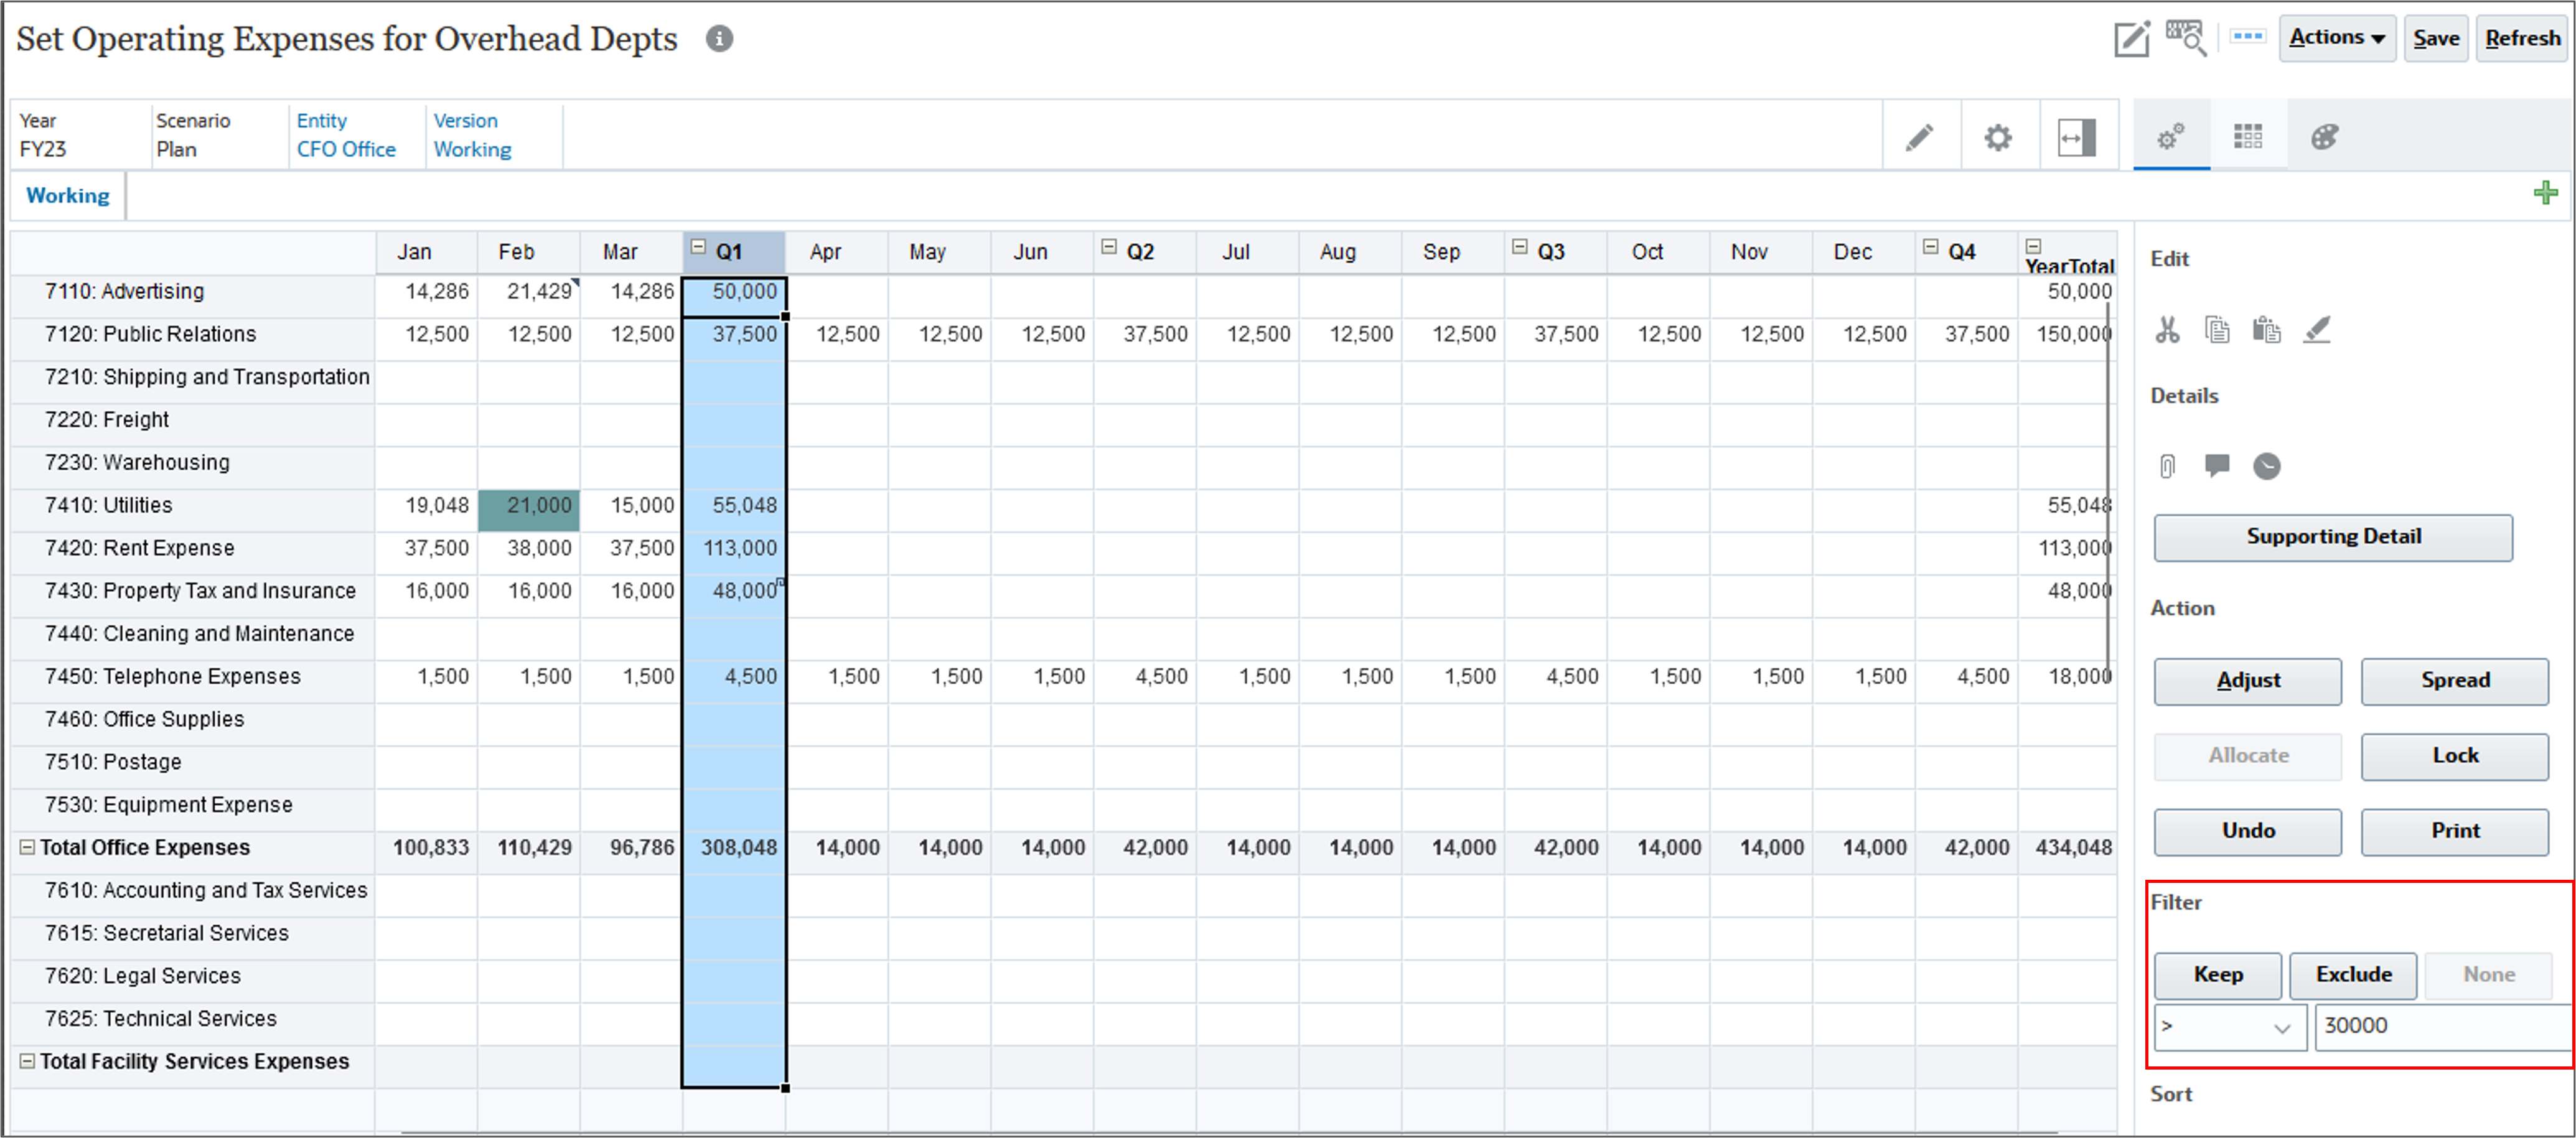
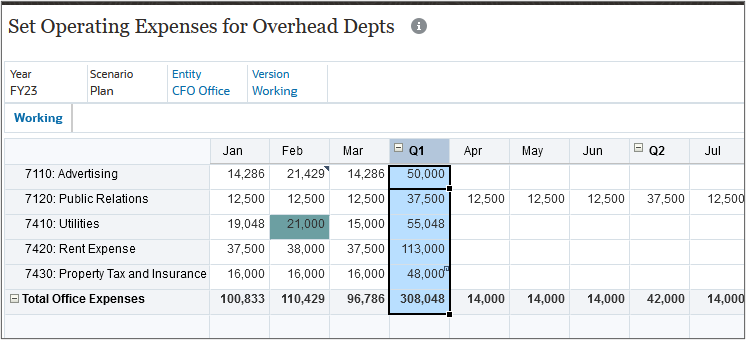
Only Q1 data greater than 30000 is displayed.
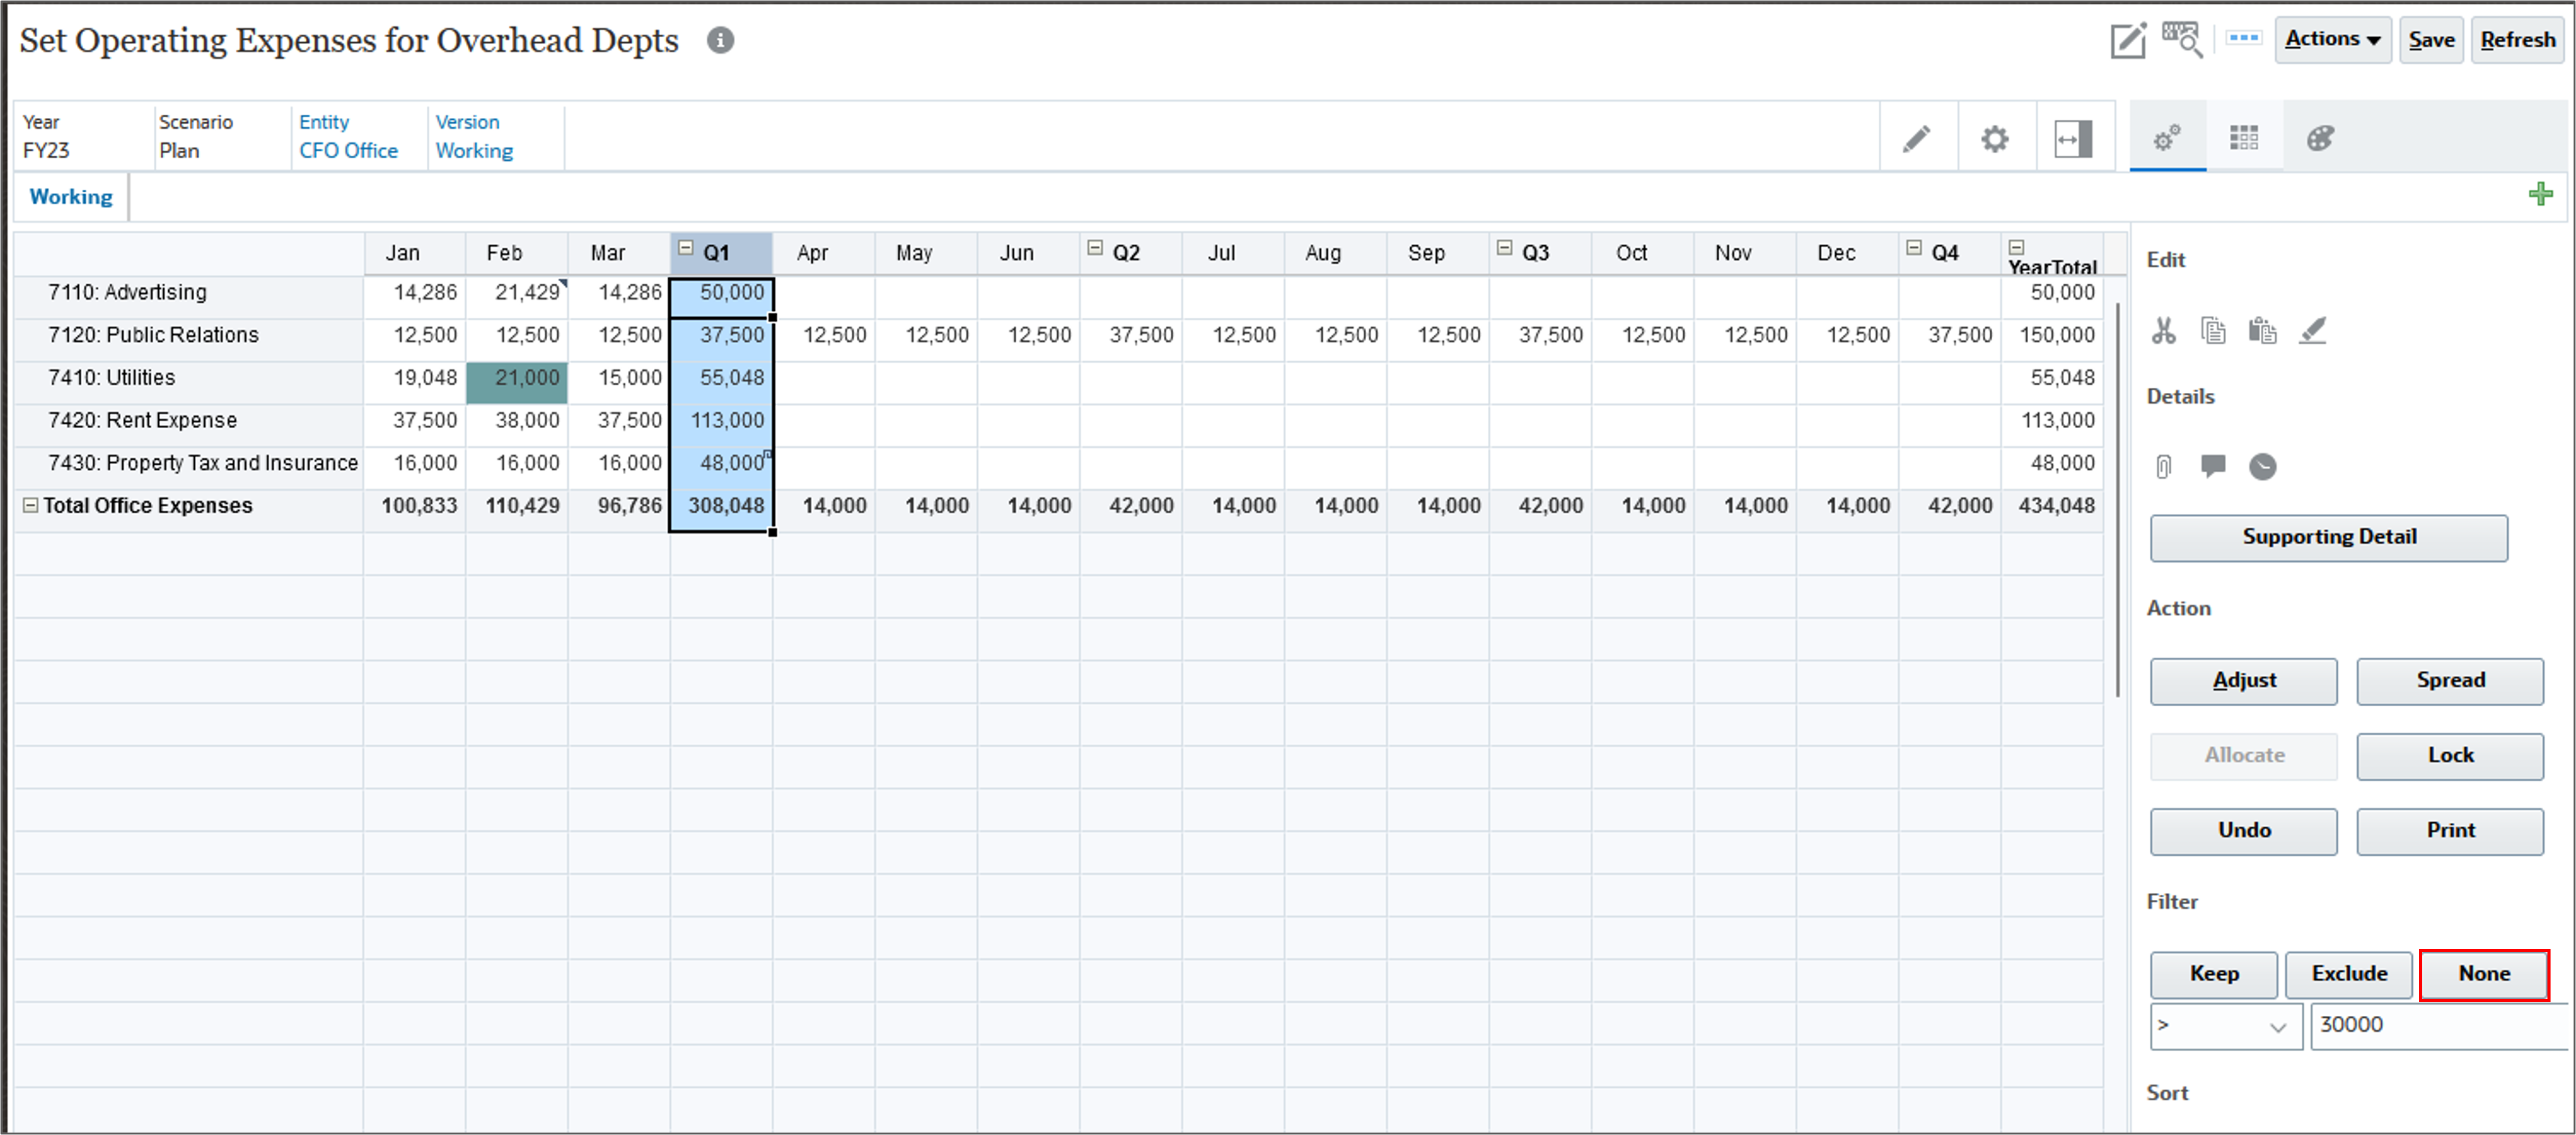
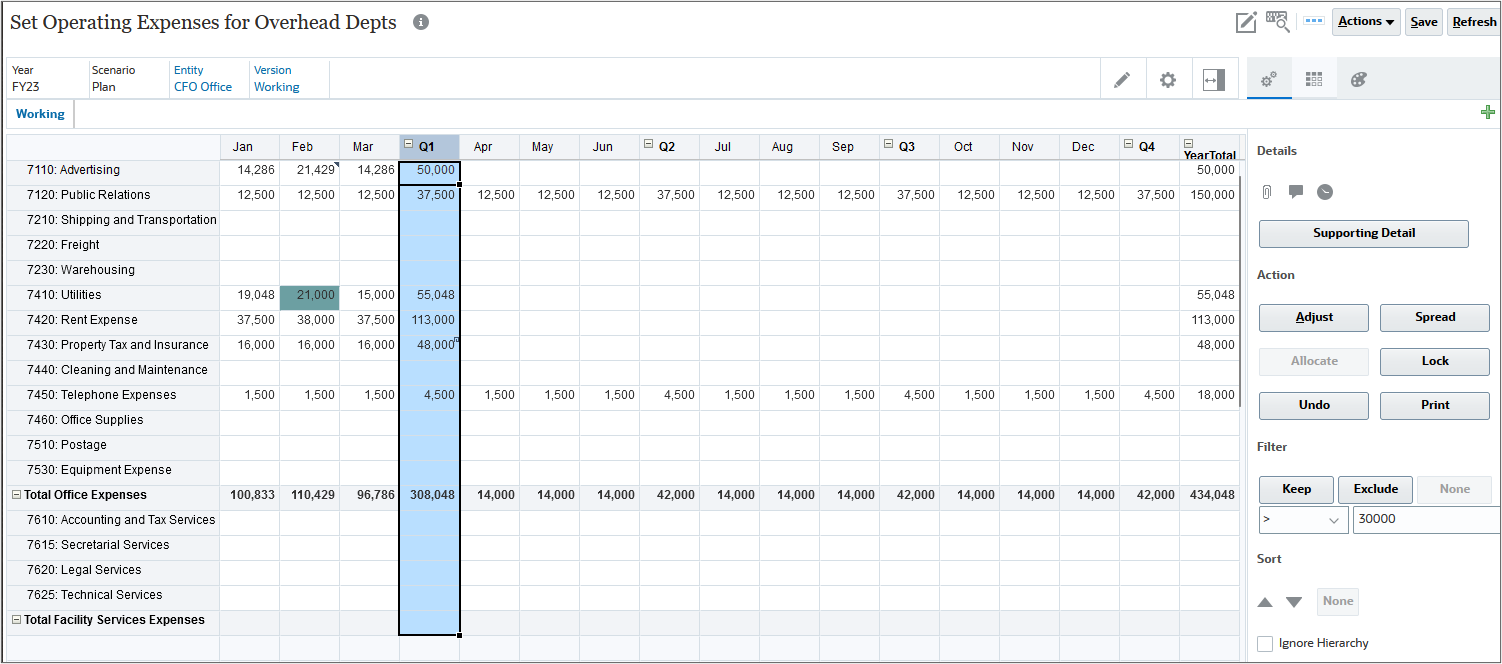
The form is restored to its original order.
Sorting Data in Planning
You can sort the values in a row or column either in ascending or descending order.
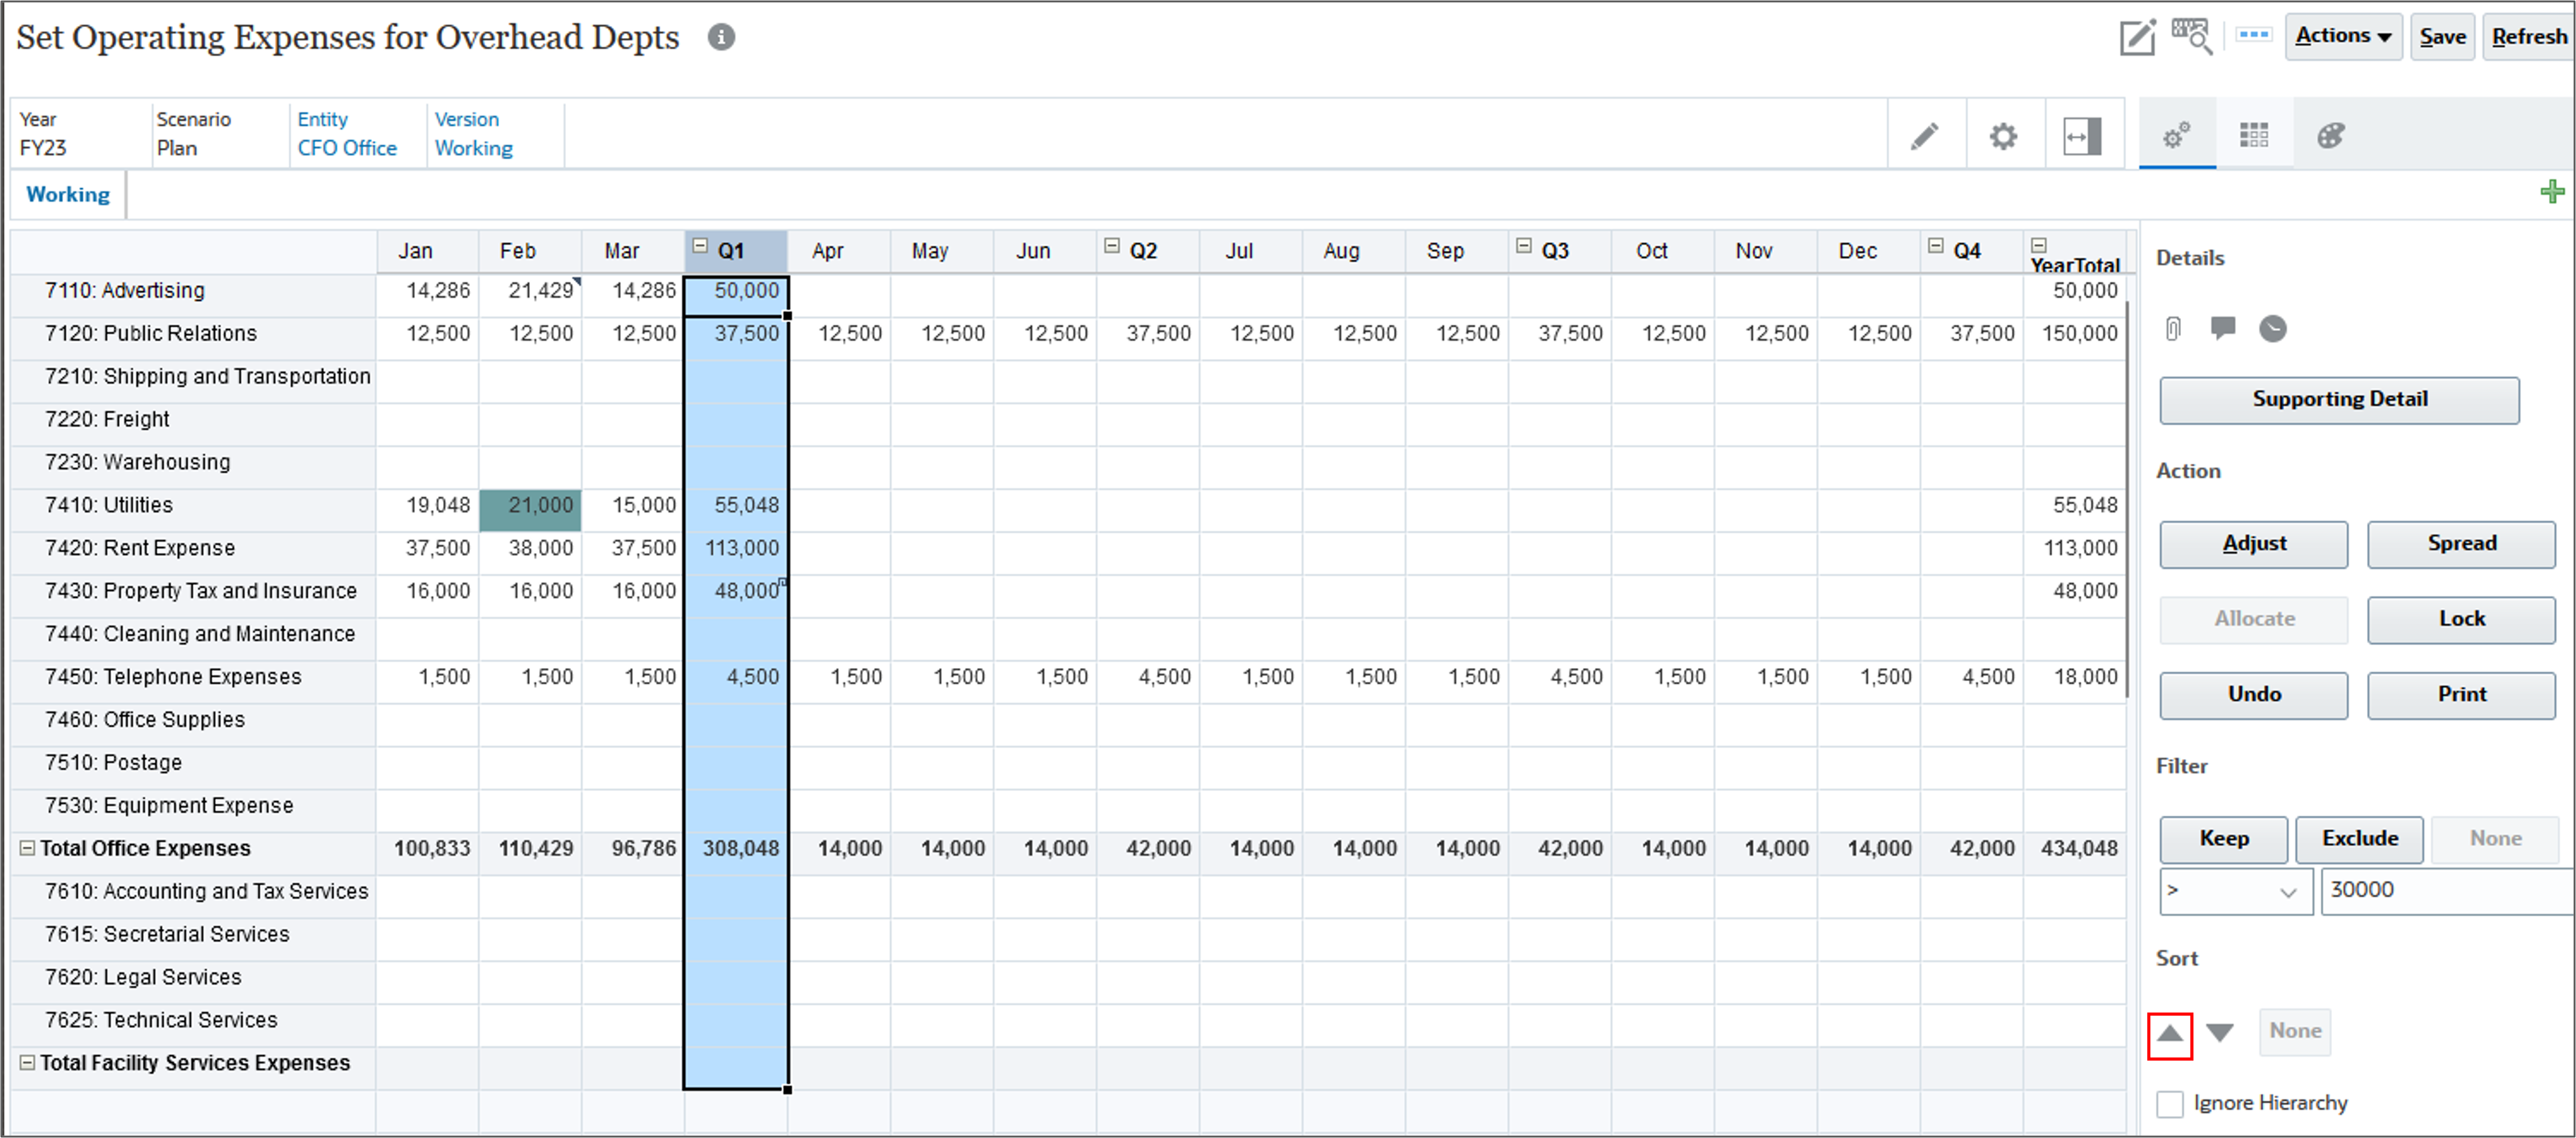
- Select the Q1 column, and under Sort, click
 (Sort Ascending).
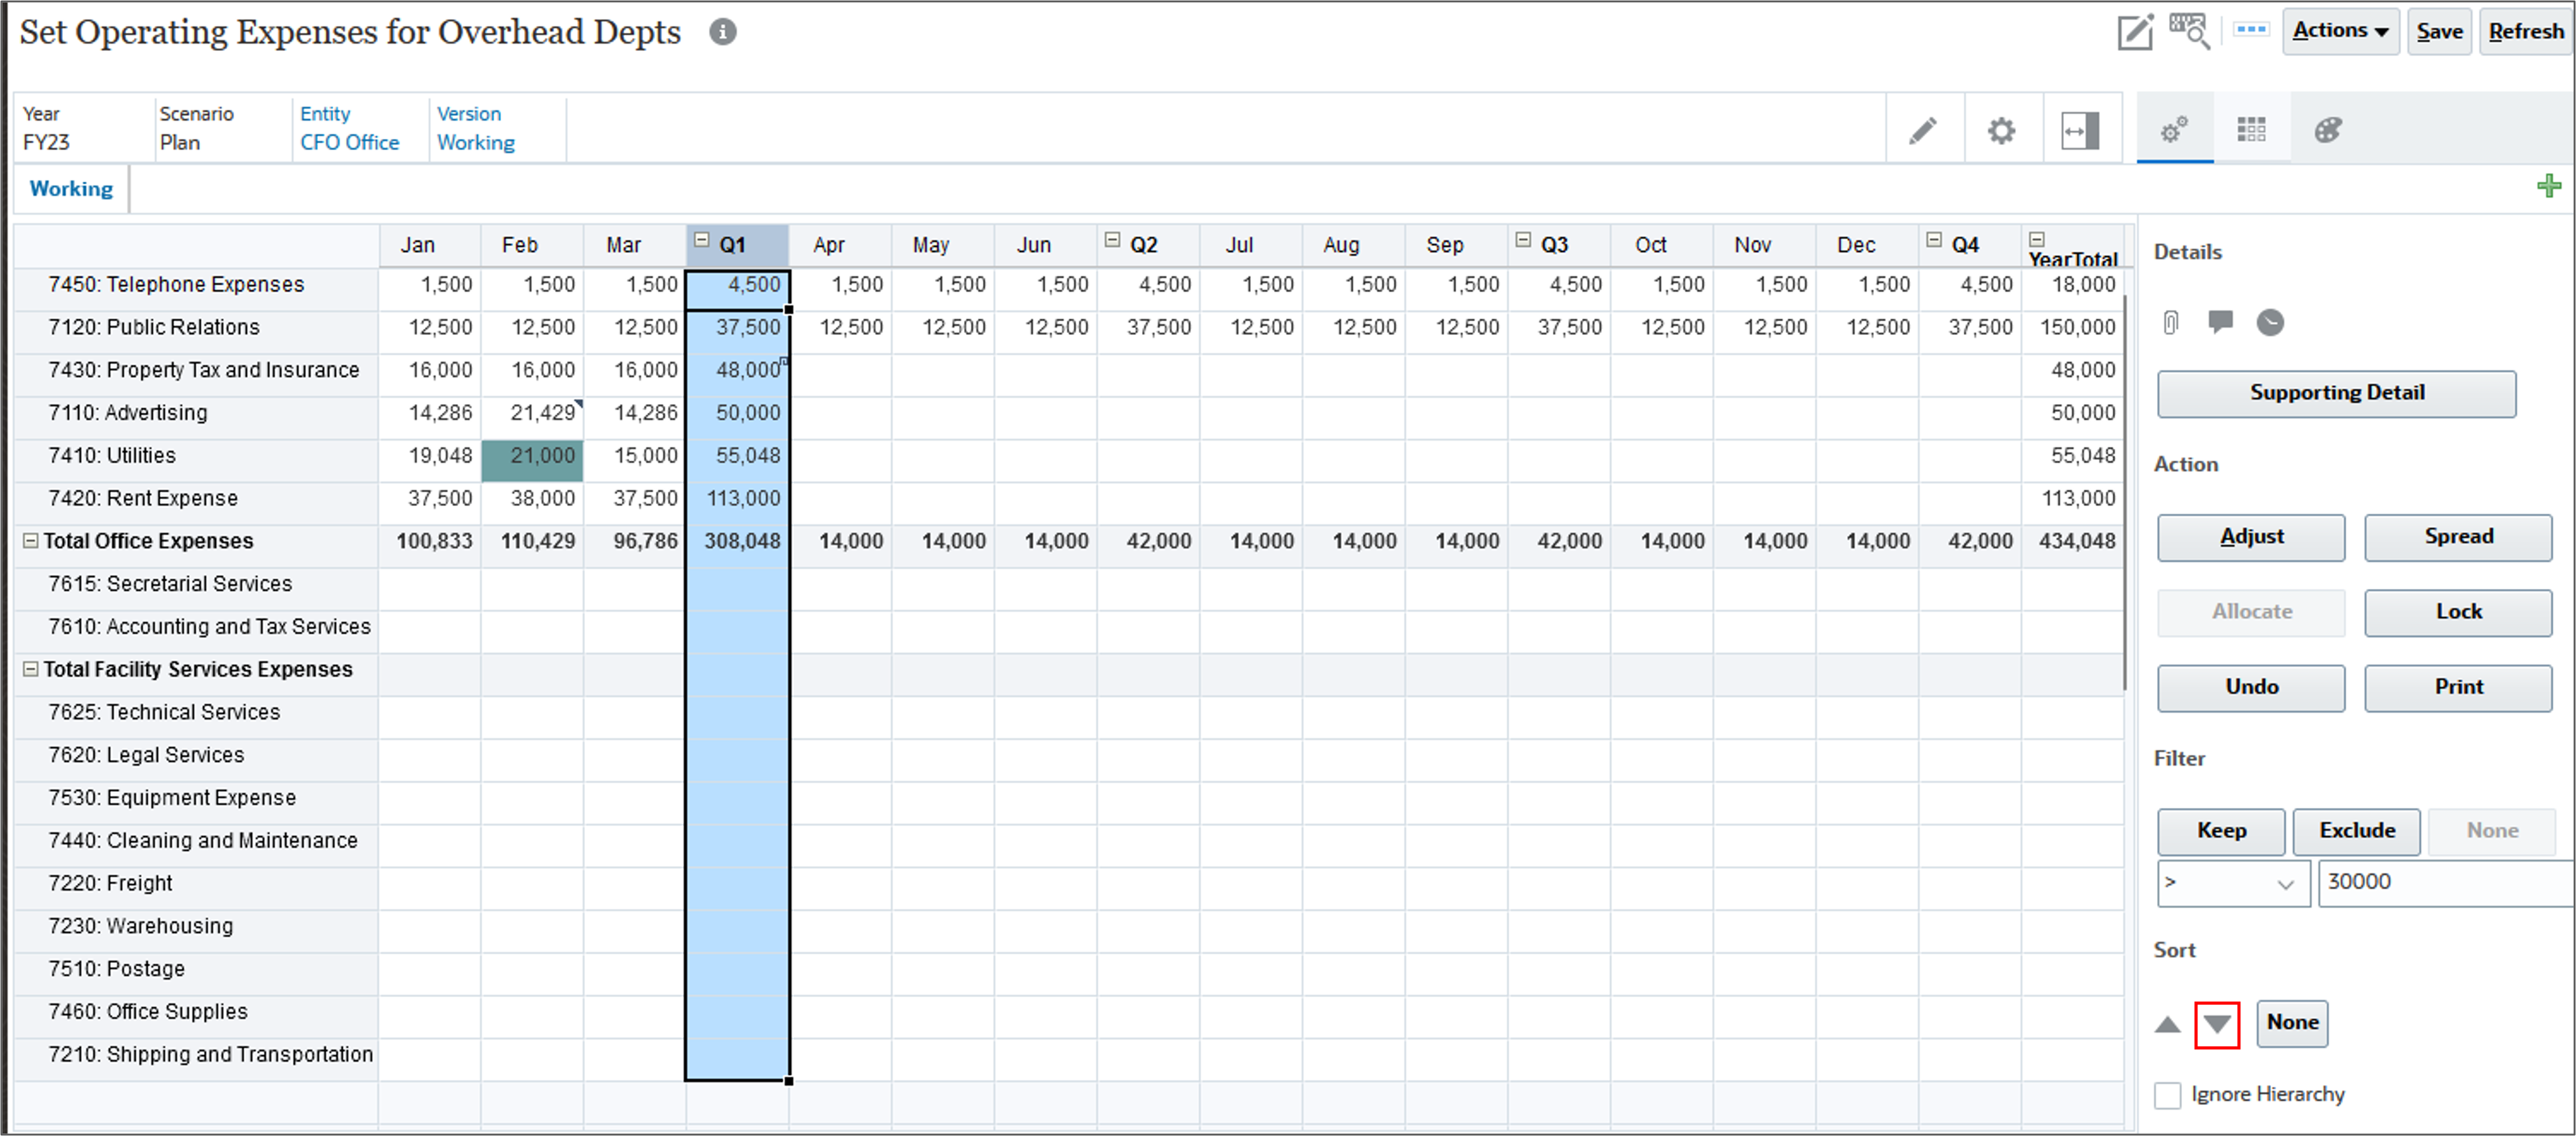
 - Select the Q1 column, and in Sort, click
 (Sort Descending).
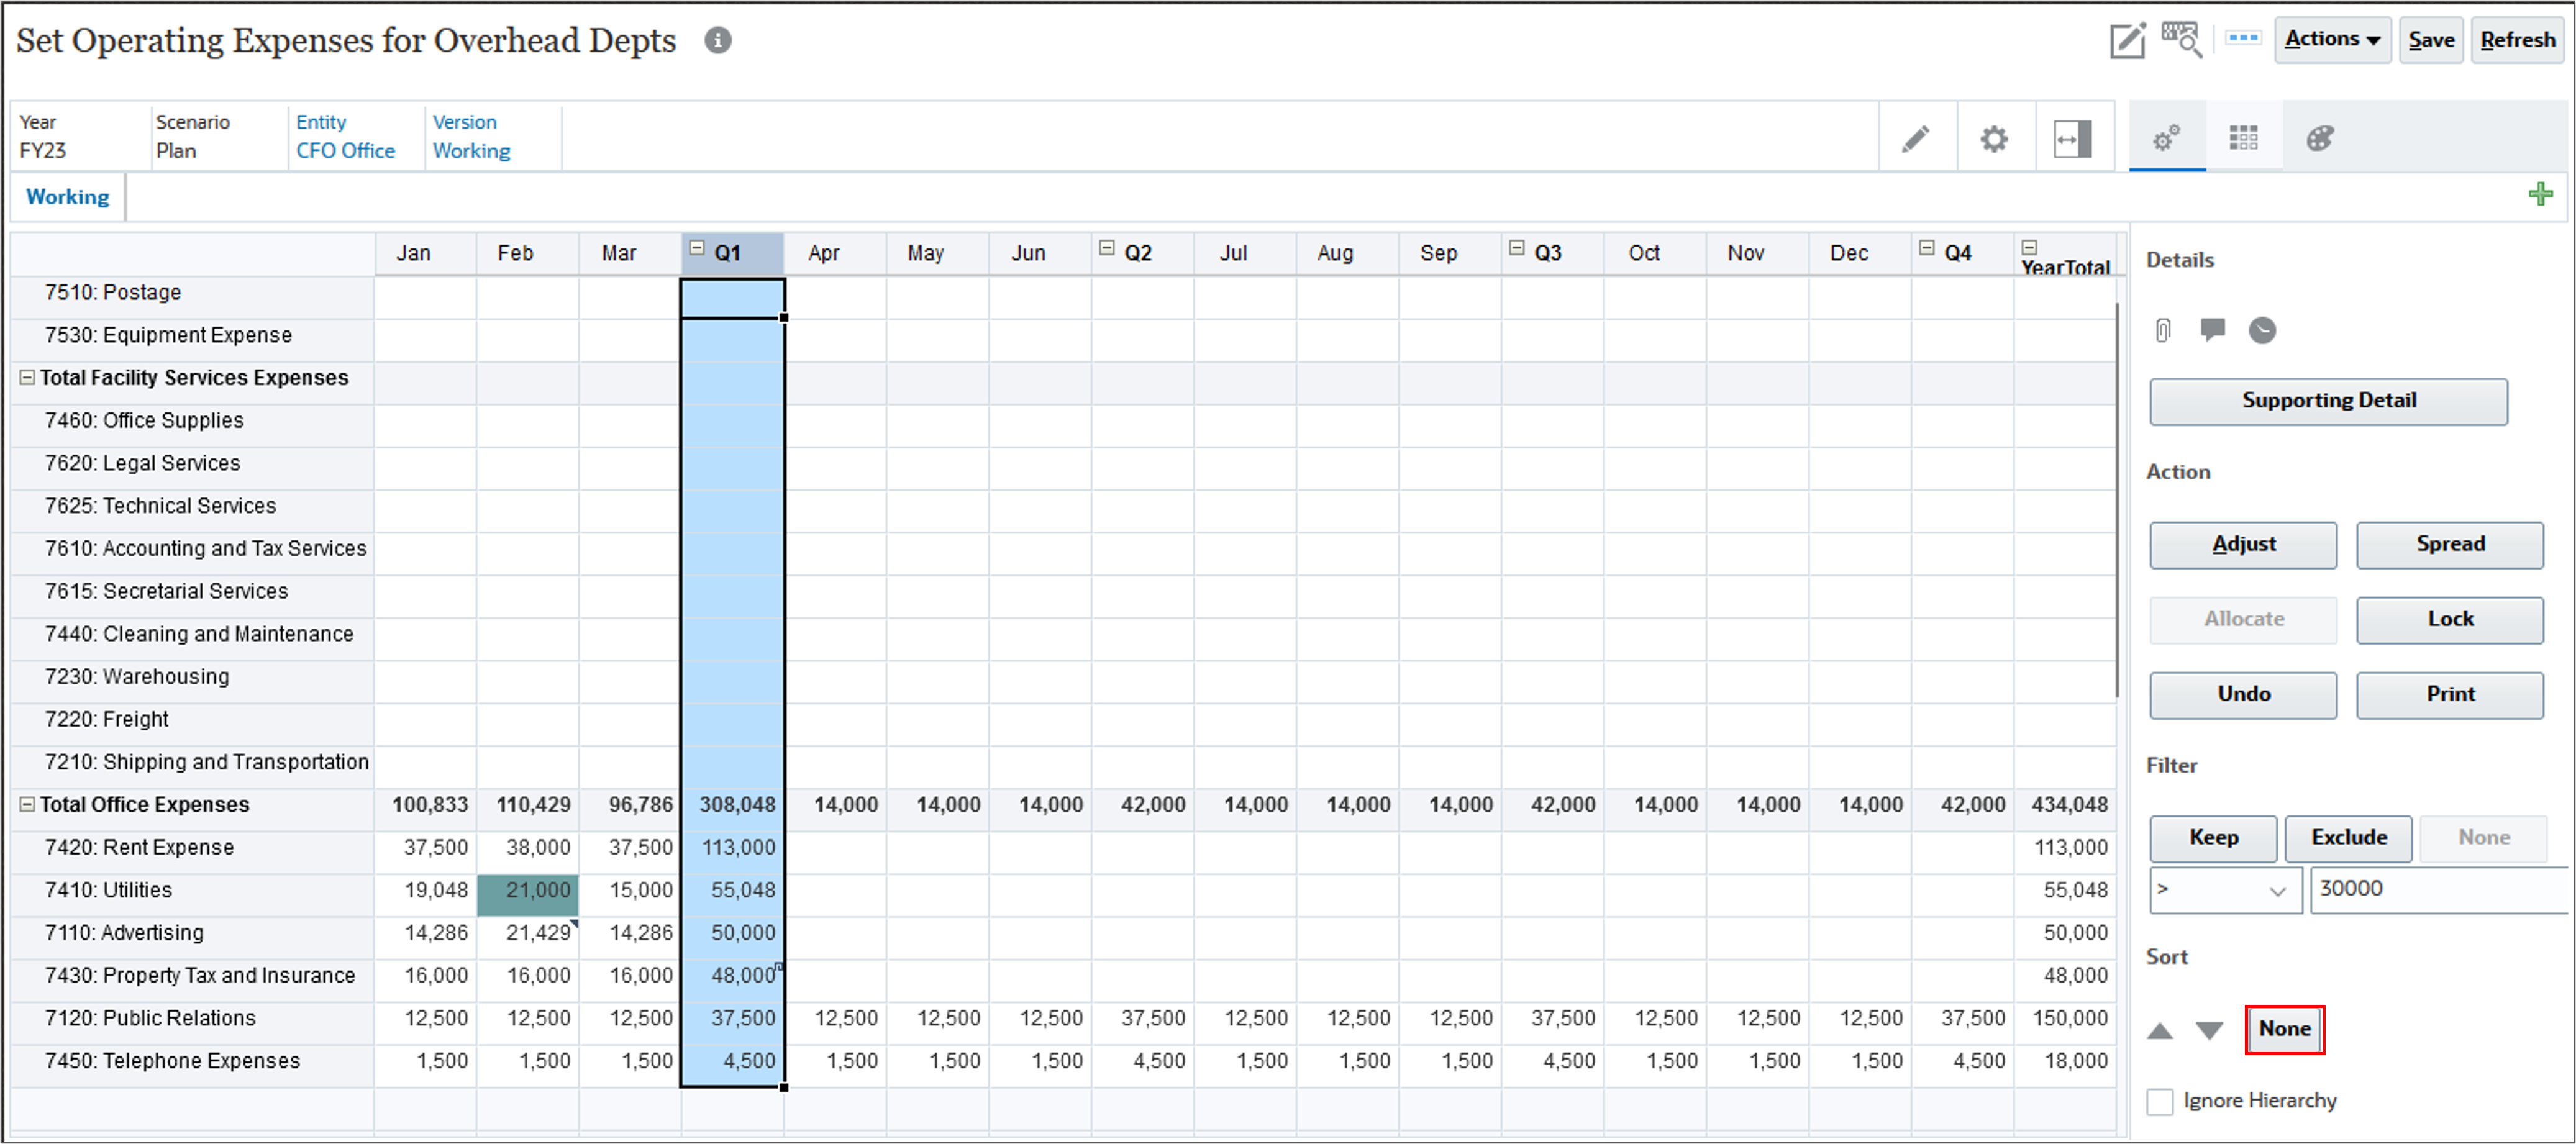
 - Remove the sort by selecting the Q1 column, and in Sort, click None.
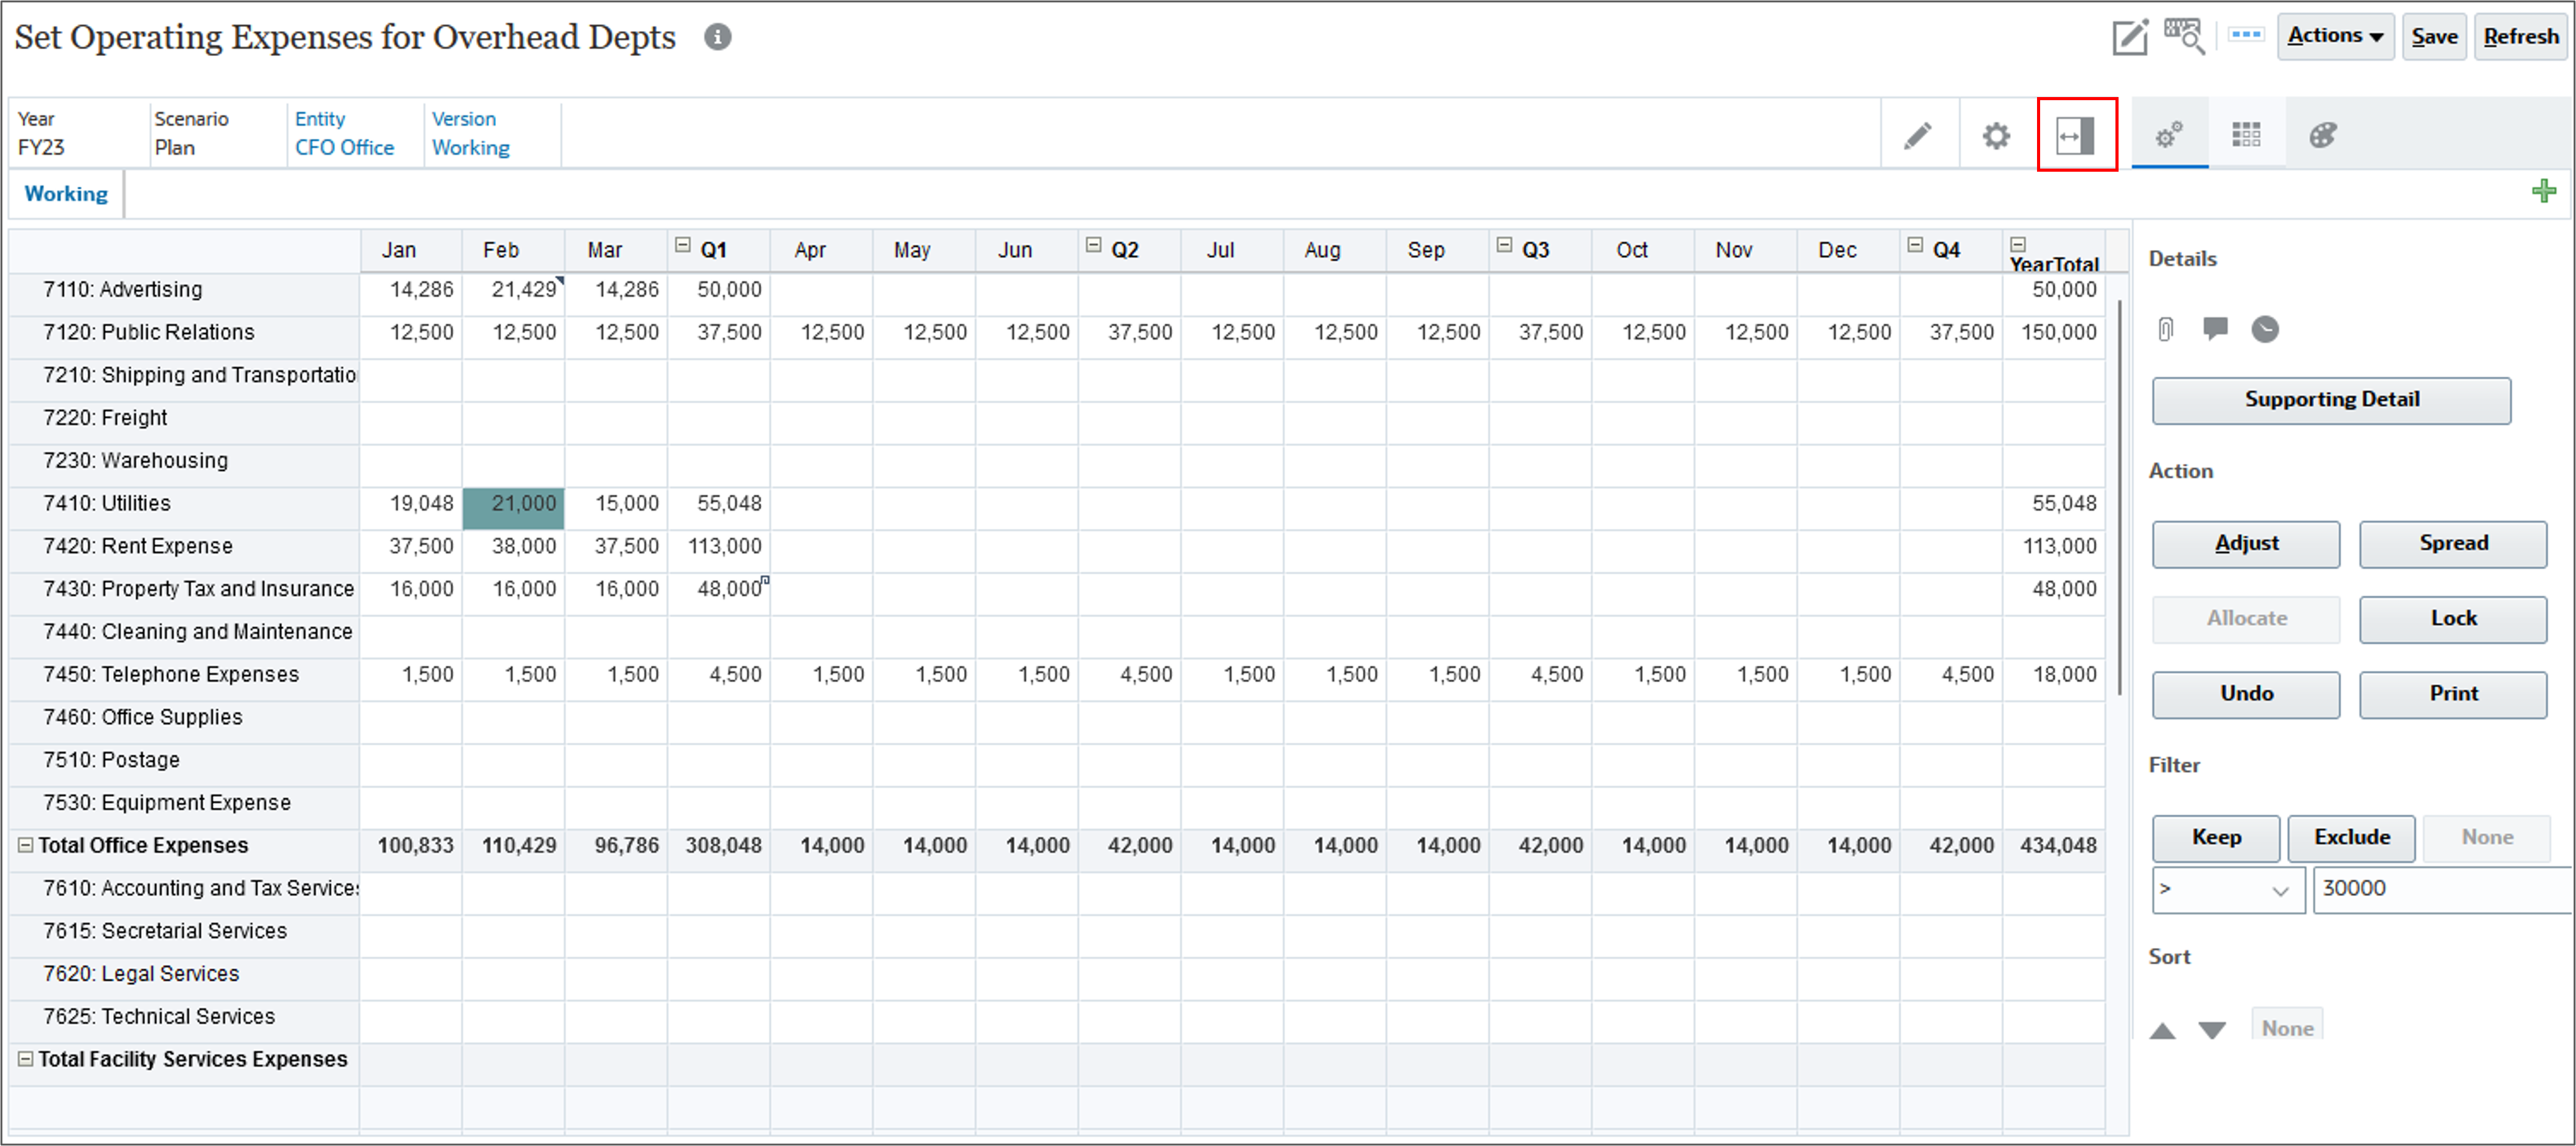
- Click (Property Panel) to close the designer Panel.
Related Links
Adjusting Forecasts in Planning
F92480-01
February, 2024
Copyright © 2024, Oracle and/or its affiliates.