Introduction
This 15-minute hands-on tutorial shows you how to plan for revenue and expenses so you can see how business processes impact the bottom line in Financials. You set up assumptions for driver-based, trend-based and direct input accounts in Financials to drive revenue and expenses and to help determine which courses of action are more profitable. Furthermore, you can compare plan vs actual to analyze variances and you can analyze the detailed plans from each business process to determine which are more profitable. The sections build on each other and should be completed sequentially.
Background
Financials delivers tools to help you quickly develop plans and forecasts, and generate core financial statements such as balance sheets, cash flow statements, and income statements for internal analysis. Financials provides these components that you can enable incrementally to best meet your business needs:
- Revenue / Gross Margin
- Expense
- Balance Sheet
- Cash Flow
- Income Statement
- Analysis
Financials provides a framework that uses driver-based, trend-based, and direct-input accounts that fully integrate with your income statement, balance sheet, and cash flow statements.
You leverage the data on the income statement, specifically your plans for revenue and expenses, to determine the more profitable courses of action.
Prerequisites
Cloud EPM Hands-on Tutorials may require you to import a snapshot into your Cloud EPM Enterprise Service instance. Before you can import a tutorial snapshot, you must request another Cloud EPM Enterprise Service instance or remove your current application and business process. The tutorial snapshot will not import over your existing application or business process, nor will it automatically replace or restore the application or business process you are currently working with.
Before starting this tutorial, you must:
- Have Service Administrator access to a Cloud EPM Enterprise Service instance. The instance should not have a business process created.
- If you haven't already, register for a free Oracle Cloud Customer Connect account so you can
access the required files.
- Download the latest EPBCS Sample Application LCM snapshot from this idea page.
- Upload and import the latest EPBCS Sample Application LCM snapshot into your Planning instance.
Note:
If you run into migration errors importing the snapshot, re-run the migration excluding the HSS-Shared Services component, as well as the Security and User Preferences artifacts in the Core component. For more information on uploading and importing snapshots, refer to the Administering Migration for Oracle Enterprise Performance Management Cloud documentation.
Setting up the Planning environment
Before you can open dashboards and forms, you must set values for user variables.
Note:
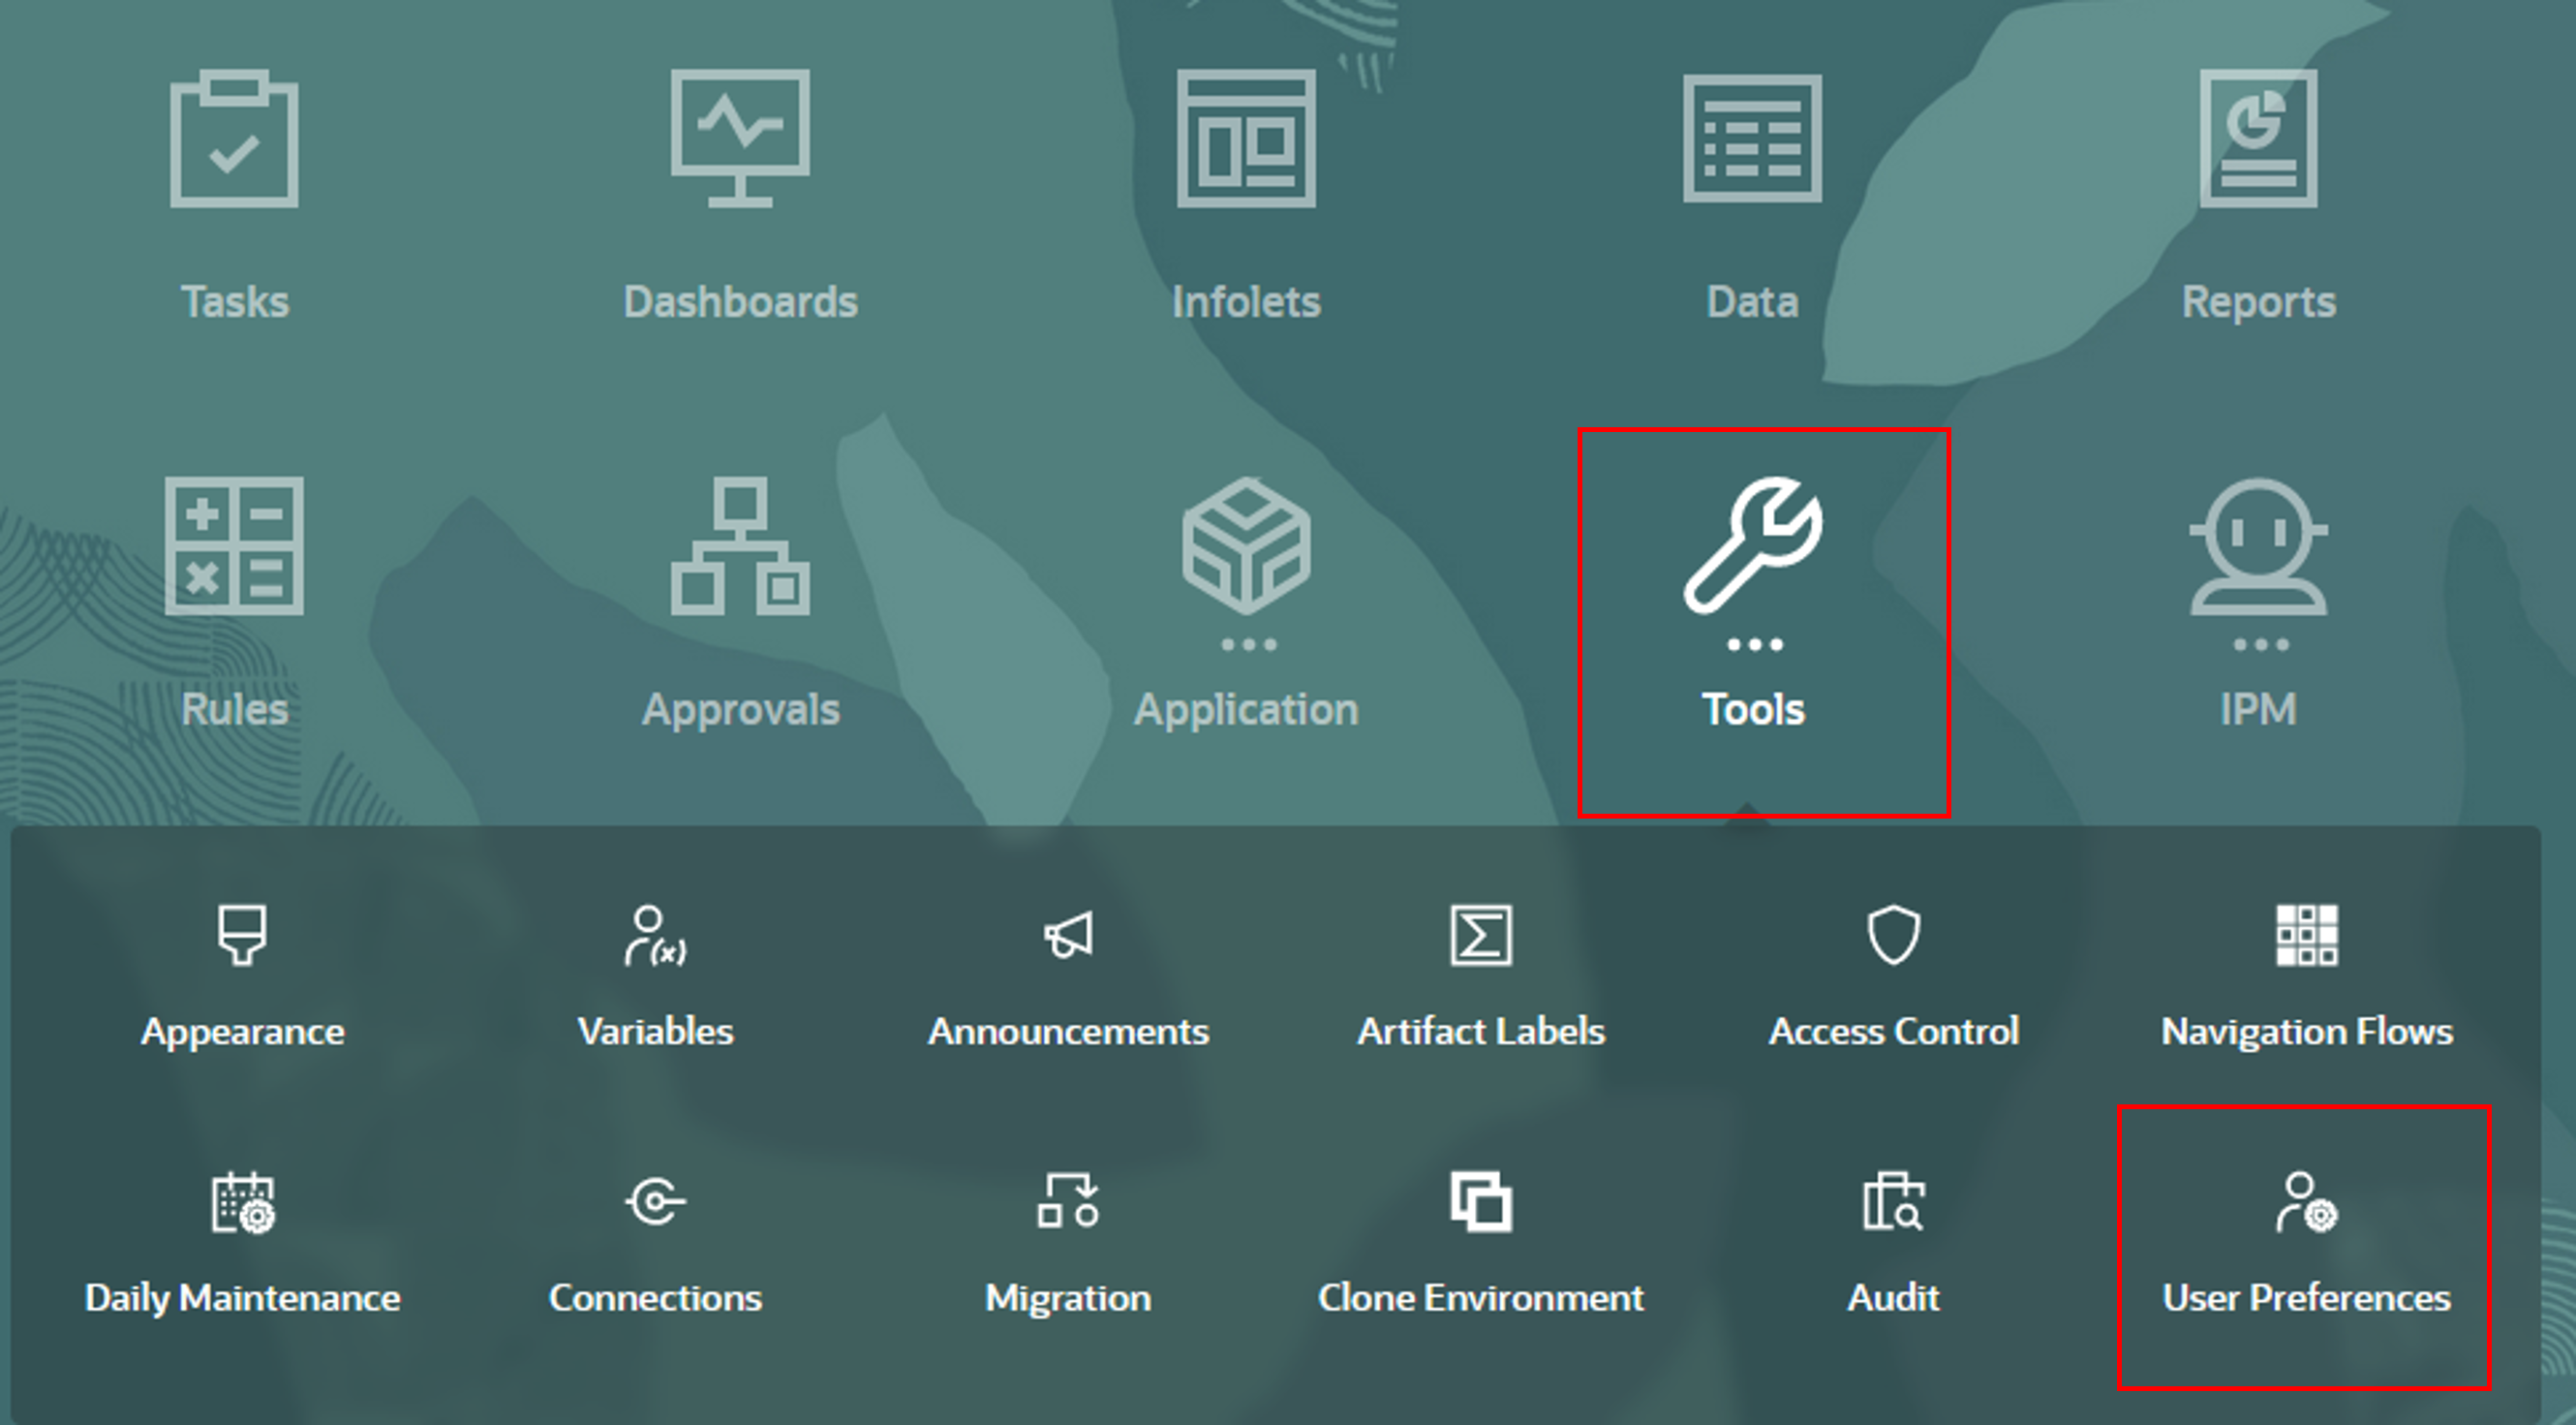
User Variables were added when the business process was created. User variables act as filters in forms, enabling planners to focus only on certain members.- On the Planning home page, click Tools, then User Preferences.
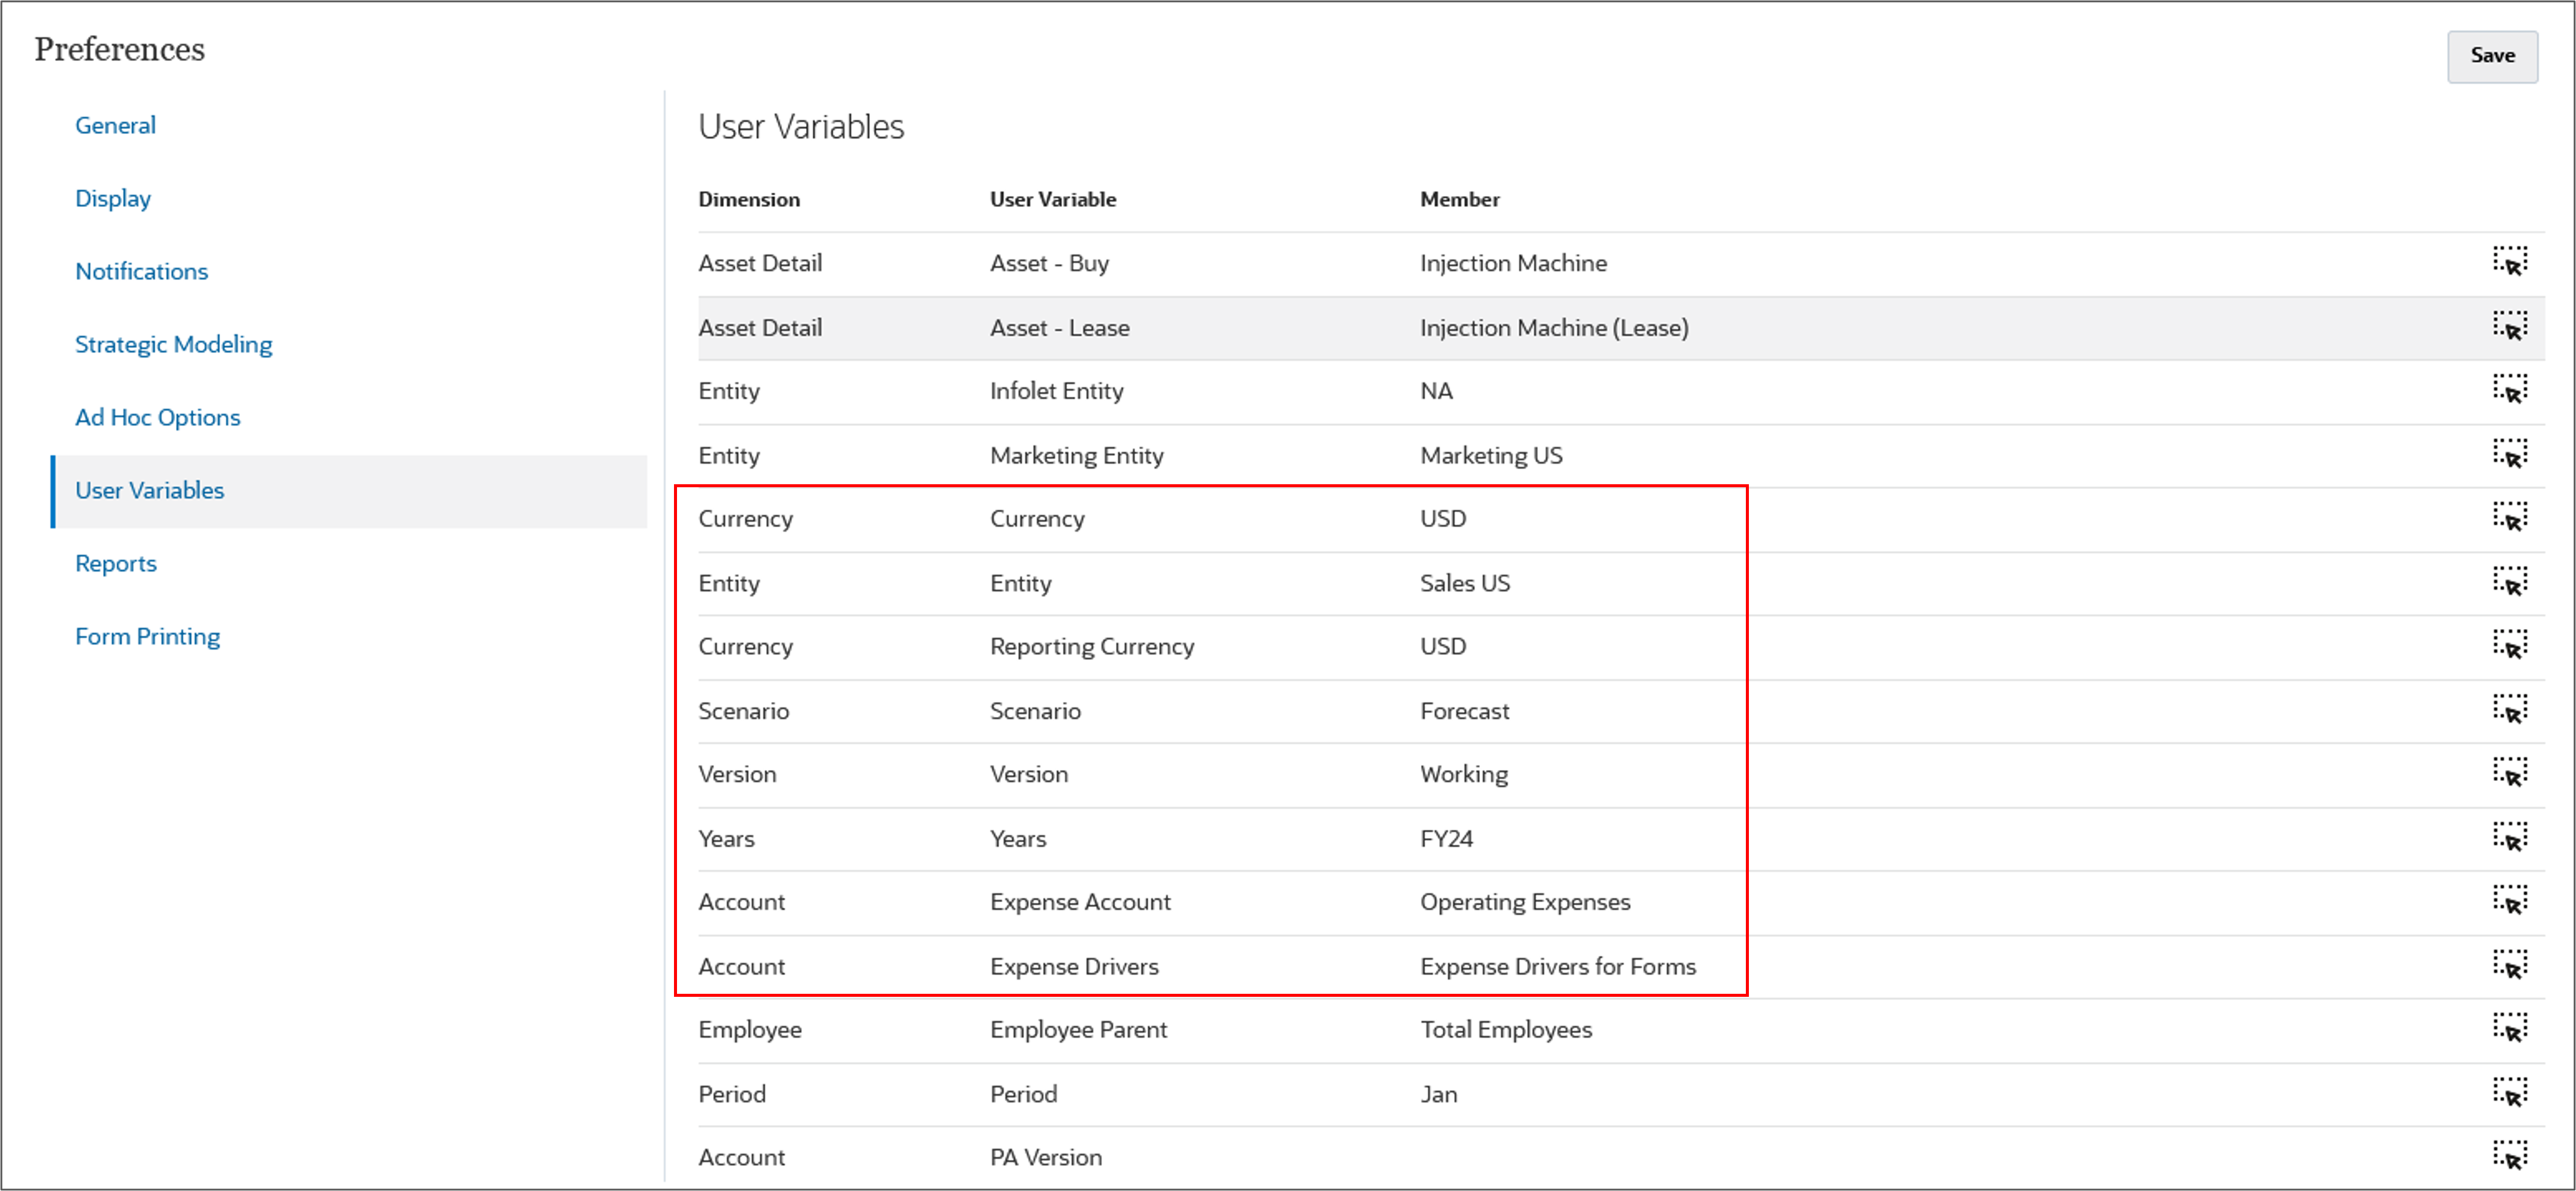
- Under Preferences, click User Variables.
- For each variable click its "Member selector" icon (
 ) to set the variable's value as specified below:
 - Currency: USD
- Entity: Sales US
- Reporting Currency: USD
- Scenario: Forecast
- Version: Working
- Years: FY24
- Expense Account: Operating Expenses
- Expense Drviers: Expense Drivers for Forms
- Click Save.
- When prompted, click OK.
- In the upper right, click
 (Home) to return to the Planning home page.
Planning for driver-based revenue
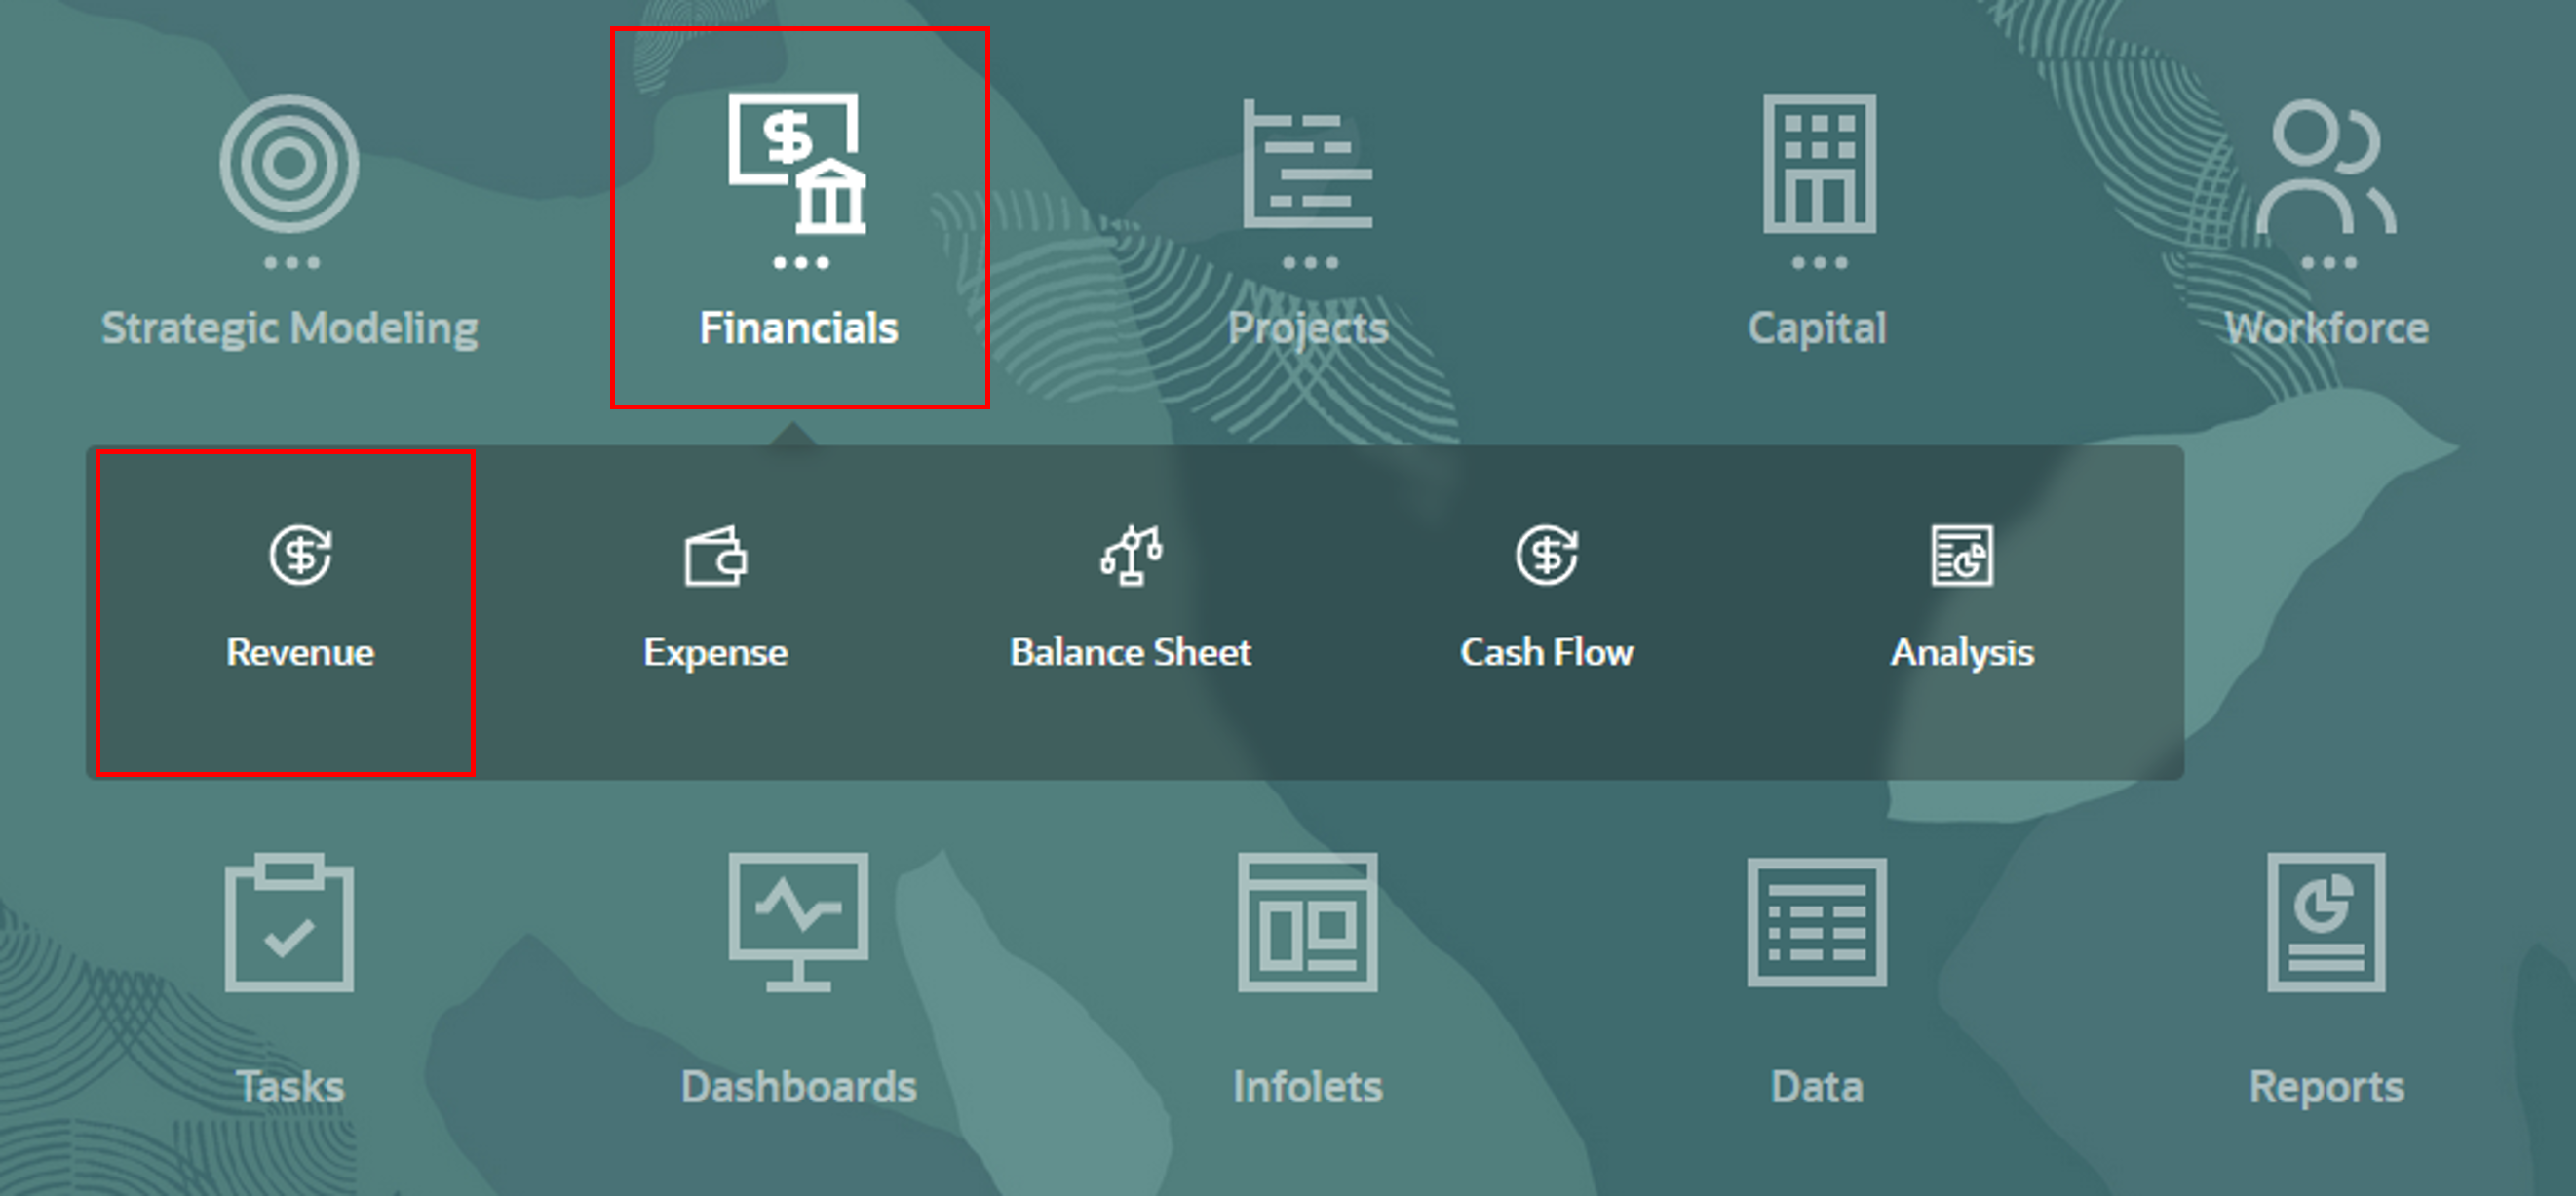
- On the Planning home page, click Financials, then Revenue.
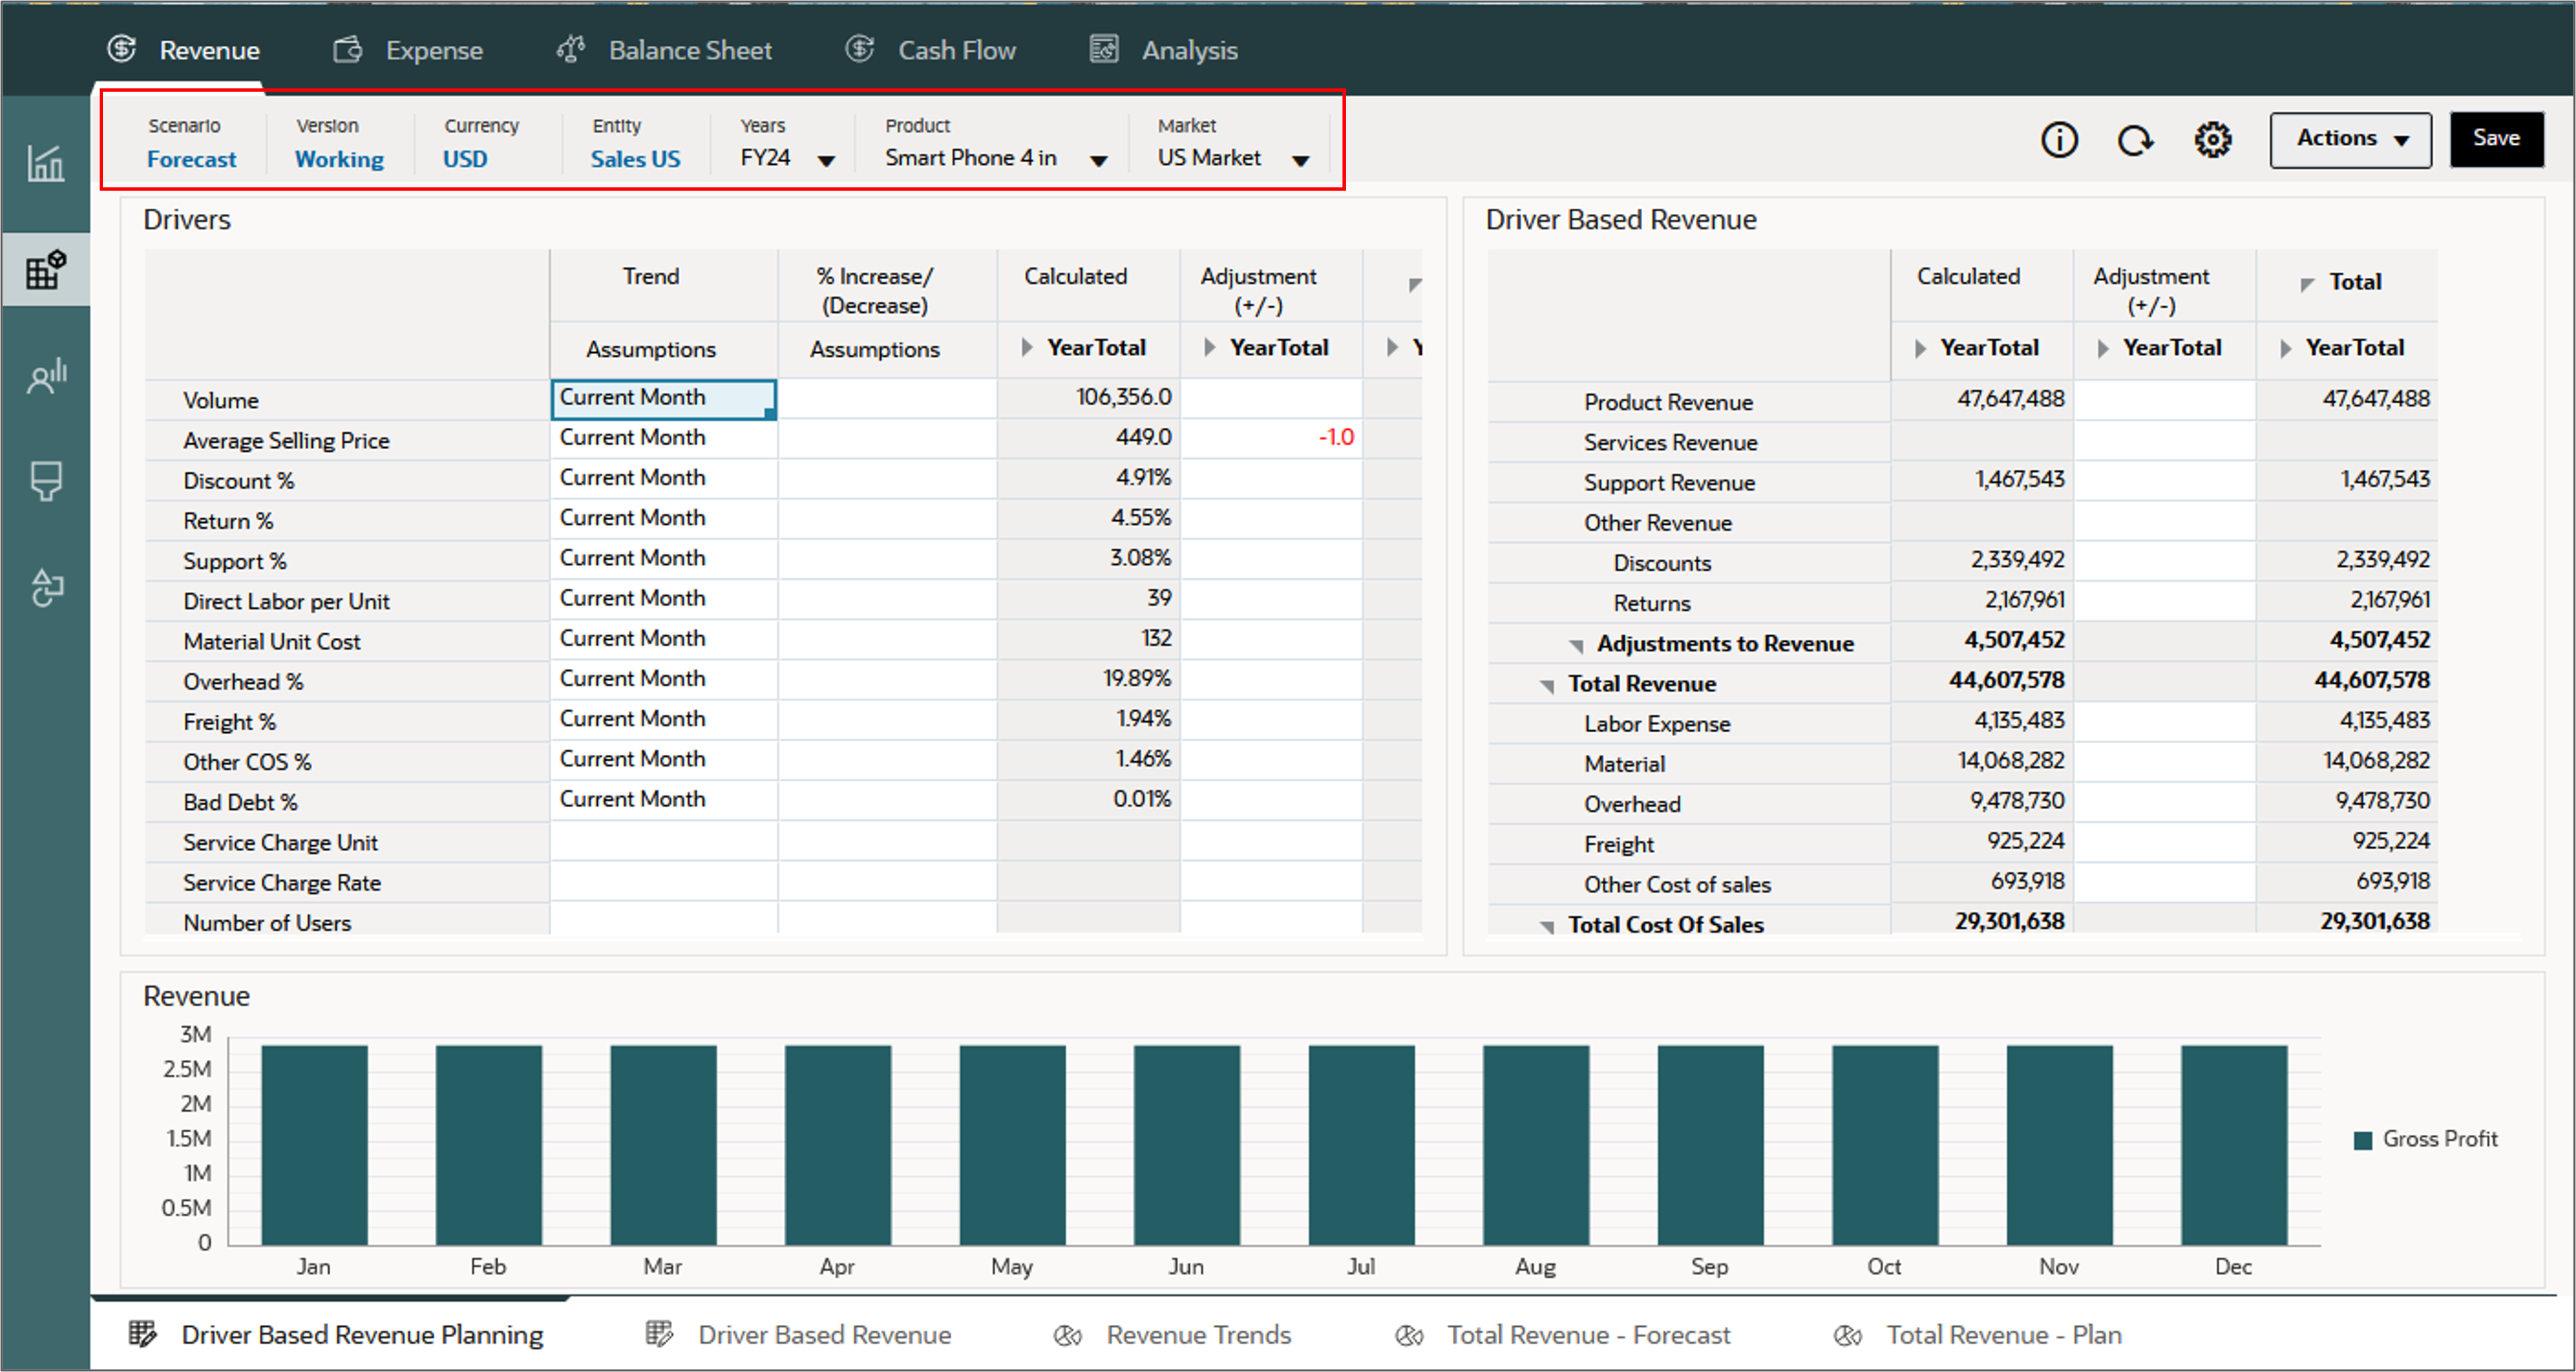
- To the left of the dashboard, click
 (Driver and Trend
Based) and then Driver-based Revenue Planning on the horizontal
tab.
(Driver and Trend
Based) and then Driver-based Revenue Planning on the horizontal
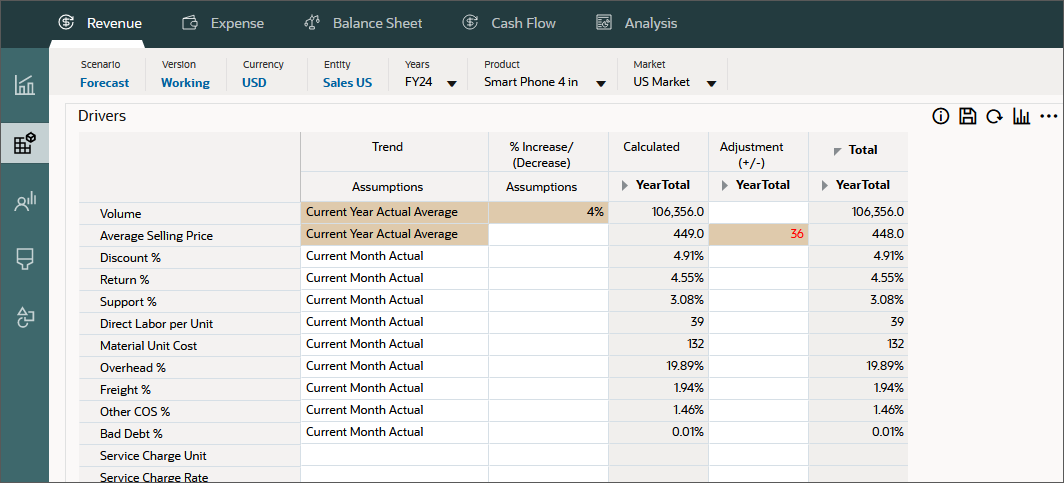
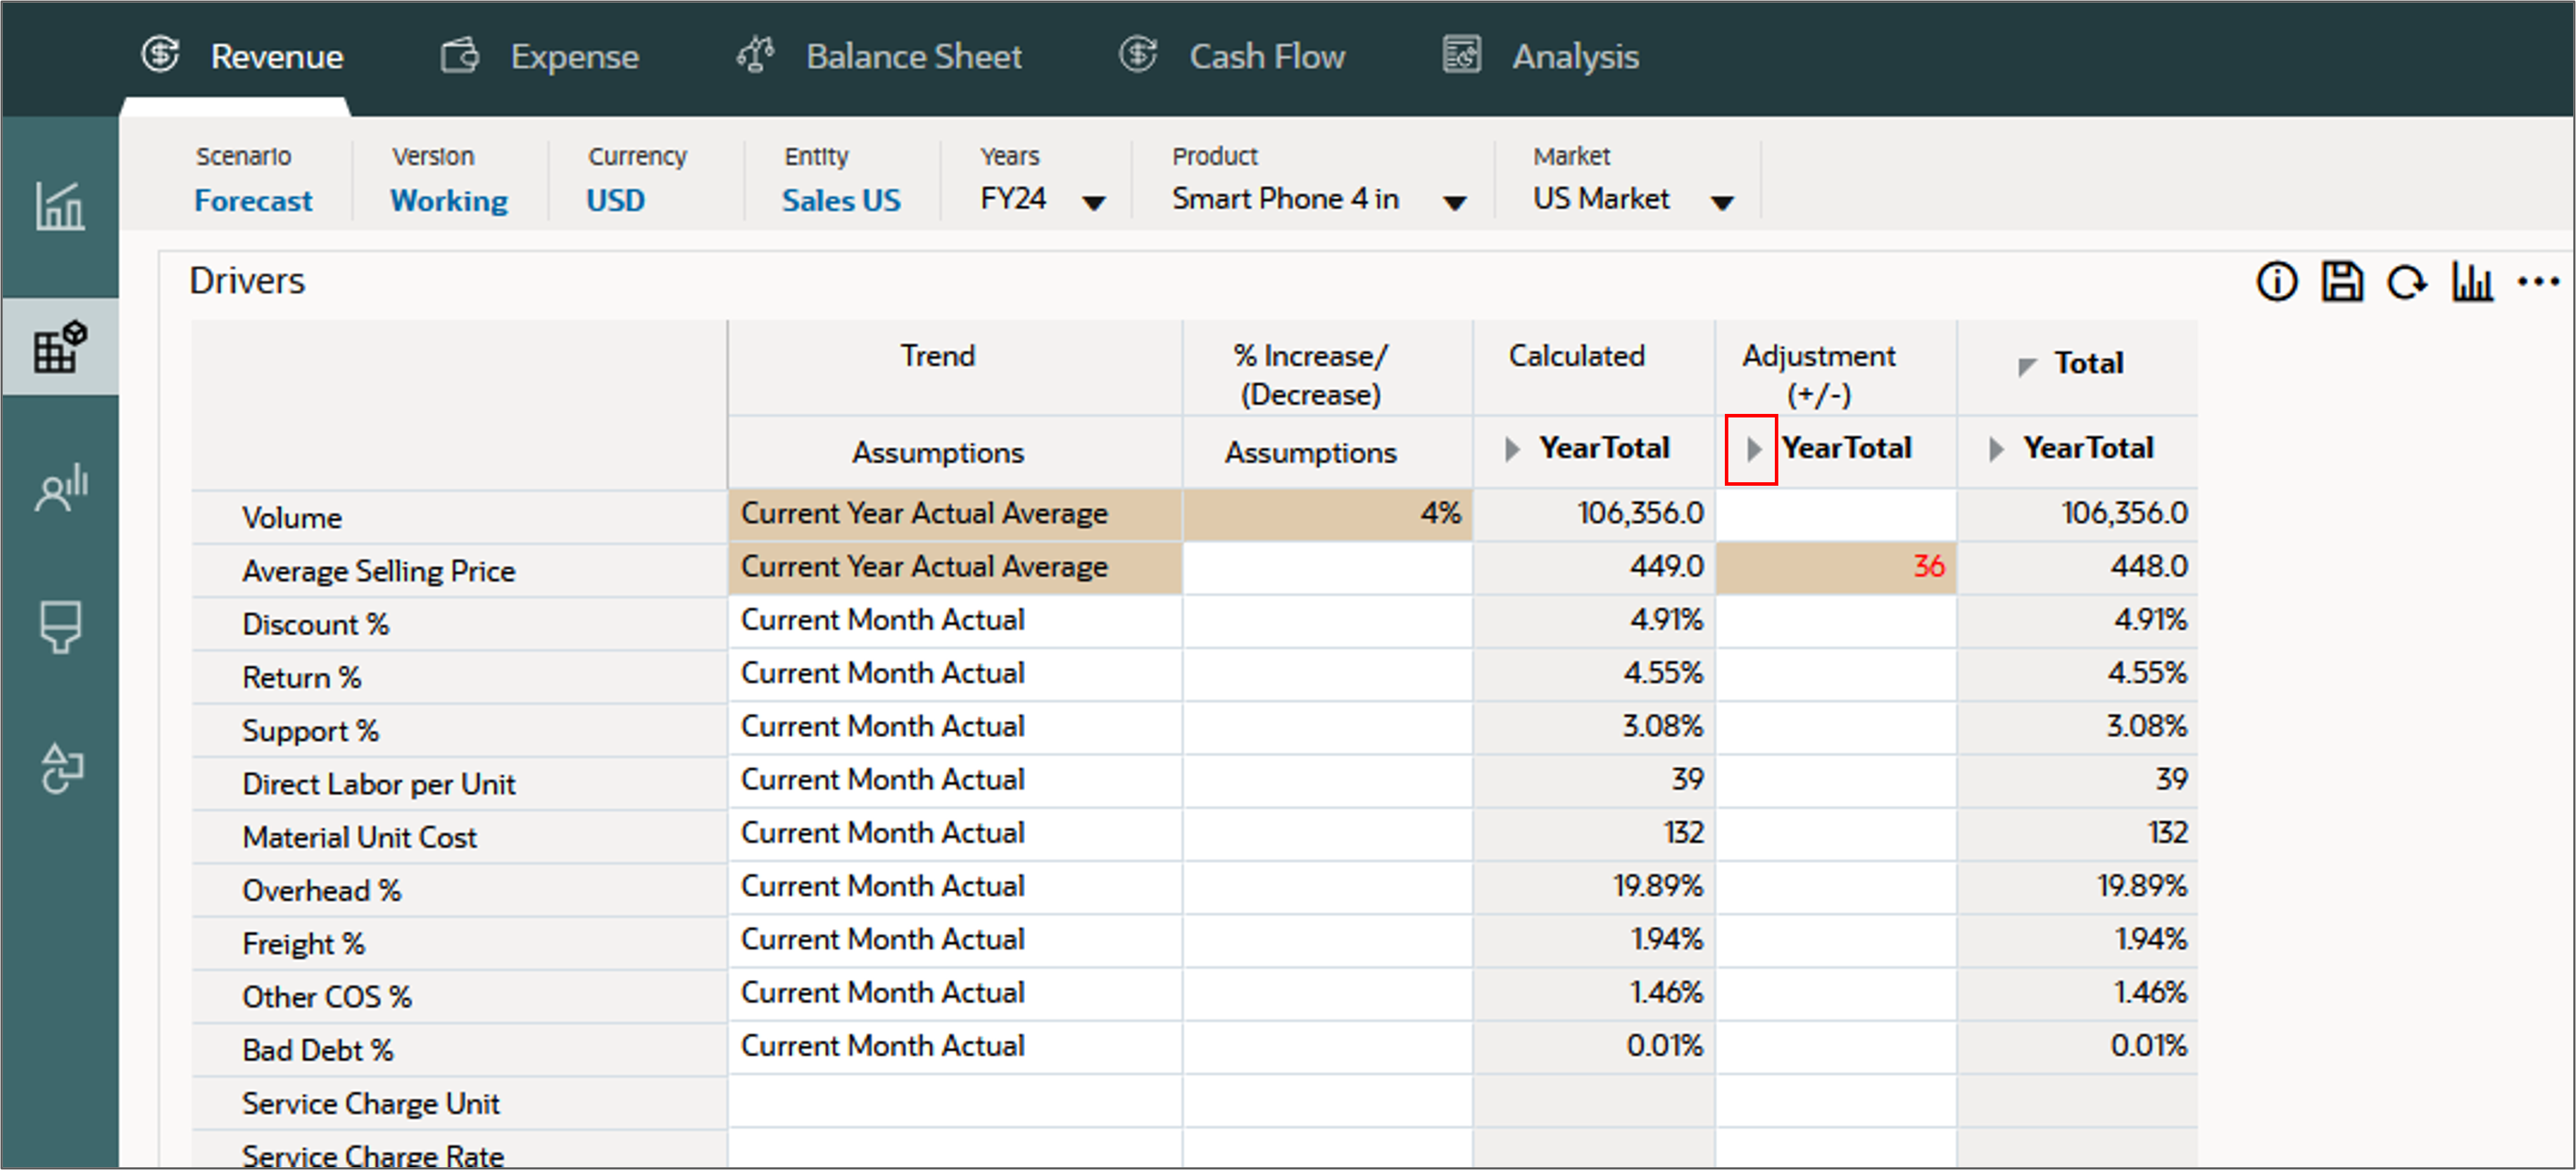
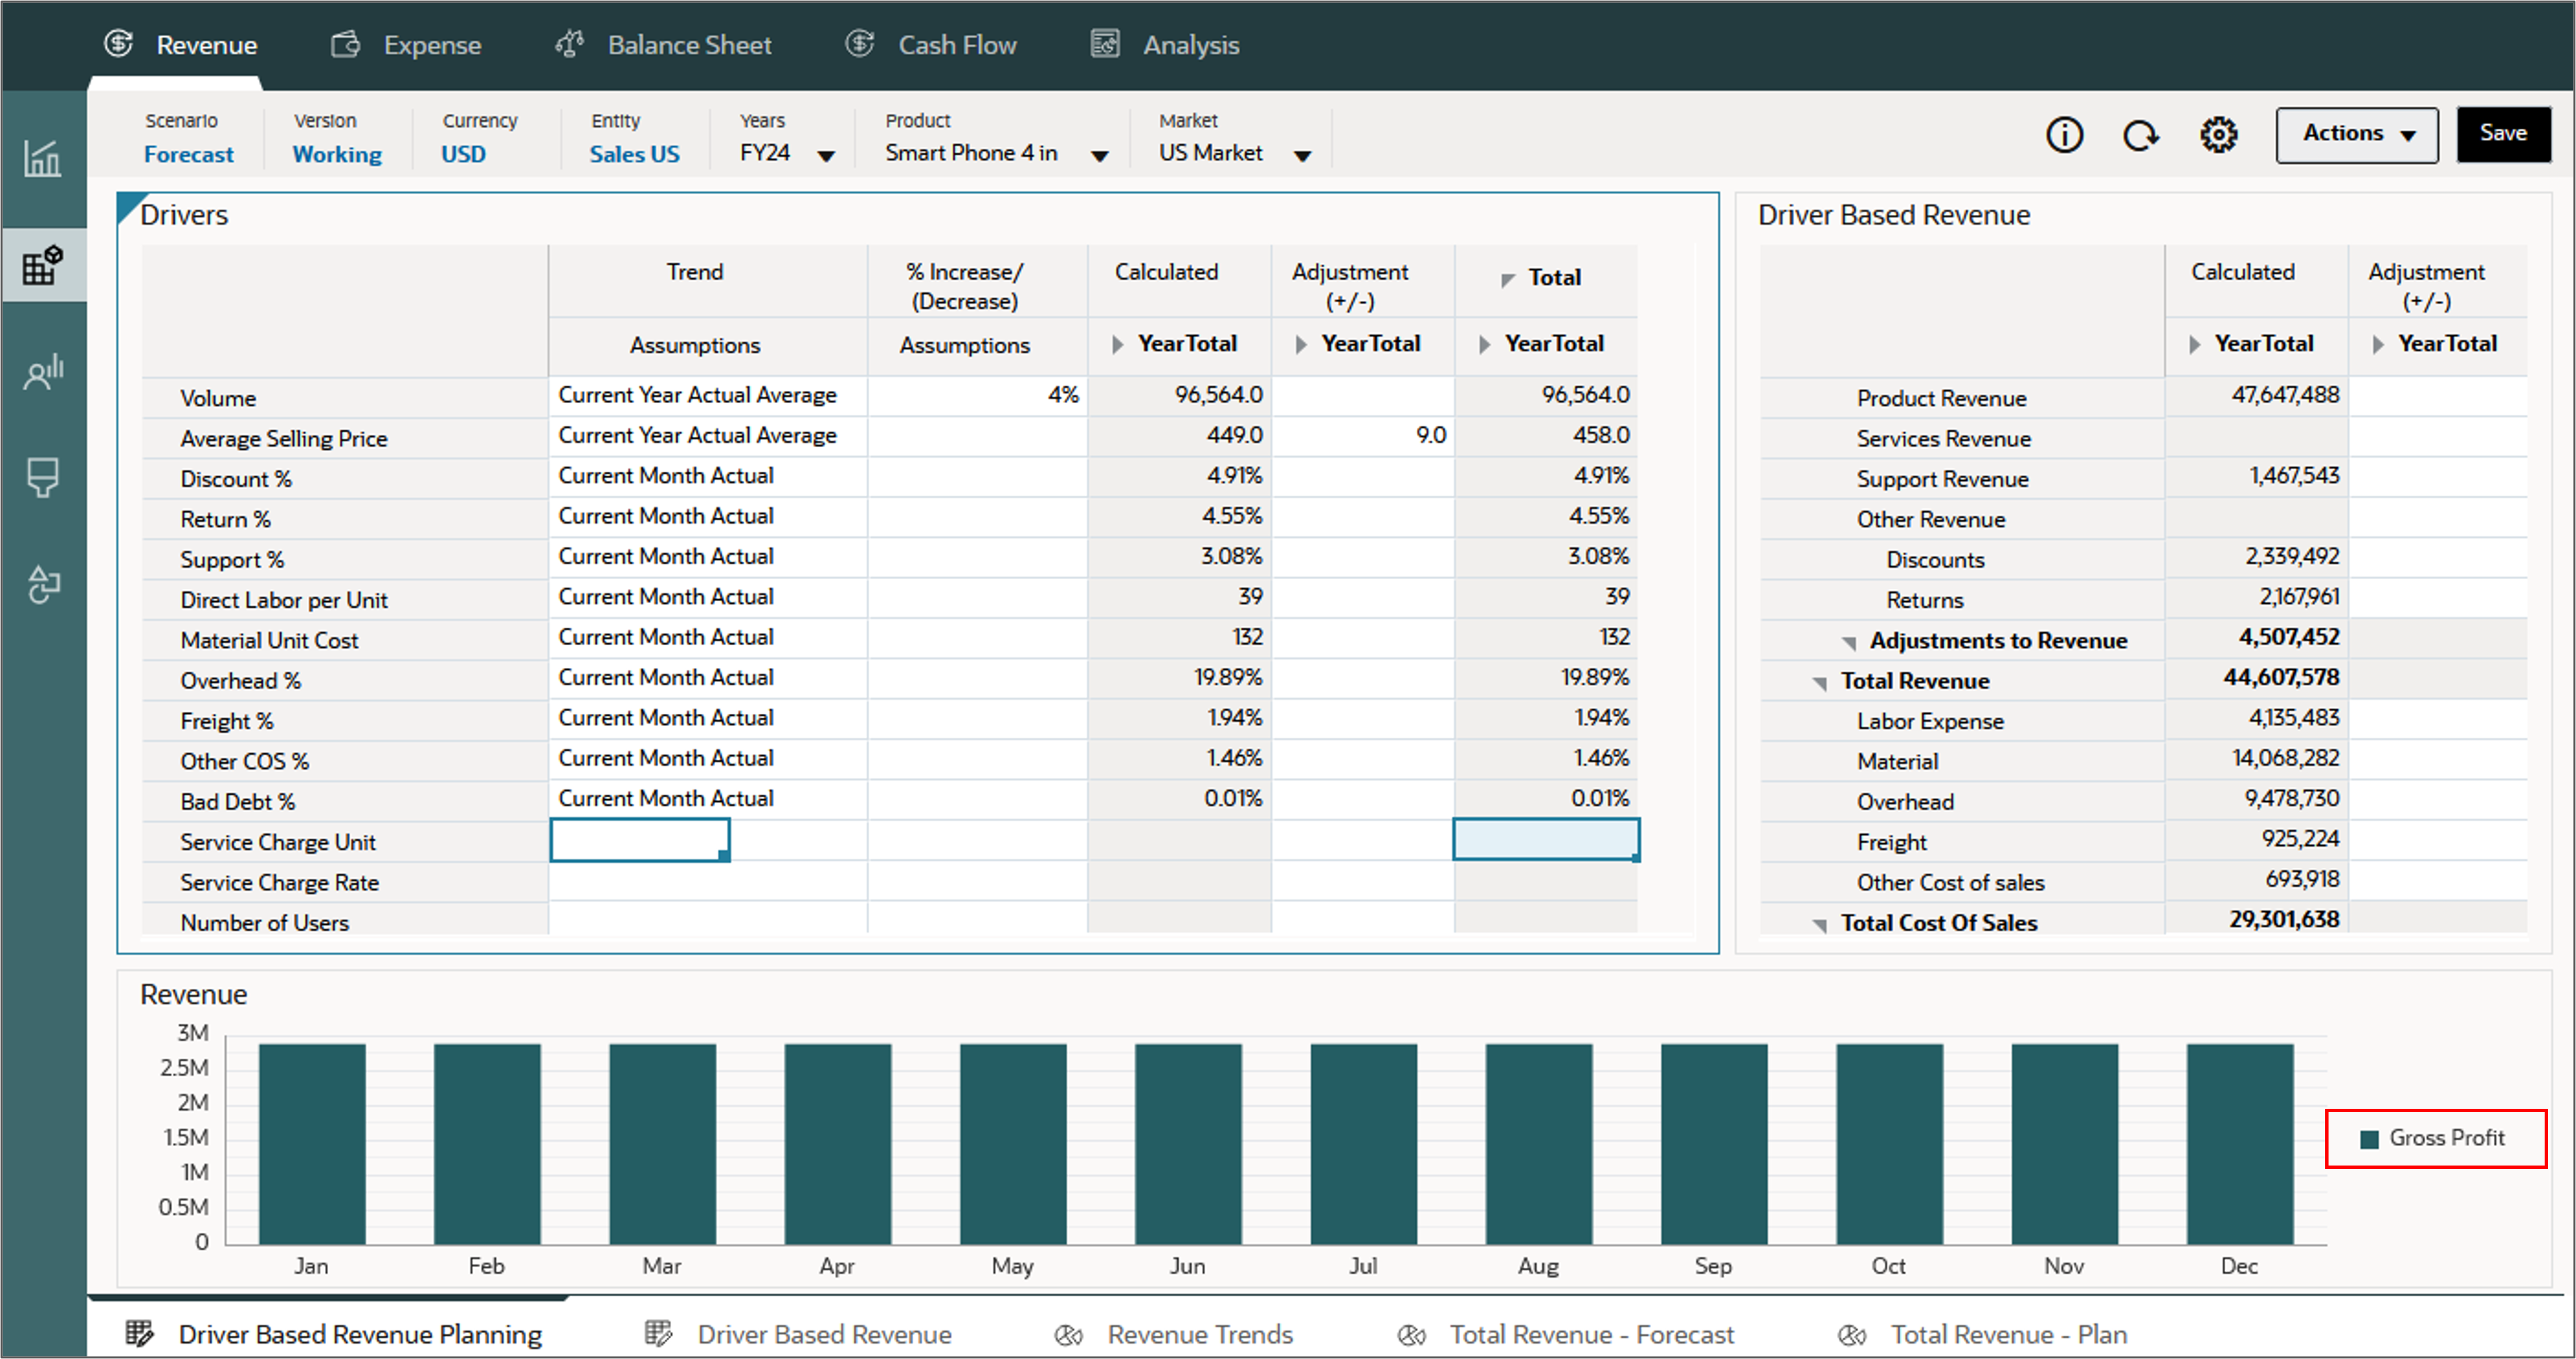
tab. - Ensure that the POV is set to Forecast, Working, USD, Sales US, FY24, Smart Phone 4 in, and US Market.
- For driver-based revenue, you enter assumptions in the "% Increase/(Decrease)" column, and make adjustments in the "Adjustment (+/-)" column. For example, to make a 4% increase in the volume and an additional 36 dollar increase in the average selling price:
- For Volume, set the Trend Assumption to Current Year Actual Average, in the % Increase/Decrease column, enter 4%.
- For Average Selling Price, set the Trend Assumption to Current Year Actual Average, in the Adjustment column, for YearTotal enter 36.
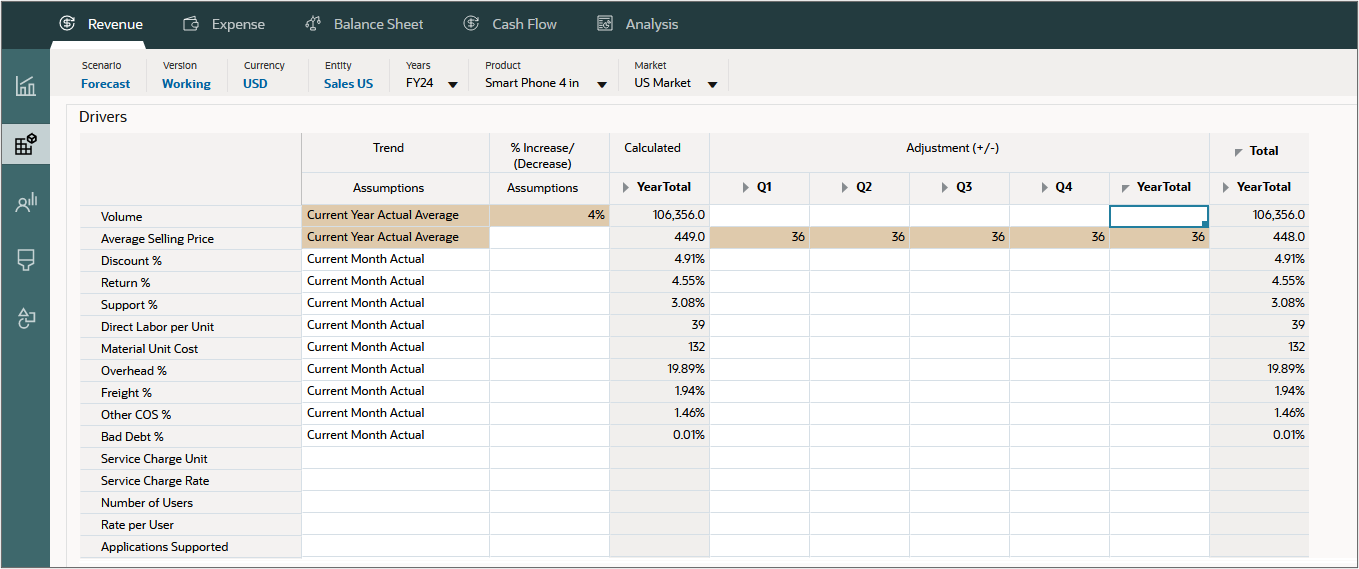
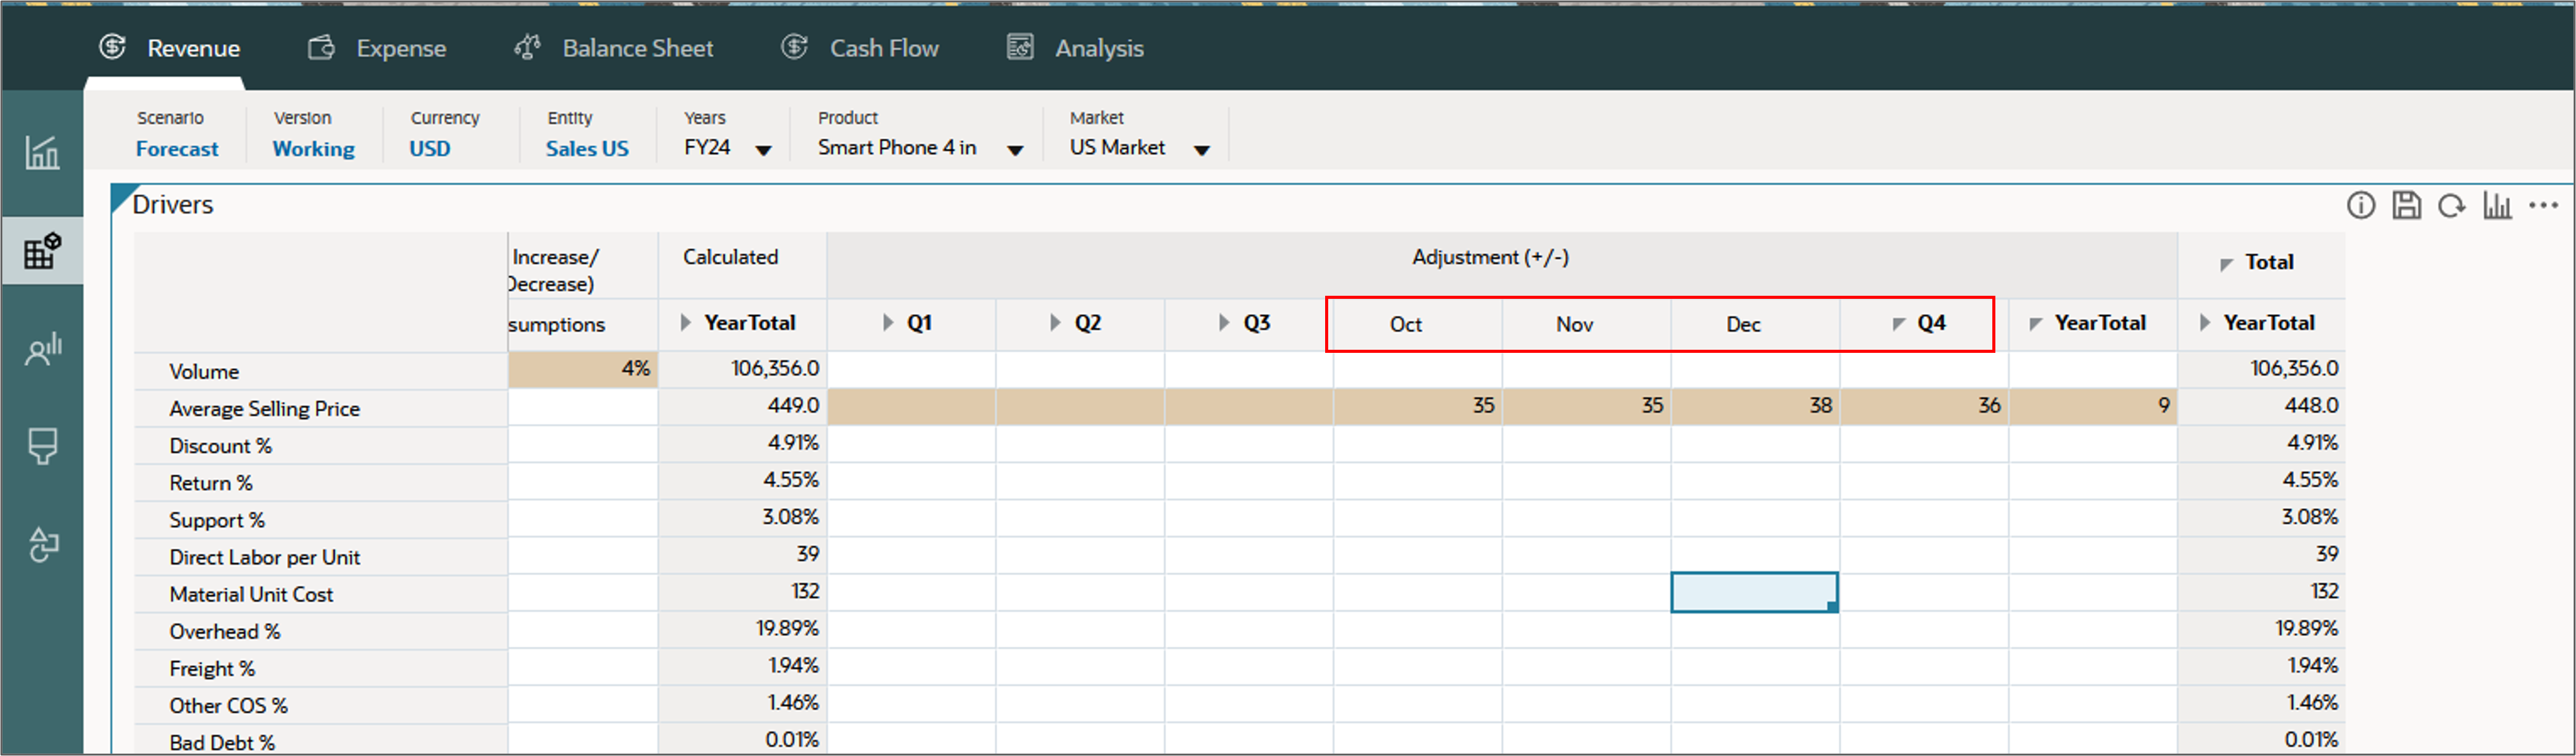
- Expand YearTotal to display quarters.
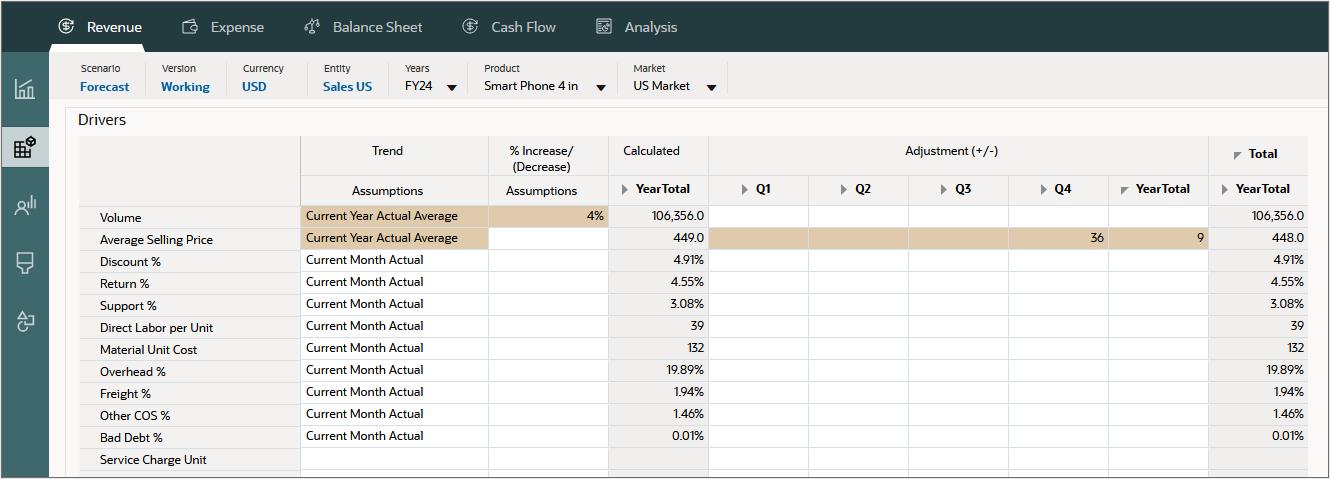
- For example, you can specify that the additional 36 dollar increase in the average selling price will be done in the last three months of the fiscal year. Select YearTotal and delete the value. For Average Selling Price, In Q4, enter an adjustment of 36.
- You can also enter more specific data for each month in Q4. Expand Q4. For Average Selling Price, for Oct and Nov, enter 35, and for Dec enter 38. The average selling price for the quater and year is automatically calculated.
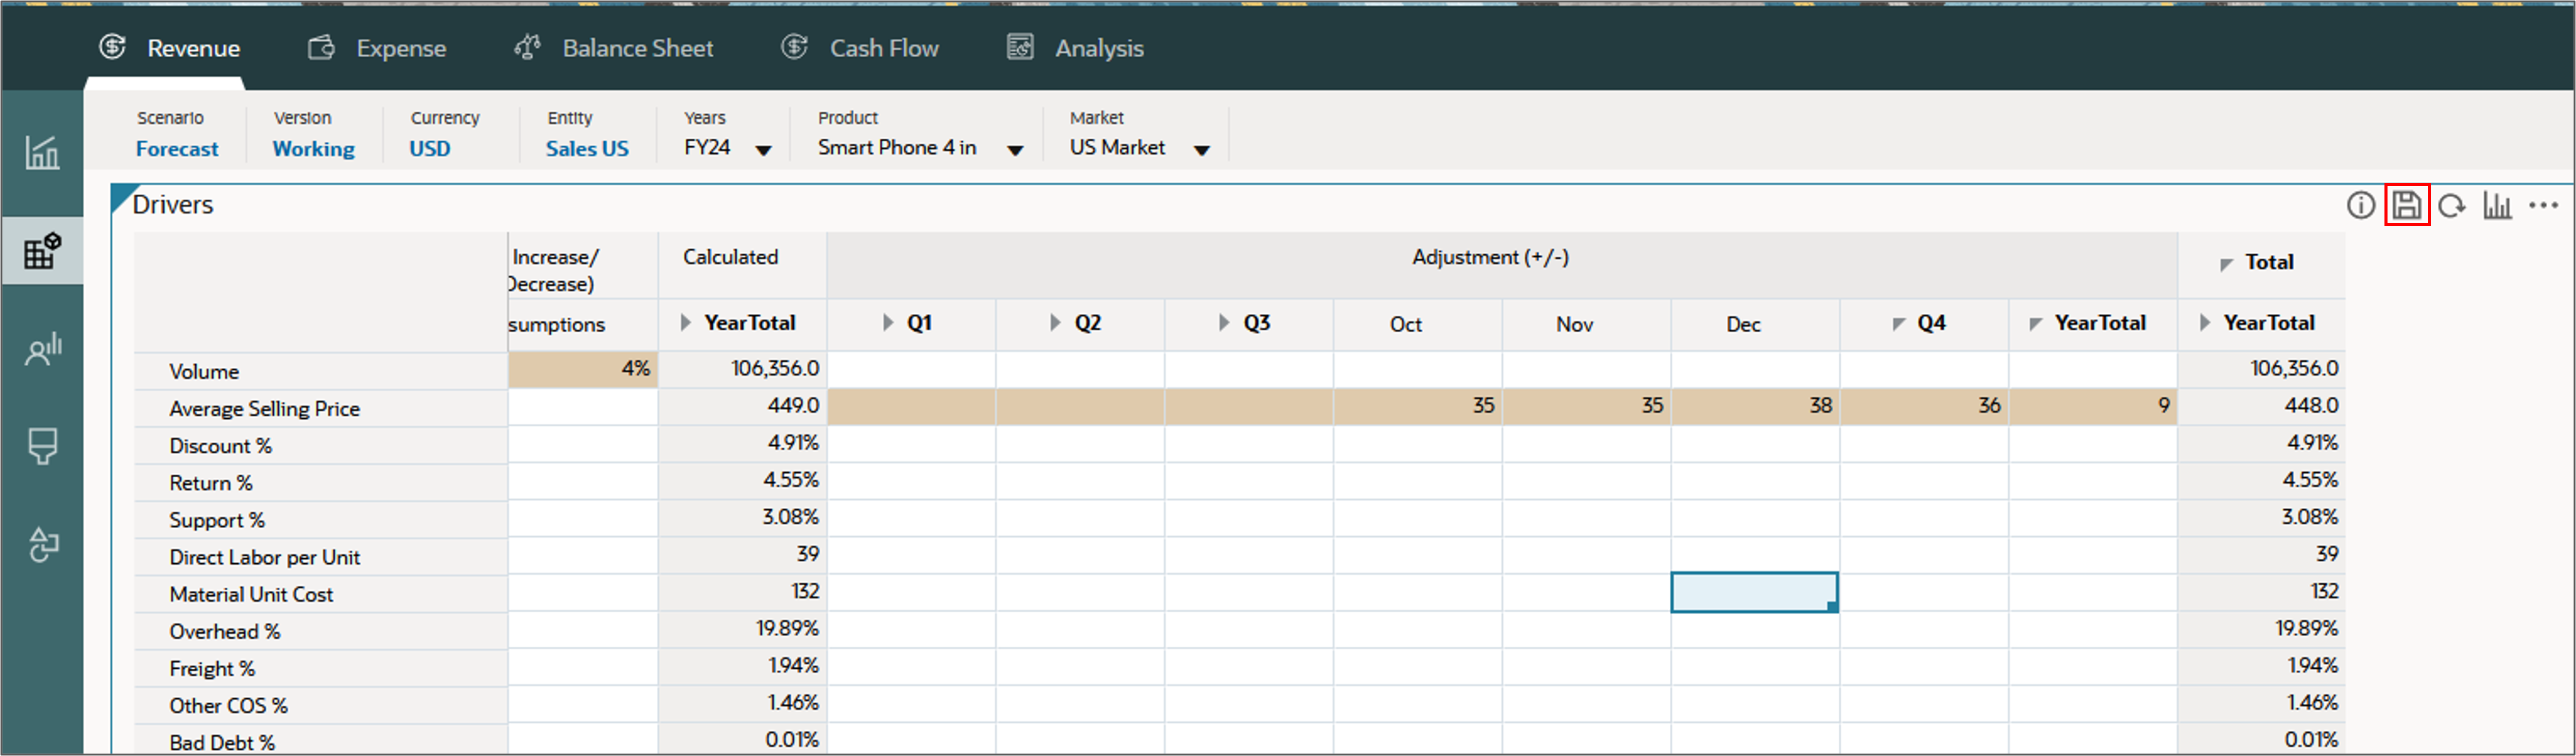
- In the form toolbar (not the dashboard), click
 (Save).
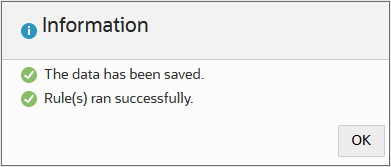
 - In the Information dialog box, click OK.
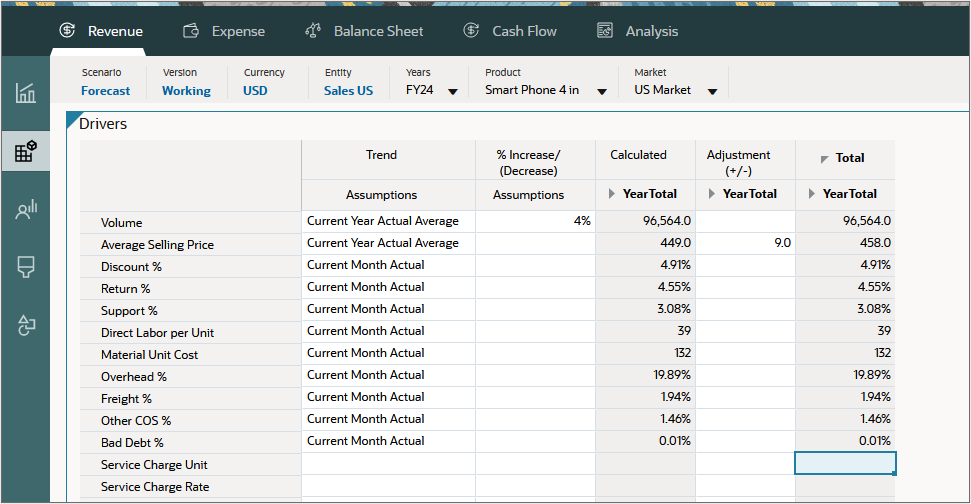
- The calculated total from assumptions based on the prior year’s average plus the 4% increase in volume and year totals are displayed.
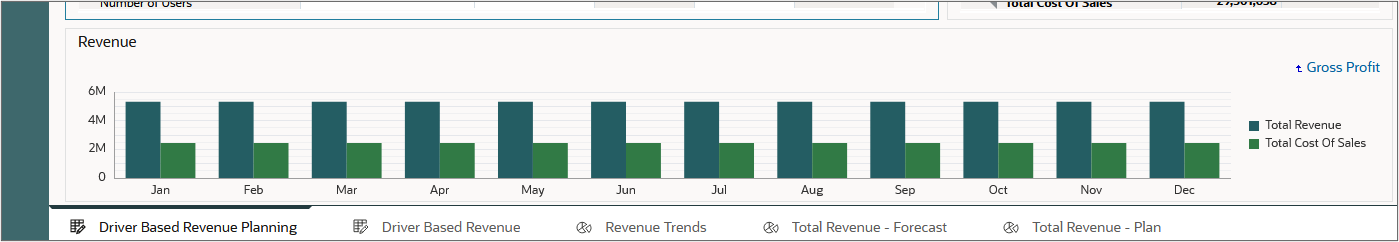
- You can also view the updated calculation in the graph below the data. Click the Gross Profit link to drill down the data.
- The graph shows Total Revenue and Total Cost of Sales for each month.
Now, you can enter adjustments at a more granular level.
Reviewing calculated revenue
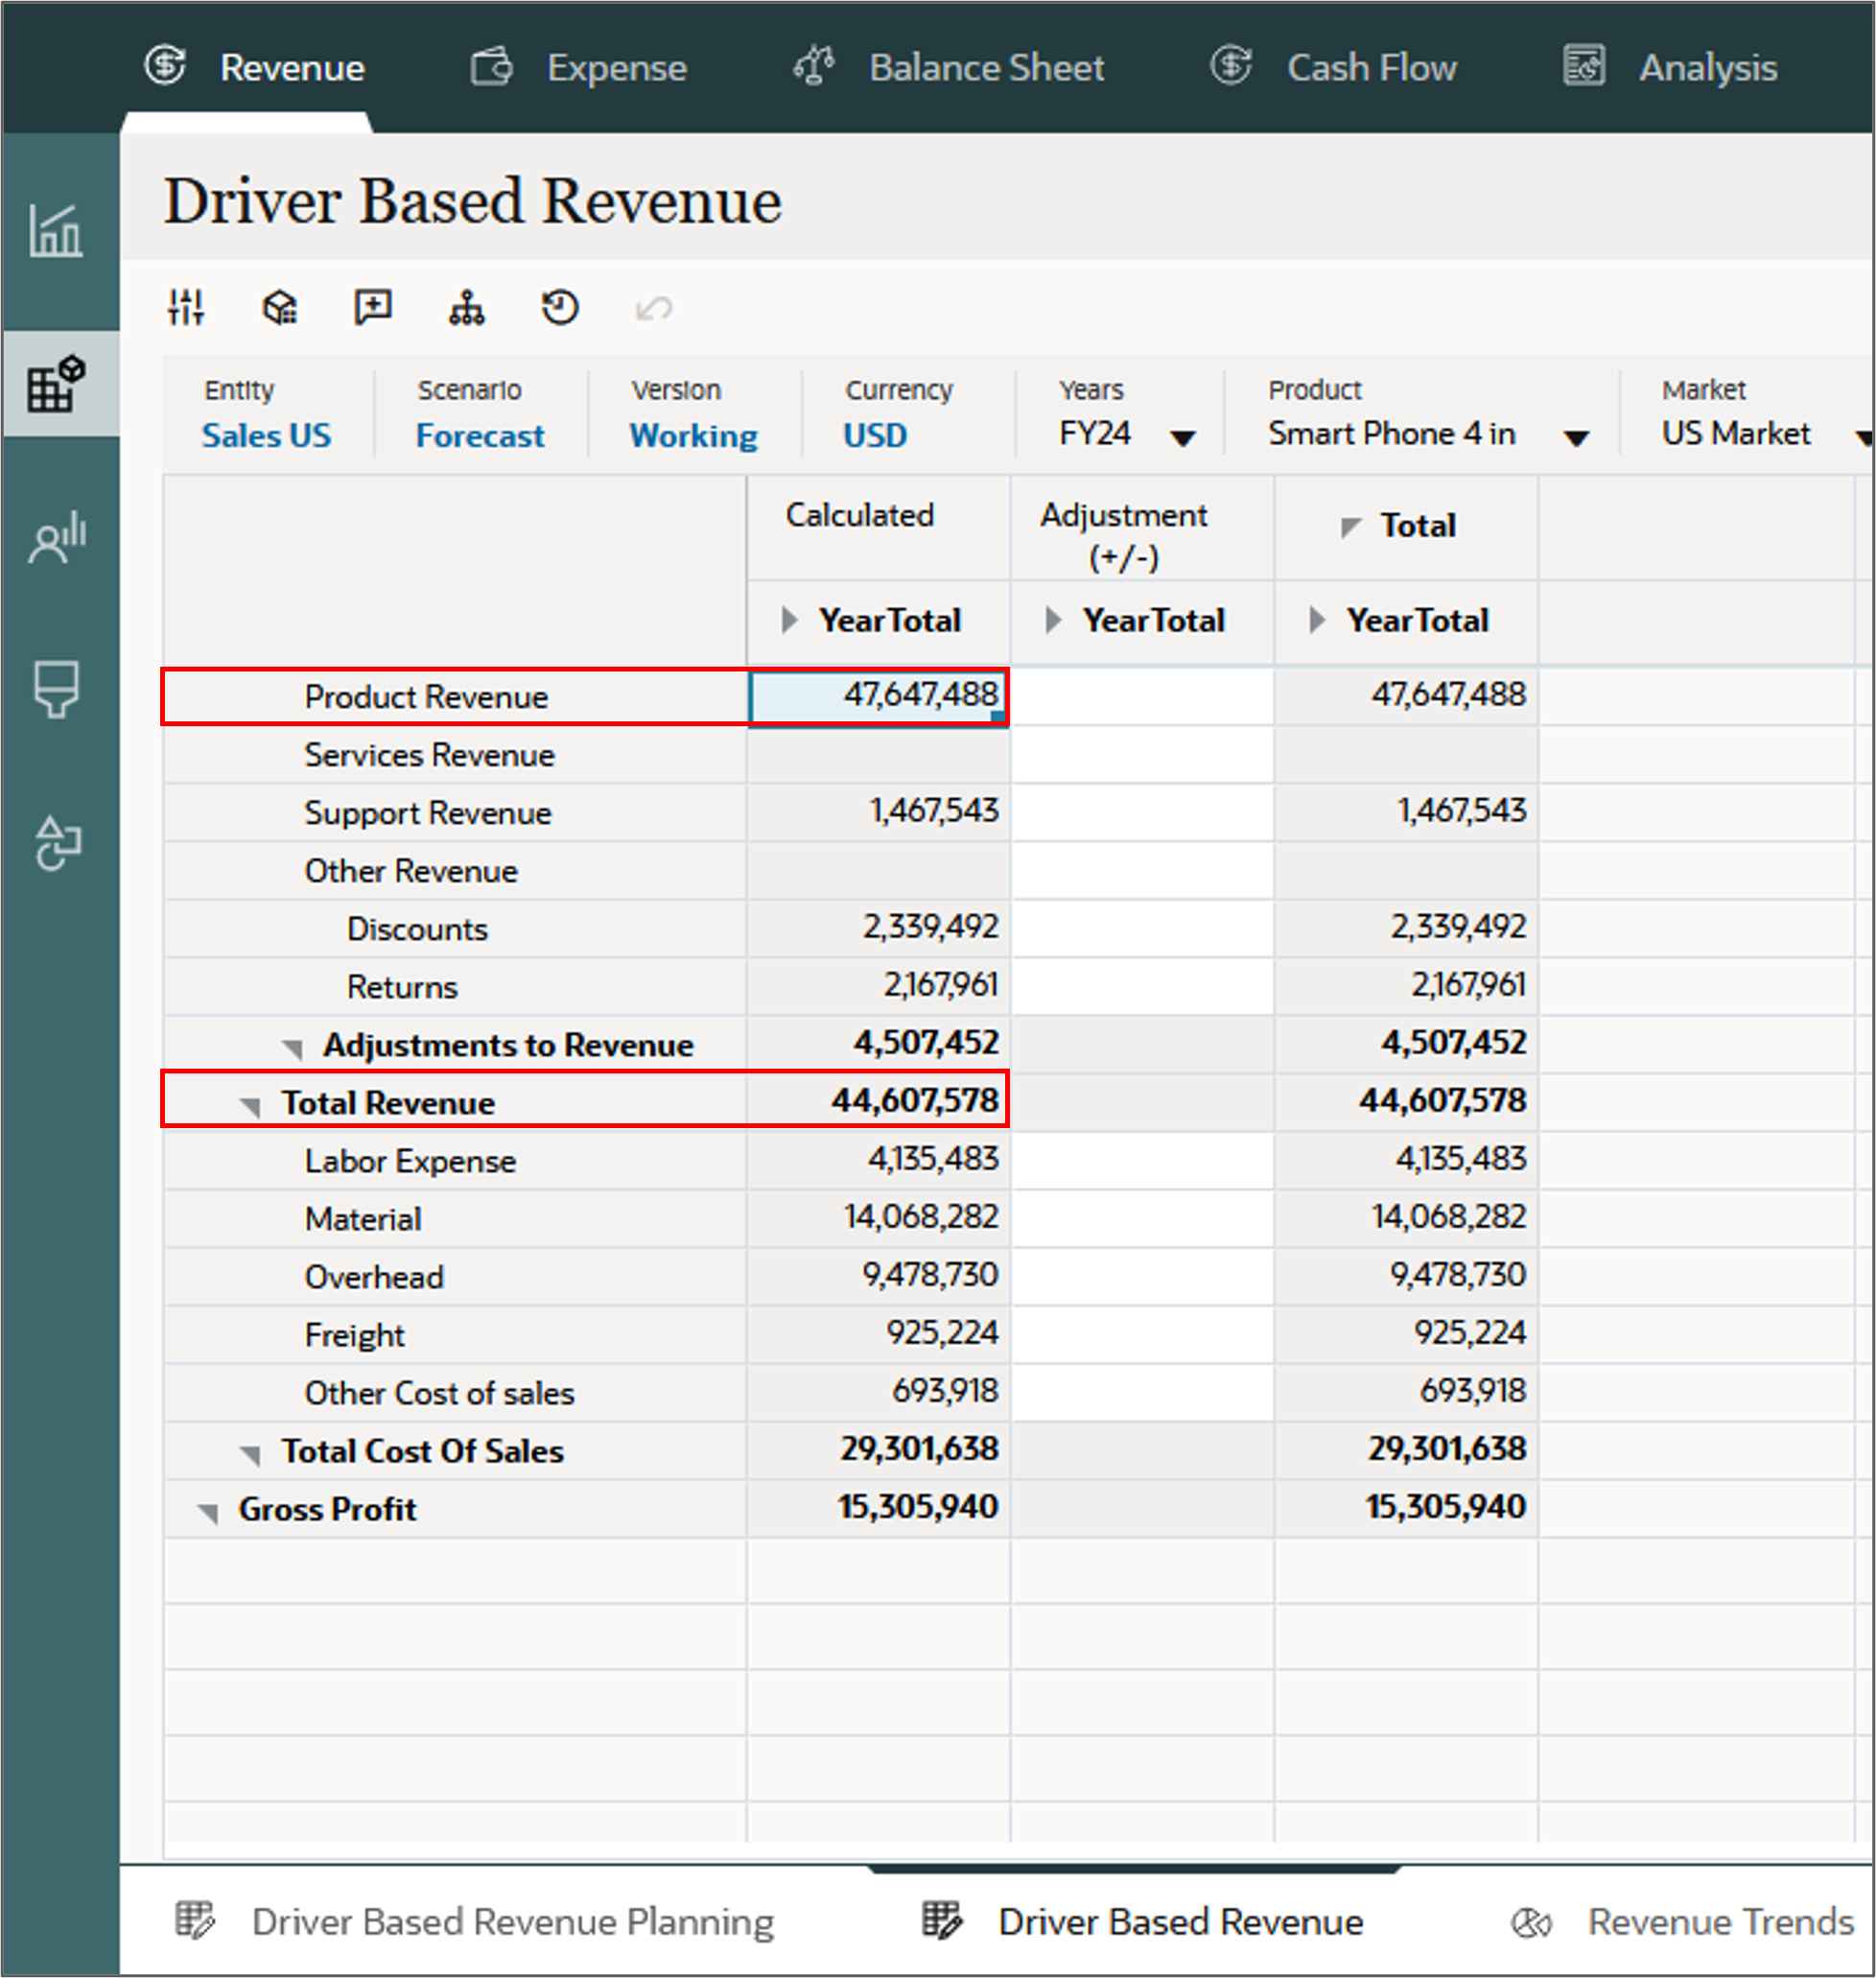
- Click the Driver Based Revenue tab.
- The calculated data based on the data entered on the previous page is displayed for Product Revenue and Total Revenue. You can also enter additional adjustments on this page in the "Adjustment (+/-)" column.
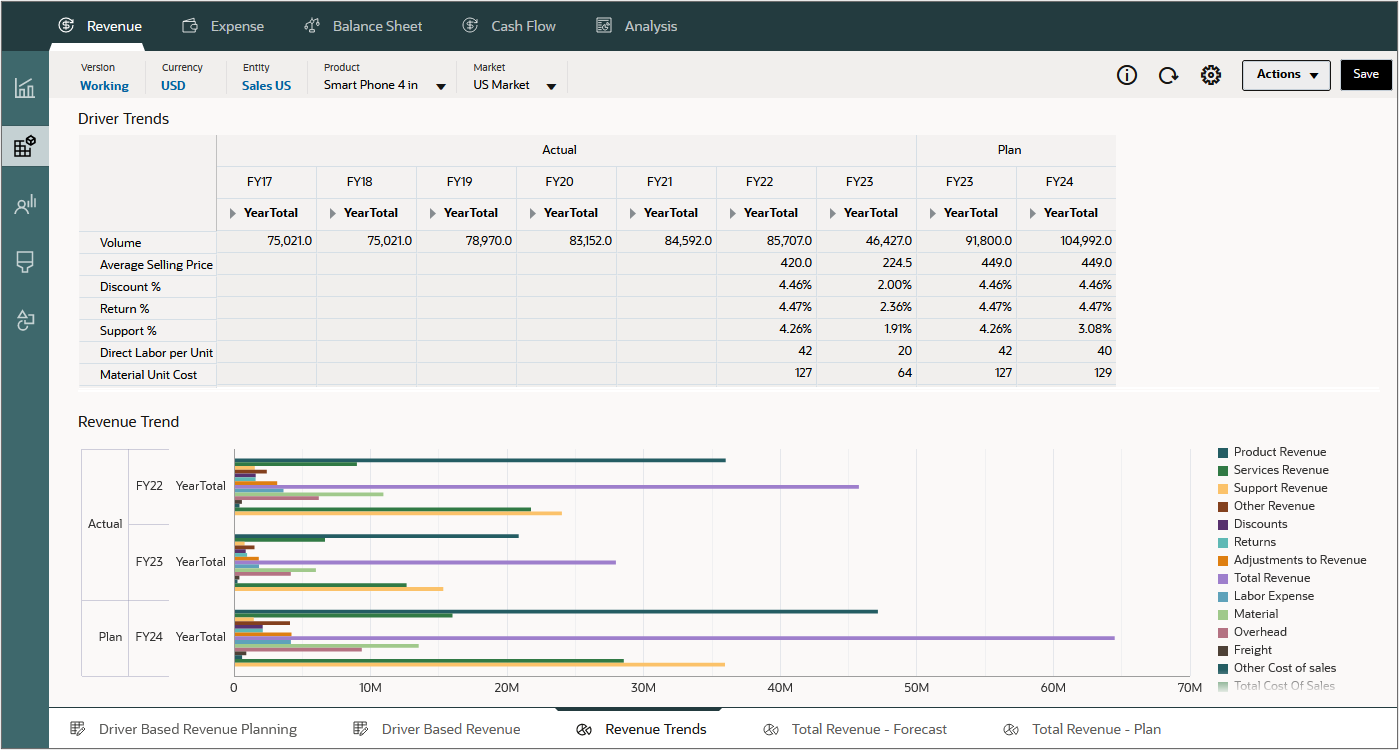
- Click the Revenue Trends tab.
- Revenue Trends displays variances between years, periods, and scenarios. You can find the prior year and current year’s trends on this page. You can create reliable future plans by basing them on trends.
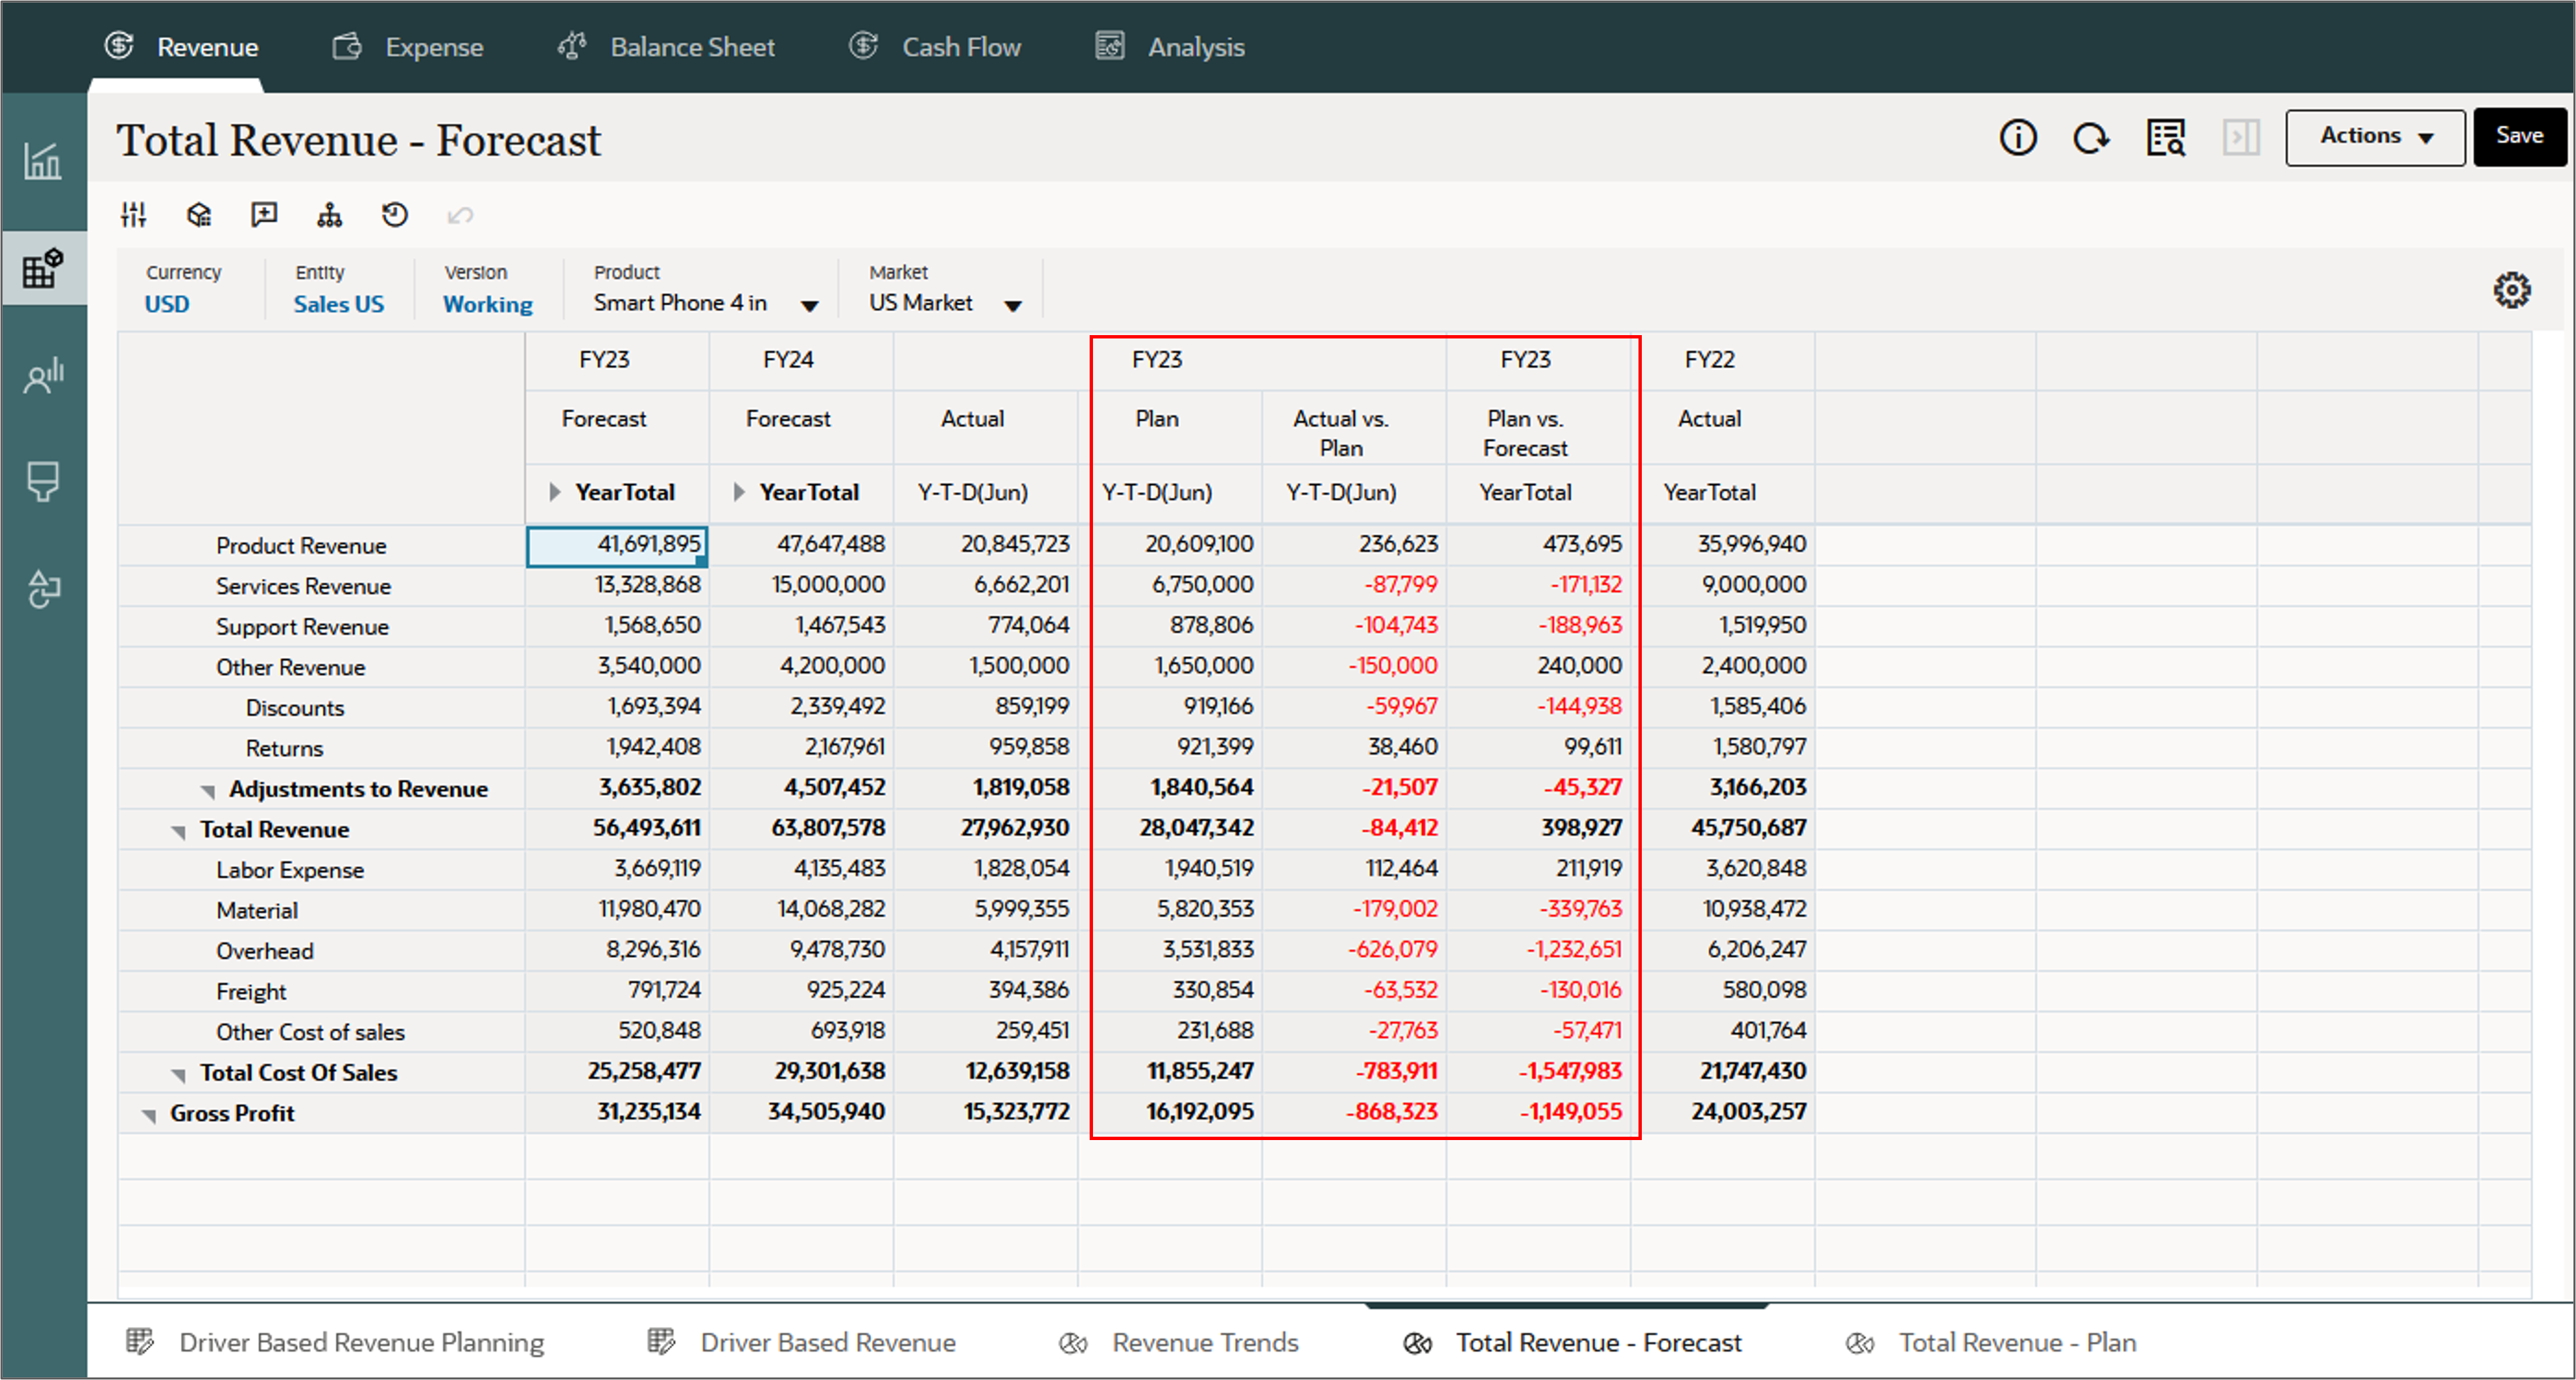
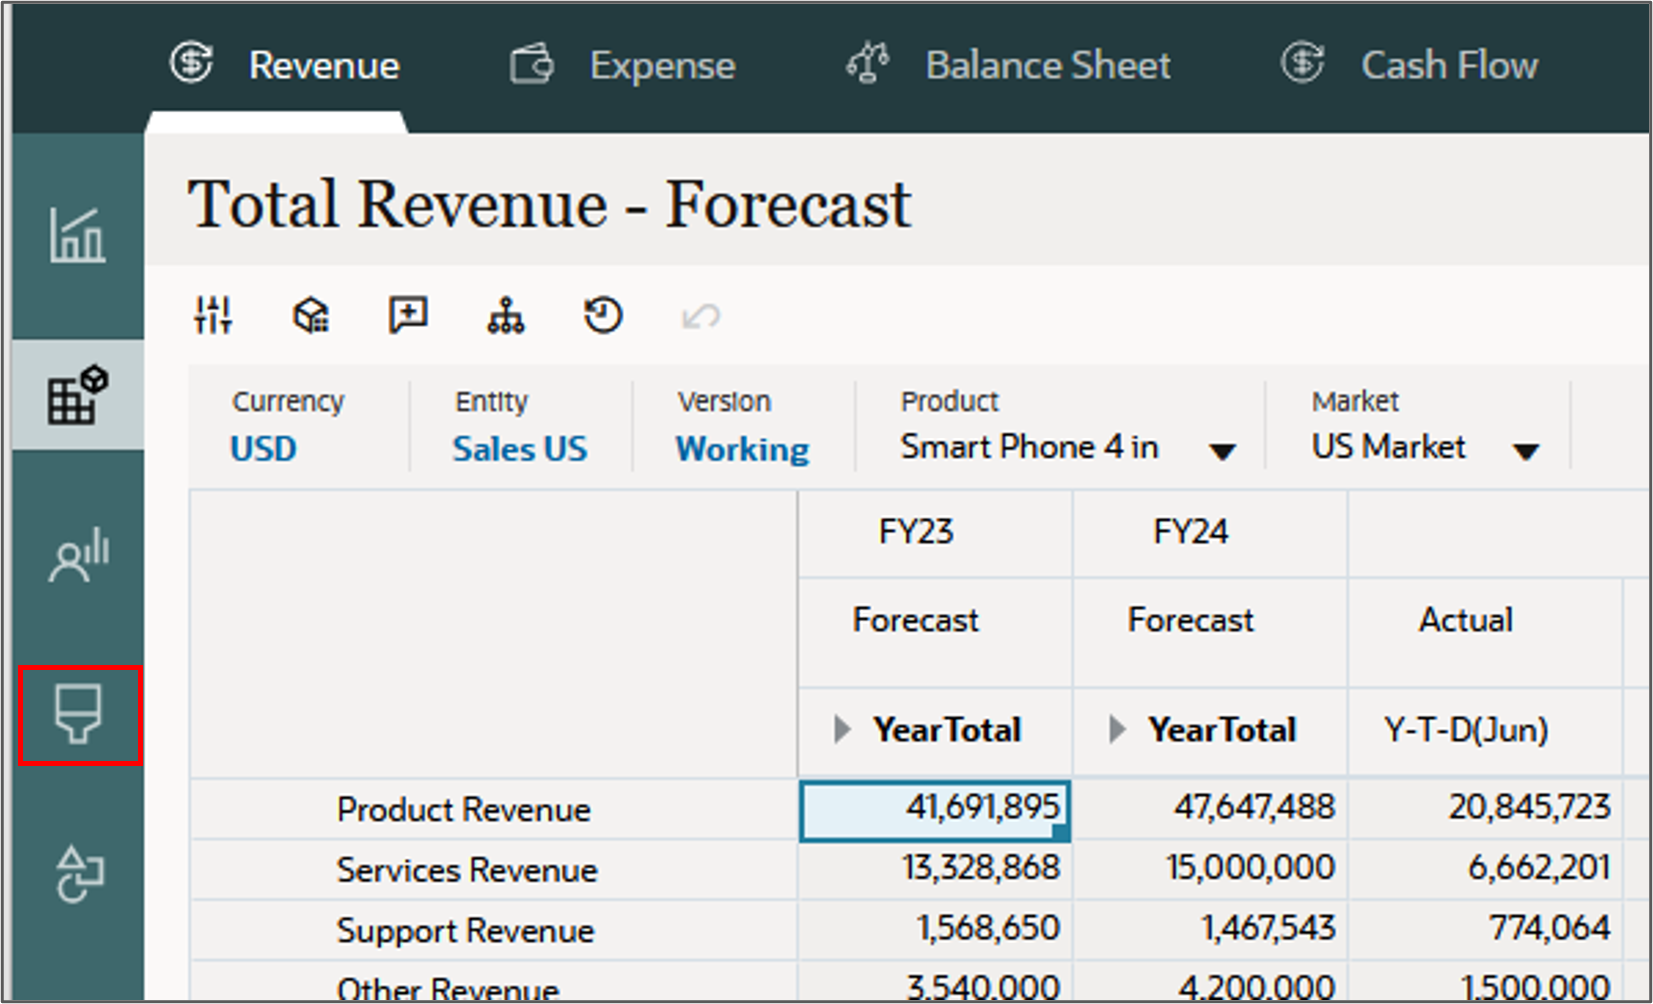
- Click the Total Revenue - Forecast tab.


Calculated variances are displayed on this page.
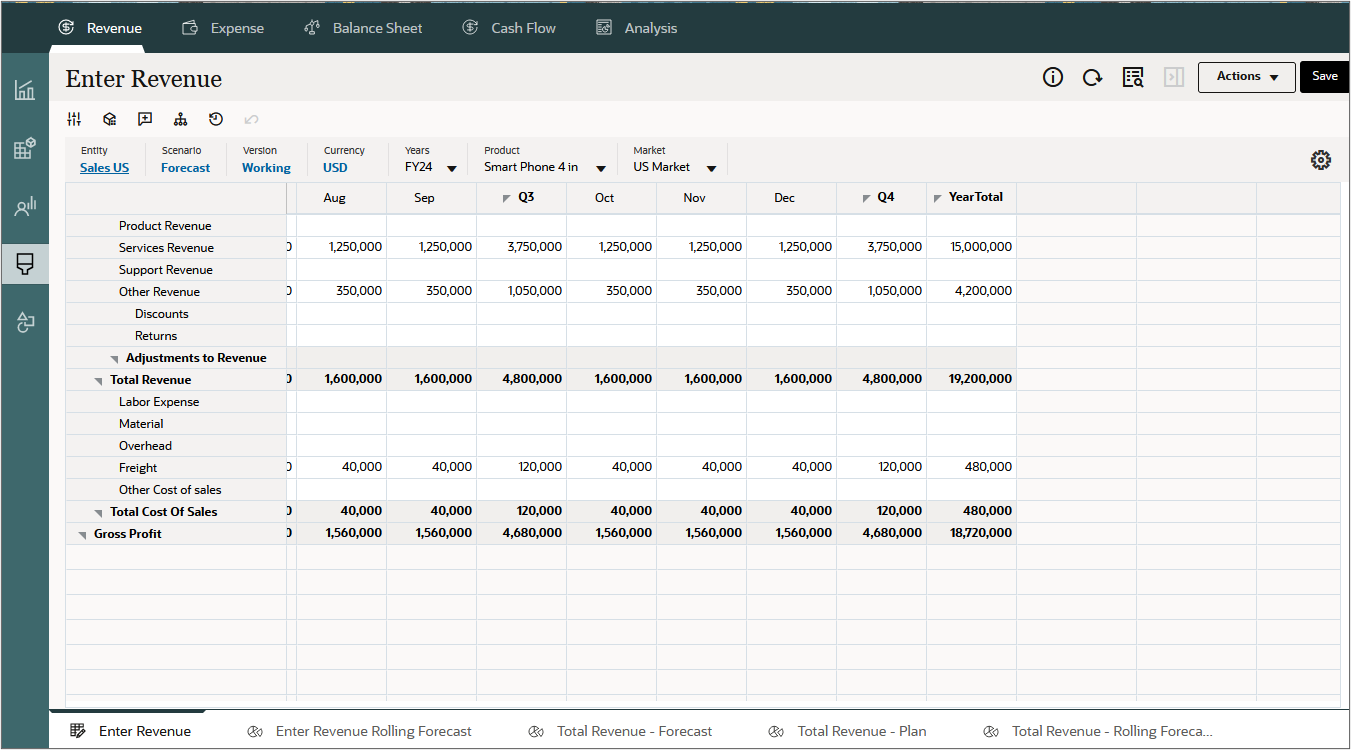
Entering data manually
For accounts which you cannot plan based on drivers or prior year, current year, or trend-based values, you can manually enter or edit data. For example, the shipping department provides an estimate for freight that may be entered manually.
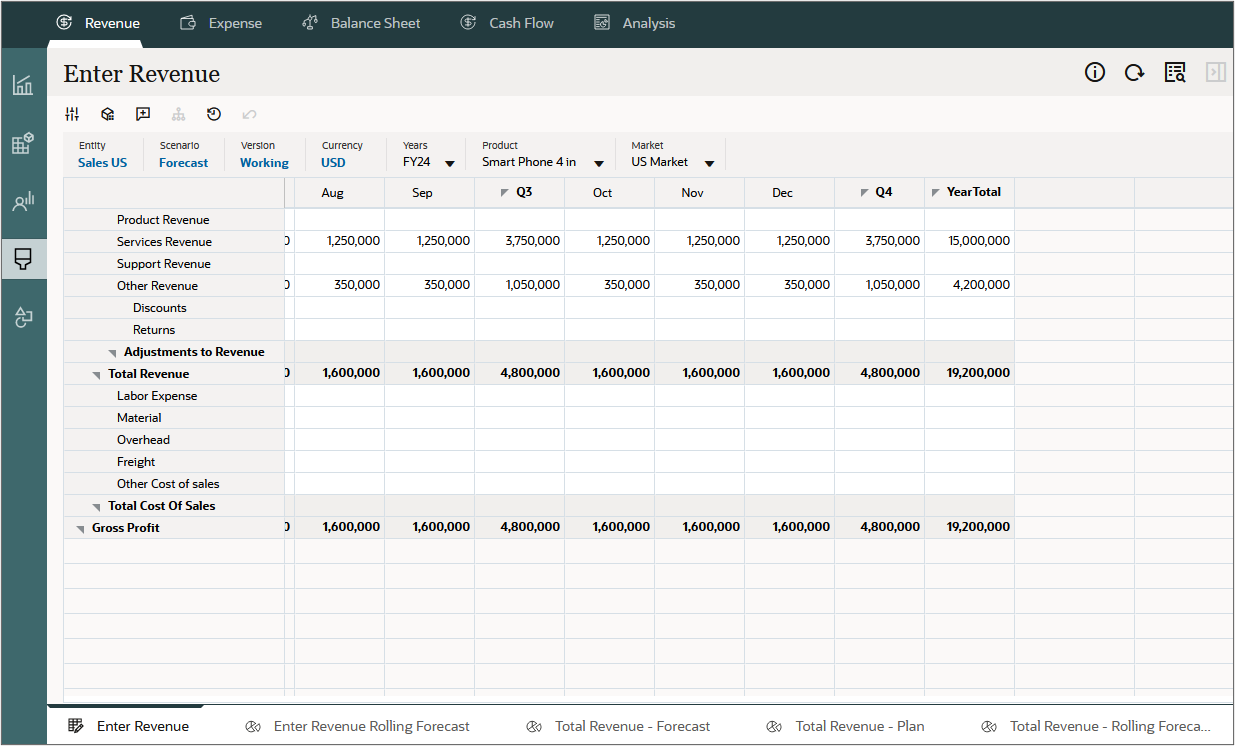
- On the left, click
 (Direct Entry).
 - Scroll to the right to display the months of Q4 and YearTotal.
- Enter values for Freight: 480k in YearTotal.
- Click Save.
- In the Information dialog box, click OK.
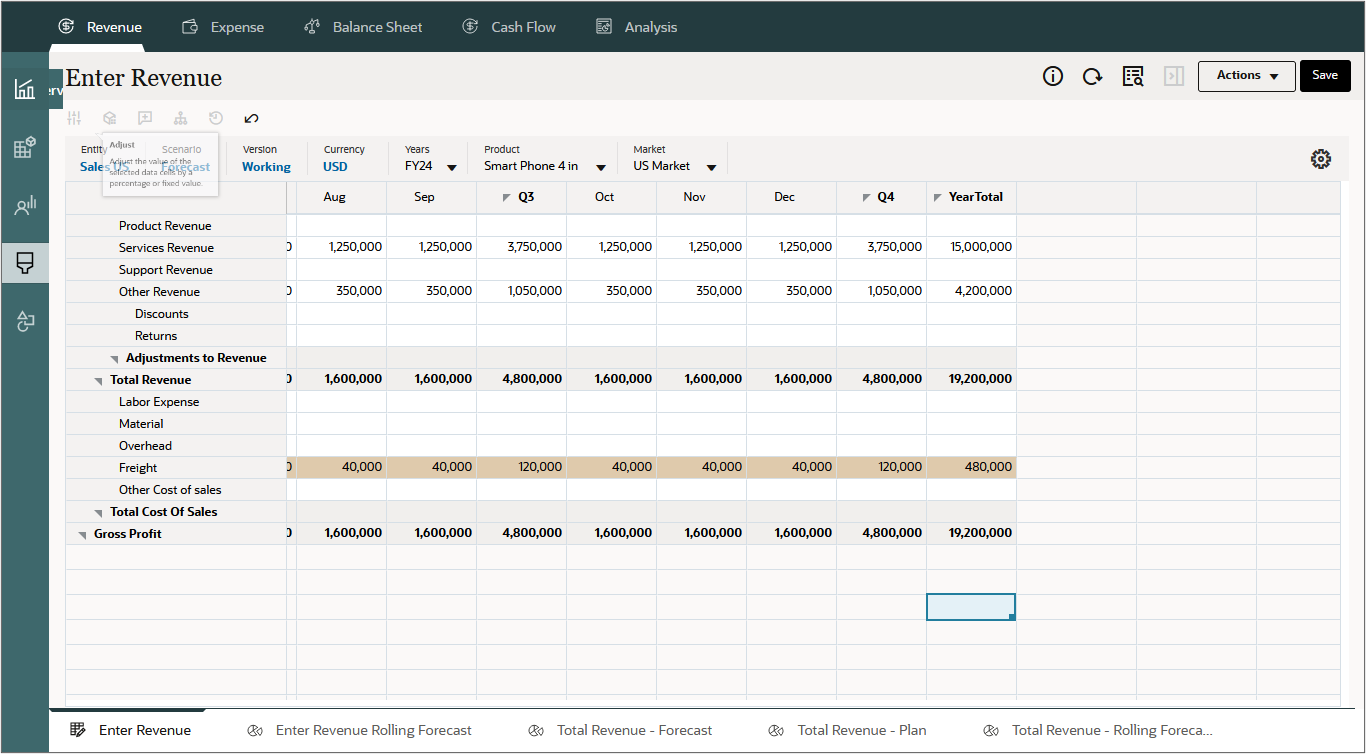
The calculated form is displayed.
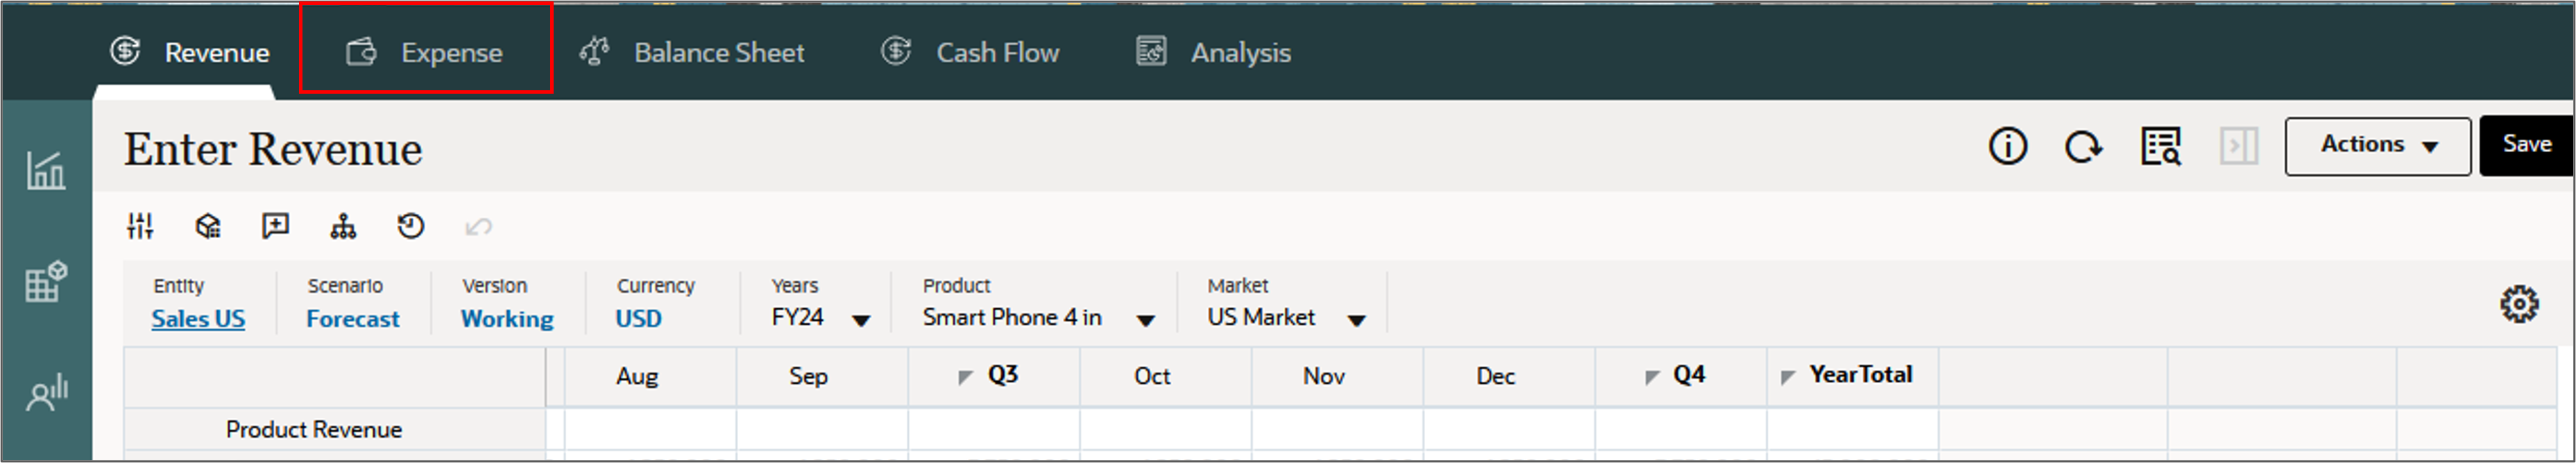
Expense planning
For Expense planning, you can follow similar procedures when entering driver, trend, and manual data.
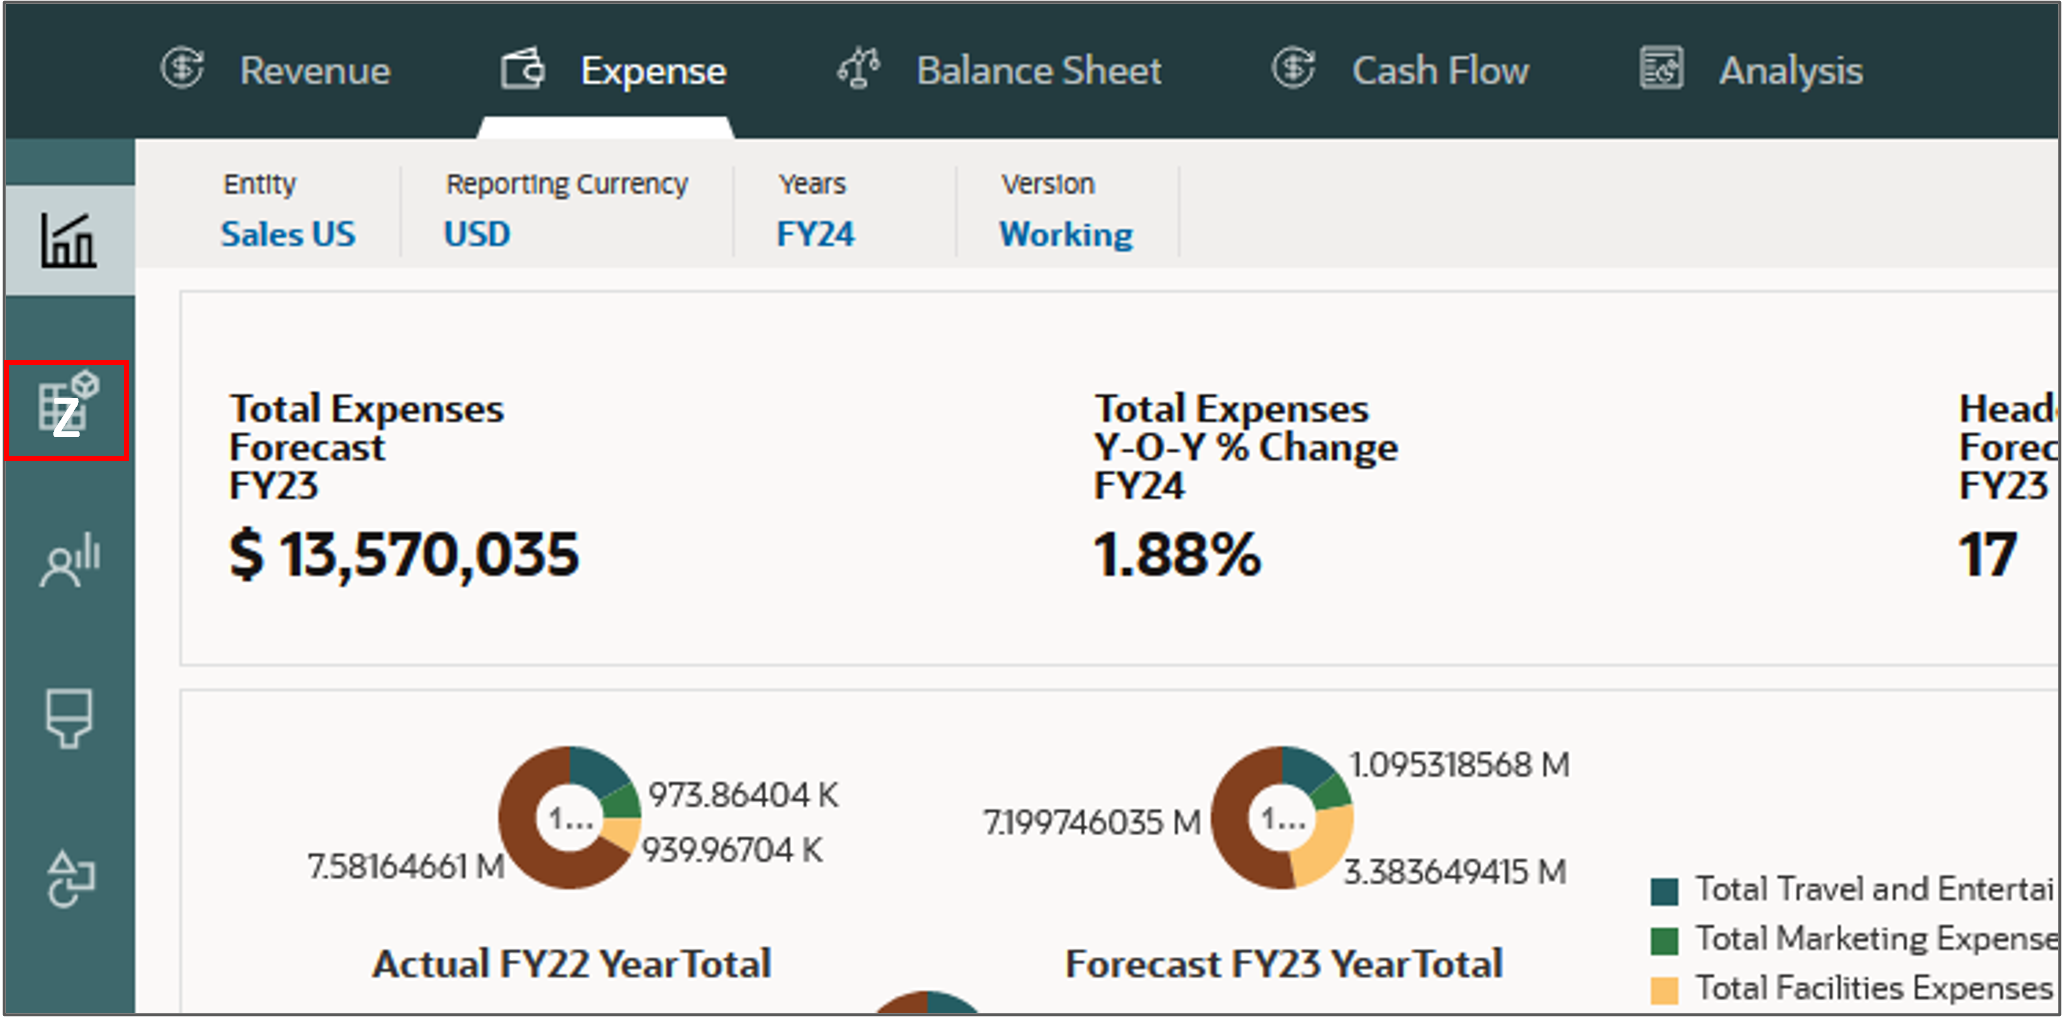
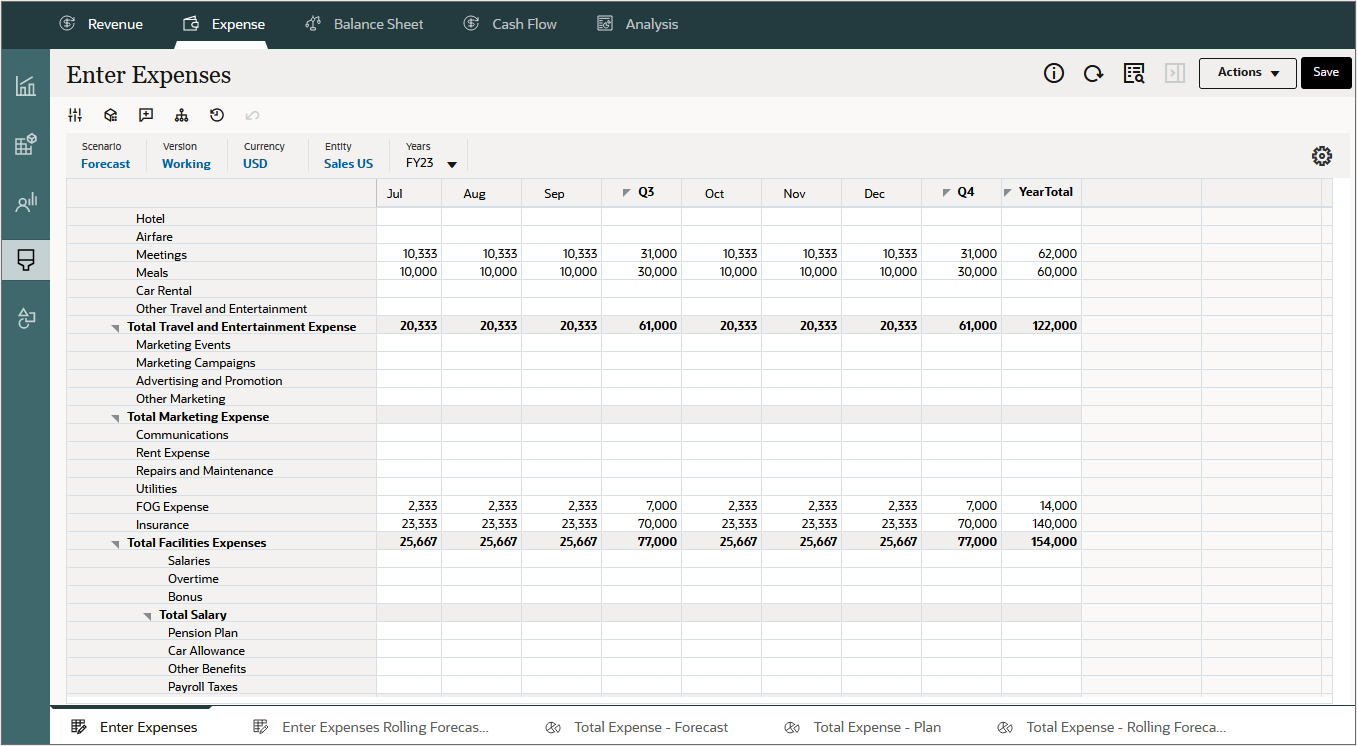
- Click the Expense card.
- On the left, click (Driver and Trend Based).
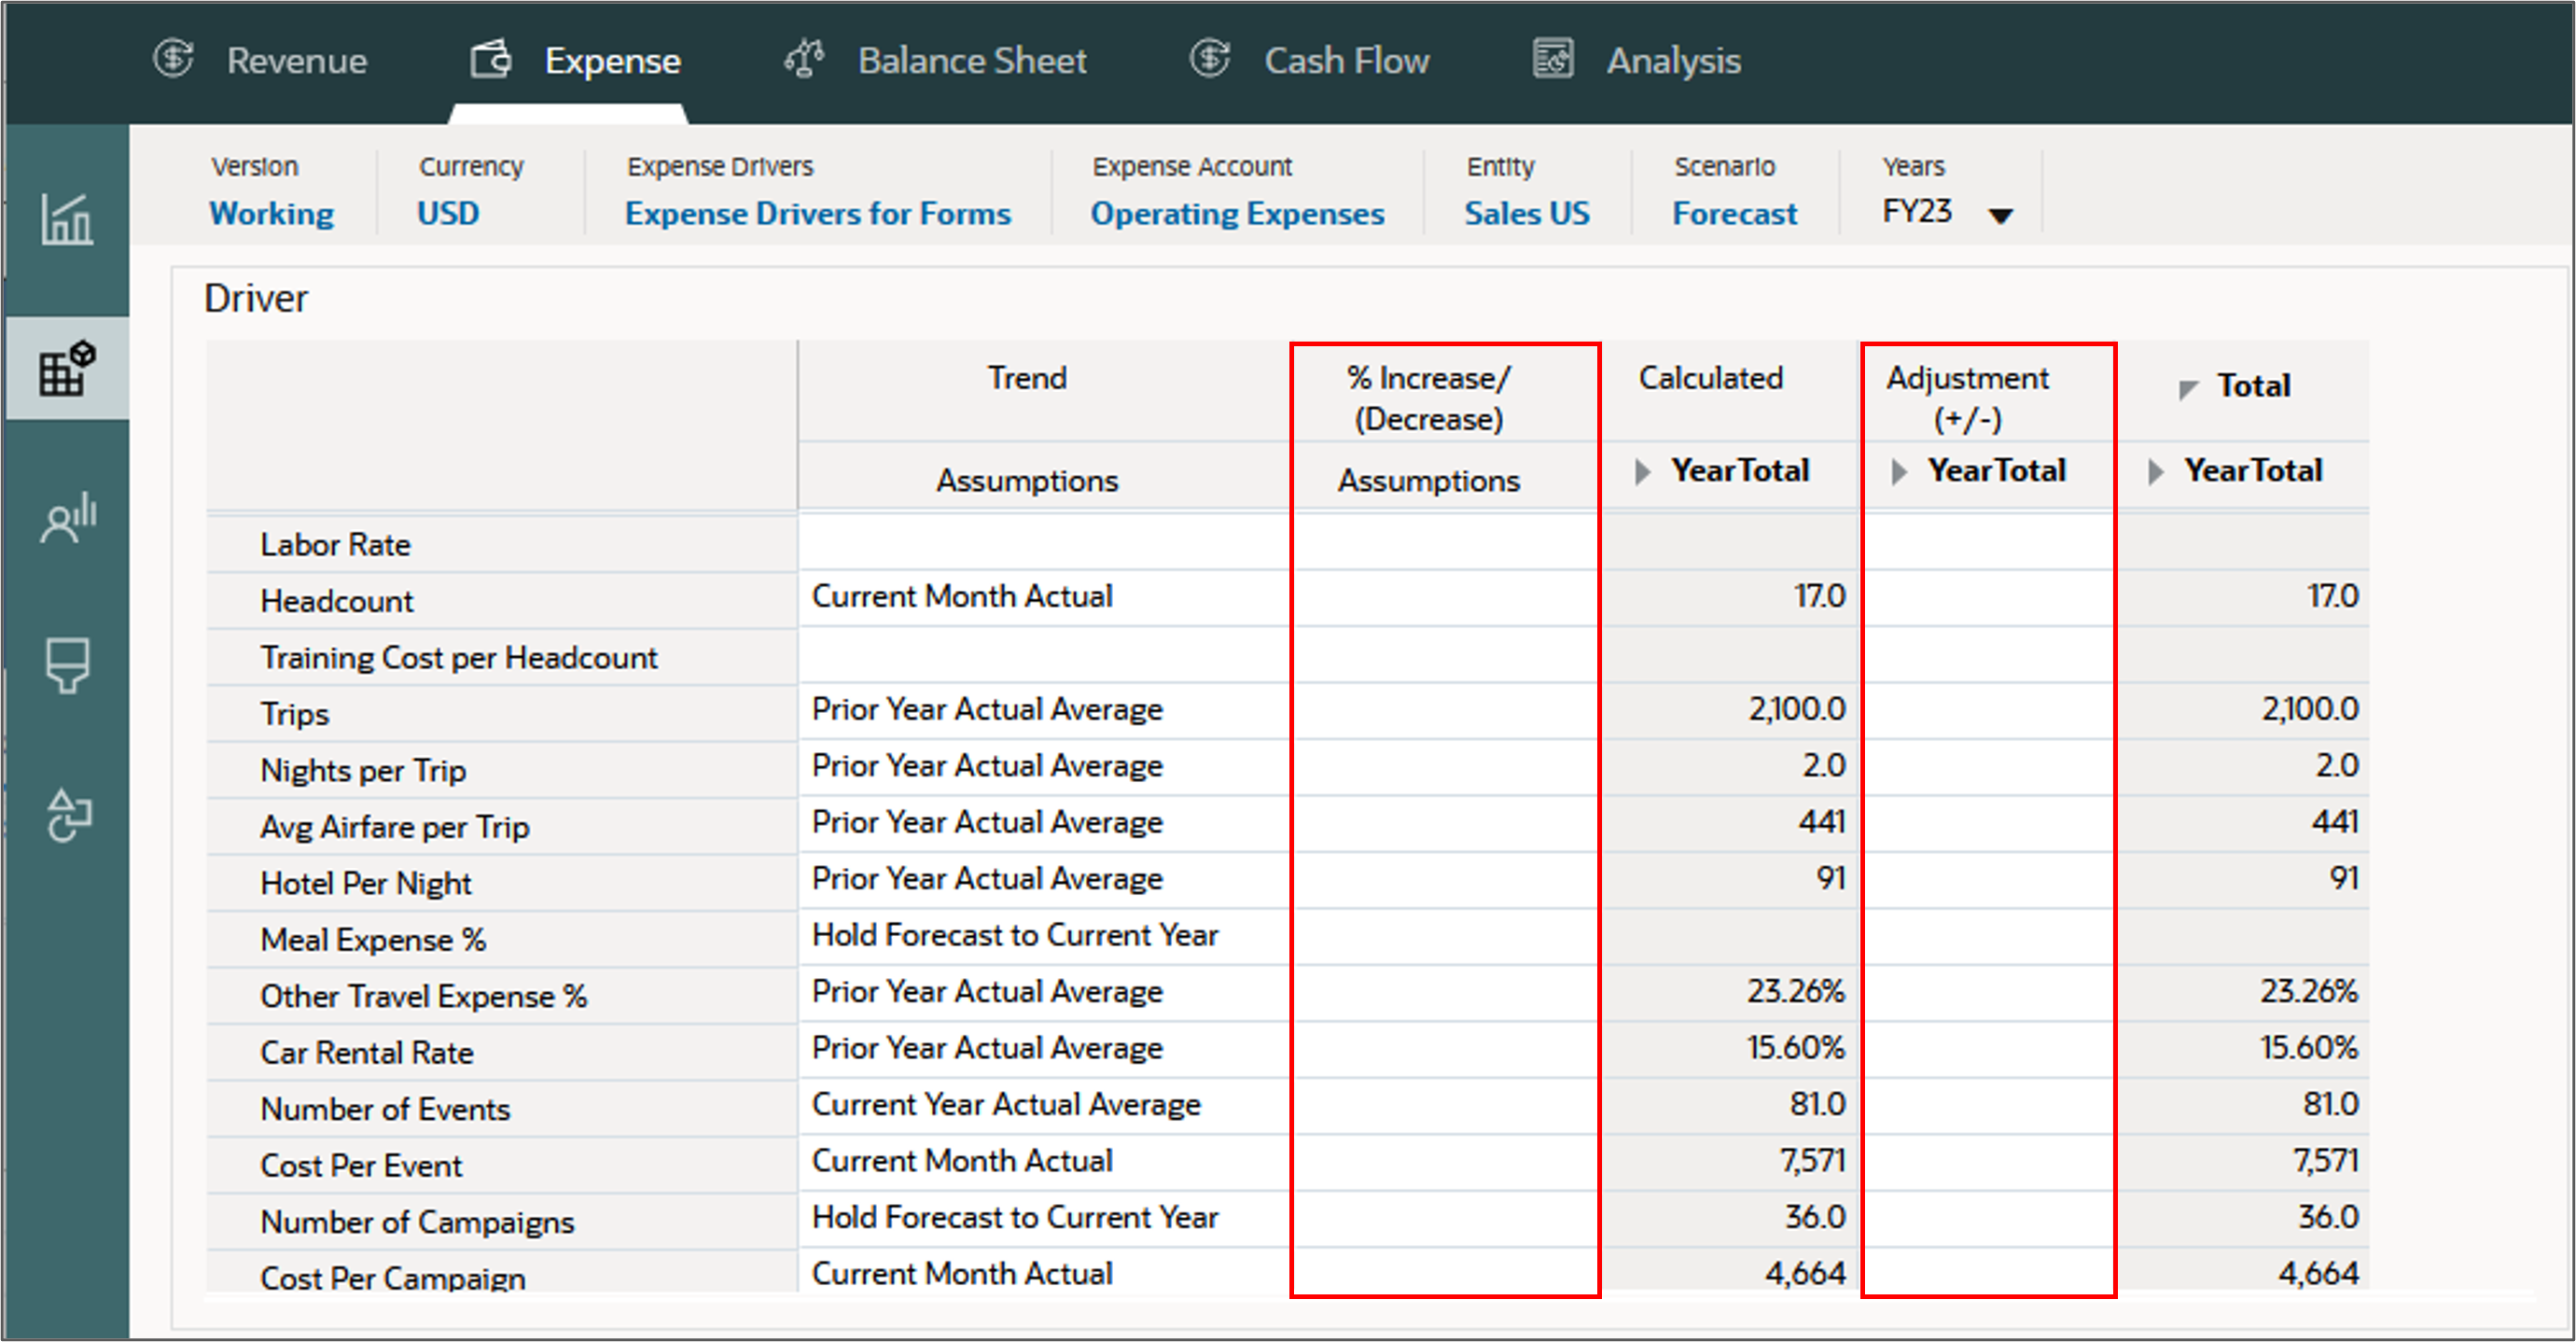
- For driver-based expenses, you enter assumptions in the "% Increase/(Decrease)" column, and make adjustments in the "Adjustment (+/-)" column.
- On the left, (Direct Entry.).
Here you can manually enter or edit data for expenses which you cannot plan based on drivers or
prior year, current year, or trend-based values.
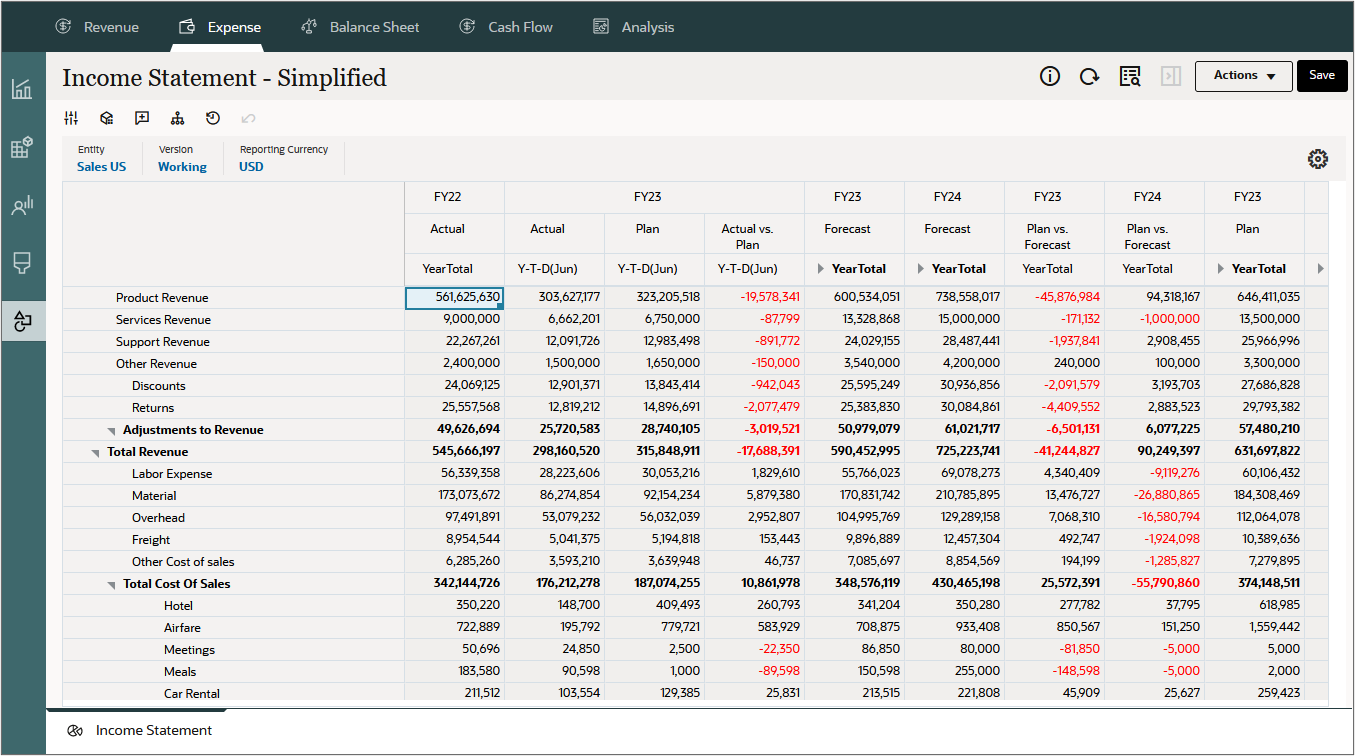
- On the left, click
 (Income Statement). Here, you can review
Income Statement plan data as well as variances between years, periods, and scenarios. The plan
data automatically flows to the pre-configured Income Statement.
(Income Statement). Here, you can review
Income Statement plan data as well as variances between years, periods, and scenarios. The plan
data automatically flows to the pre-configured Income Statement.
Related Links
Performing income statement planning in Financials
F97846-02
July, 2024