Introduction
This 45-minute hands-on tutorial shows you how to create and run Sales Planning reports. The sections build on each other and should be completed sequentially.
Background
Oracle Sales Planning provides an extensible, reliable framework that enables your teams to set and analyze data-driven, intelligent quotas using best practice methodologies. All key participants engage in the sales planning process including sales operations, sales management, and sales reps.
The following business processes are available in Sales Planning:
- Quota Planning offers top-down and bottom-up target quota planning by territory, product, account, or other custom dimensions. Use Predictive Planning and what if scenario planning to explore and compare different quota scenarios for informed decision making. Quota Planning builds best practices into its content, including its forms, calculations, dashboards, infolets, drivers, and measures.
- Advanced Sales Forecasting provides a robust platform for the sales forecasting process, allowing multidimensional sales forecasting across territories, products, accounts, channels, or other custom dimensions. It offers sales teams connected sales planning with integration between Quota Planning, compensation planning, and sales forecasts. With Advanced Sales Forecasting, you can plan at the weekly or monthly level, and use a rolling forecast if your business requires it.
- Key Account Planning expands Sales Planning to cover a data driven approach to sales baseline planning, resulting in an overall view of the customer's profit and loss. Key Account Planning helps key account managers plan trade promotion strategies in order to optimize their trade spends and offers collaborative sales planning. By using baseline planning and promotion planning, key account managers or sales managers can perform gap analysis and see the uplifts - the impact on sales volume or revenue - from running trade promotions.
You can create comprehensive reports based on real-time data for planning and decision making at multiple levels in your sales organization. Reports in Oracle Sales Planning helps you create dynamic and interactive reports in PDF and HTML format.
Prerequisites
Cloud EPM Hands-on Tutorials may require you to import a snapshot into your Cloud EPM Enterprise Service instance. Before you can import a tutorial snapshot, you must request another Cloud EPM Enterprise Service instance or remove your current application and business process. The tutorial snapshot will not import over your existing application or business process, nor will it automatically replace or restore the application or business process you are currently working with.
Before starting this tutorial, you must:
- Have Service Administrator access to a Cloud EPM Enterprise Service instance. The instance should not have a business process created.
- If you haven't already, register for a free Oracle Cloud Customer Connect account so you can
access the required files.
- Download the latest Sales Planning Sample Application snapshot from this idea page.
- Upload and import the latest Sales Planning Sample Application snapshot into your Planning instance.
Note:
If you run into migration errors importing the snapshot, re-run the migration excluding the HSS-Shared Services component, as well as the Security and User Preferences artifacts in the Core component. For more information on uploading and importing snapshots, refer to the Administering Migration for Oracle Enterprise Performance Management Cloud documentation.
Reporting Overview
Oracle Sales Planning provides a comprehensive report authoring solution that enables you to quickly create dynamic and interactive reports in PDF and HTML format. Accurate and timely reports based on real-time data are critical for planning and decision making at multiple levels in a sales organization.
The graphical interface of the report designer allows you to swiftly design report frameworks using objects. The wide range of formatting and design options give you maximum control on the layout of the report.
Service Administrators and Power users build report definitions using the Report Designer. They can assign access to viewers, who use these report definitions to generate reports. For example, Sales Managers can design a report definition to analyze quota attainment based on product, account, or territory. The Regional Manager can use this definition to generate reports based on different criteria.
Report definitions that are built using the report designer act as a framework to retrieve real-time data in reports. In the Reports module, you can design reports by inserting, positioning, and customizing objects such as grids, charts, text boxes, and images.
You can preview reports any time from the report designer and save them as time-specific snapshots.
Once a report is designed, viewers such as regional or operations managers can view and interact with reports in HTML or PDF format. They can specify criteria for report data by selecting members for dimensions.
Report Objects
When you add report objects to a report, you define their position in the report layout, and you select the data content for the report object.
Report objects include:
- Grids: Include tables that can contain data from external database connections.
- Text: Insert text objects that can contain text with a label description, or text functions where you can, for example, retrieve the current date.
- Images: Add an image to the header, footer, or body of a report. You can insert bitmaps (.bmp), Graphics Interchange Format (.gif), or Joint Photographic Experts Group (.jpg).
- Charts: Insert a chart to include a graphical representation of report data from a grid on a report. The chart retrieves data dynamically from the grid, so if data in the grid changes, the chart is updated automatically.
You can insert report objects previously stored in the repository, and you can use report objects in multiple reports.
Object Properties
After you add a report object to a report, you can assign properties to it such as format options. Format options include font, alignment, spacing, shading, and positioning. When you select a report object, the corresponding properties for the object are displayed on the right side of the design area. For example, when you select a grid, the Grid Properties are displayed. Properties allow you to set options for the report object.
In Grid Properties, you can set up the following sections:
- Set up the dimension layout, set heading labels, define row and column width, and include other settings that apply to the entire grid such as row banding, Zoom to children or descendants, amd drill through to source.
- Define suppression options such as suppressing data values that are zero or missing.
- Set the position of the grid in the report, the position of expansions, auto calculations, and supporting detail.
Point of View (POV)
Every data value in a report is derived from the intersection of a member from each dimension in a Planning database connection. In Oracle Sales Planning Reports, you can place these dimensions on the report grid or in the user point of view. When you view the report, you can change the member selected for dimensions on the user point of view. This allows you to customize a report to fit your needs. You can also use the user point of view in books.
In a report, the member specified for a dimension in the user point of view is used for all grids with that dimension. For example, if you select the "budget" member for the "scenario" dimension, all grids in the report with "scenario" in the user point of view use "budget" when you retrieve data. The user point of view is not displayed if all of the dimensions are placed on the grid.
Getting Started with Reports
Navigating to Reports
- From the home page, click Reports.
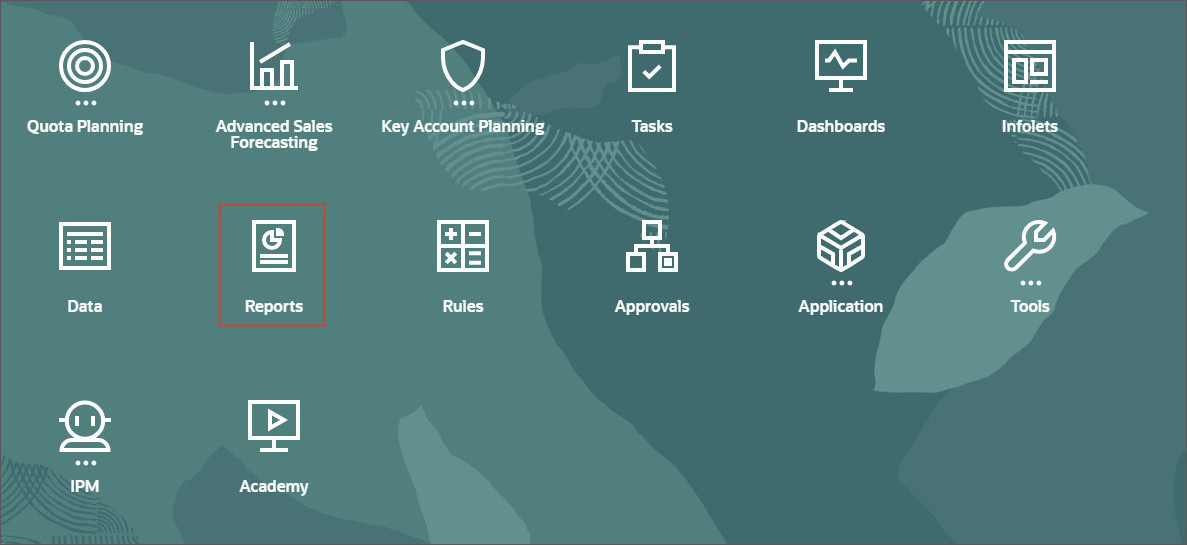
The Reports are managed on the Reports tab under the Reports card.
Financial Reporting Reports are managed on the Financial Reports tab under the Reports card.
The Documents tab stores external documents such as PDFs and MS Word documents included in books, CSV files for bursting definitions and PDF files generated by running bursting jobs.
You can assign access permissions to files and folders in the Documents tab.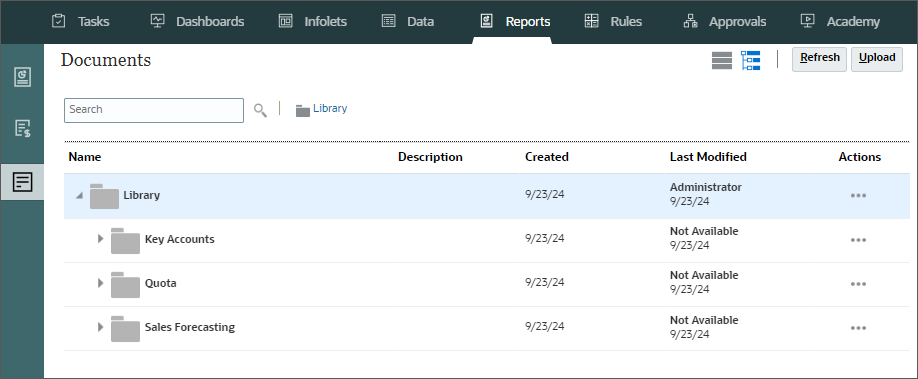
Creating Folders and Reports
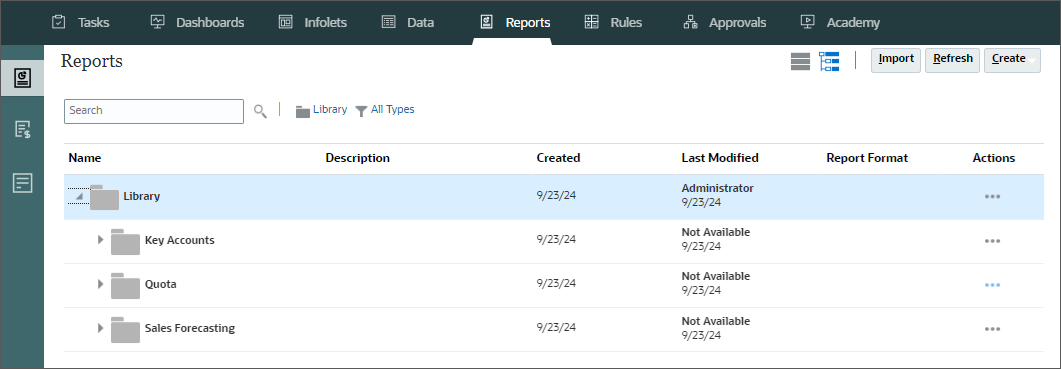
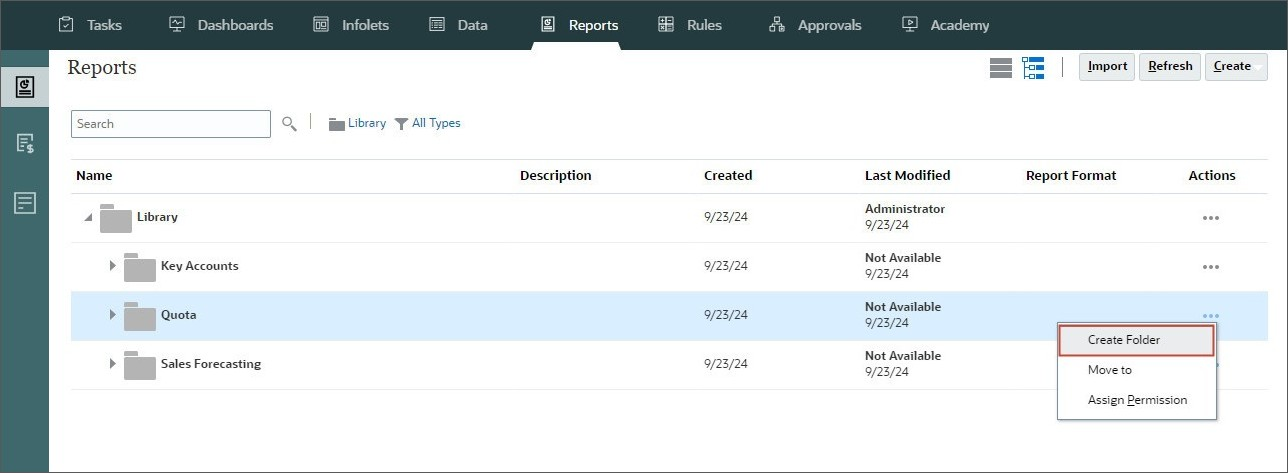
You use the Library to organize and manage reports. In this section, you create a new report and a folder to store your reports.
- Navigate to the Reports tab and expand the Library folder.
- Click
 (Actions) on the
Quota folder and select Create Folder.
(Actions) on the
Quota folder and select Create Folder.
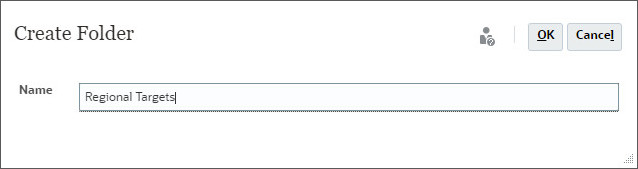
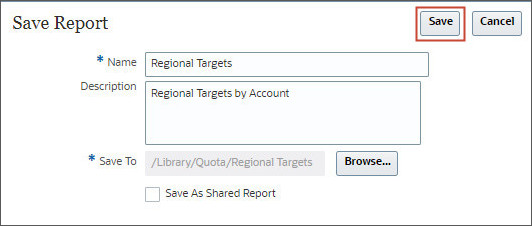
- In Create Folder prompt, enter Regional Targets as the folder name, and click OK.
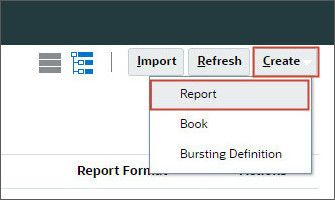
- On the top-right, click Create and select Report.
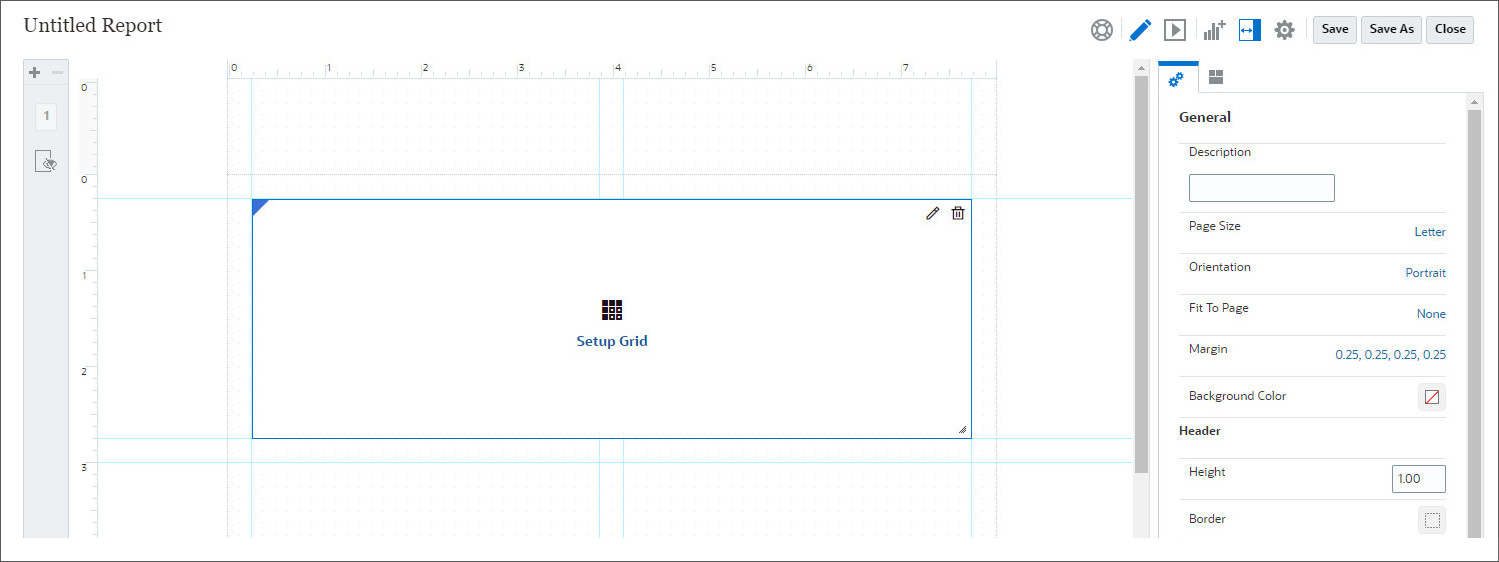
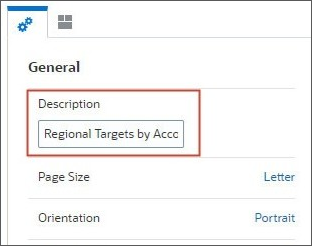
- On the right, under General, for Description, enter Regional Targets by Account.
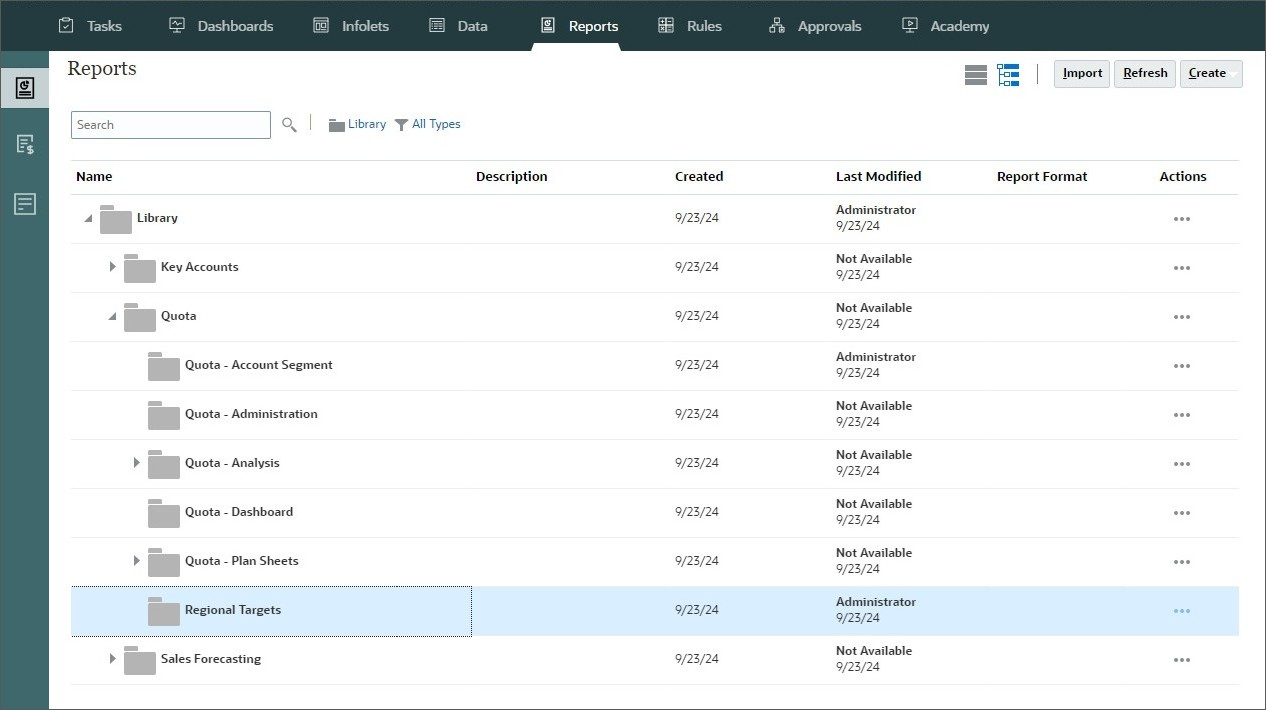
The Regional Targets folder is added under the Quota folder.
The Report Designer is displayed. The Report Designer includes a canvas where you can insert,
resize, and reposition objects, define a header and footer for the report, add, remove, and
select physical pages, select options, and navigate with buttons, and set properties in a
Properties panel.
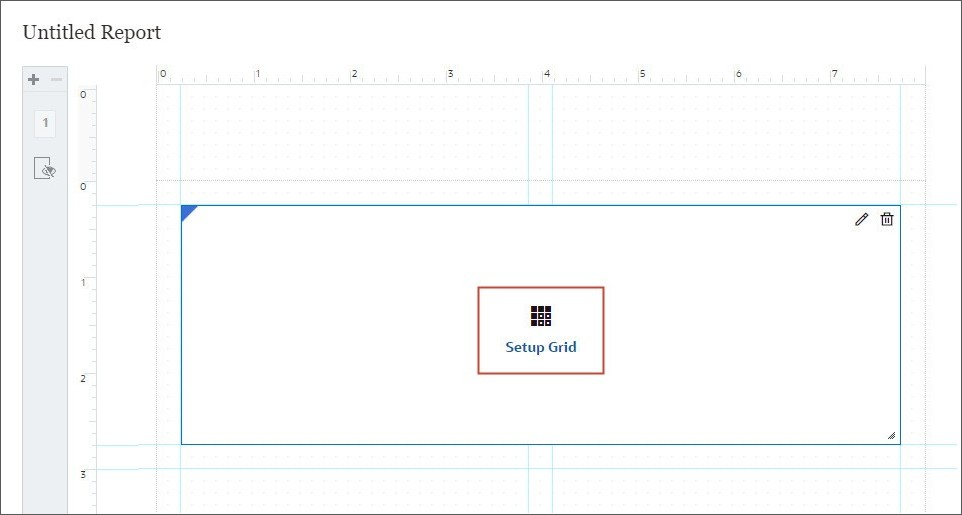
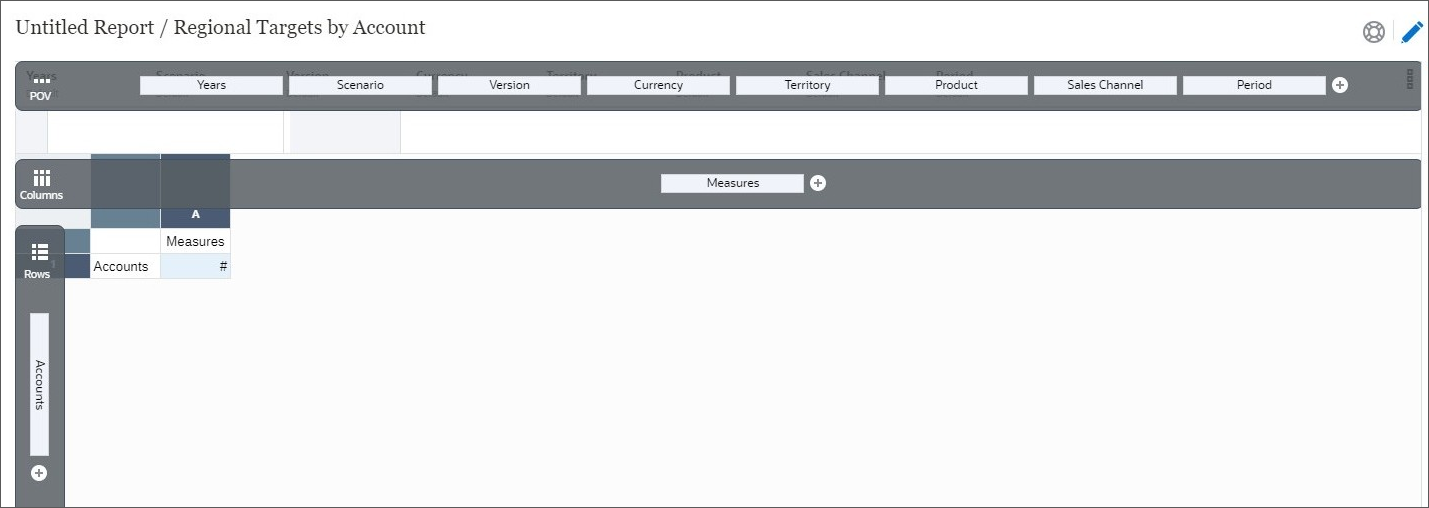
The Report Designer canvas includes an initial undefined grid as a starting point.
Setting up Grids
You can add a grid to your report, define its dimension layout, select members, and then format the grid. You can also insert an existing grid to reuse a pre-formatted grid design.
You can use text, dimensions, members, and formulas to define the grid content. You can also hide a grid. For example, you might want to display a chart in a report, but not the grid associated with the chart.
Adding Grids
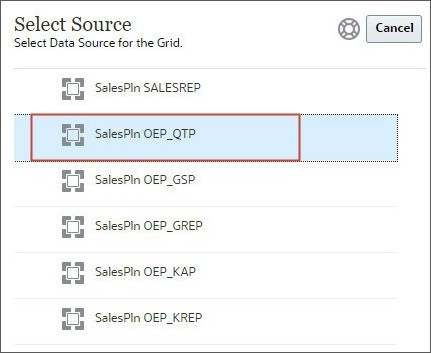
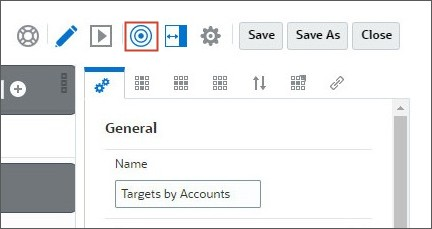
- Click Setup Grid to configure the grid.
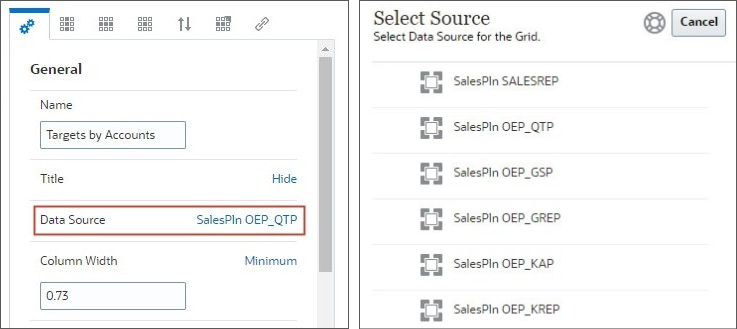
- Select SalesPln OEP_QTP as the Data Source for the grid.
When you add or edit a report object, it opens in its own editor.
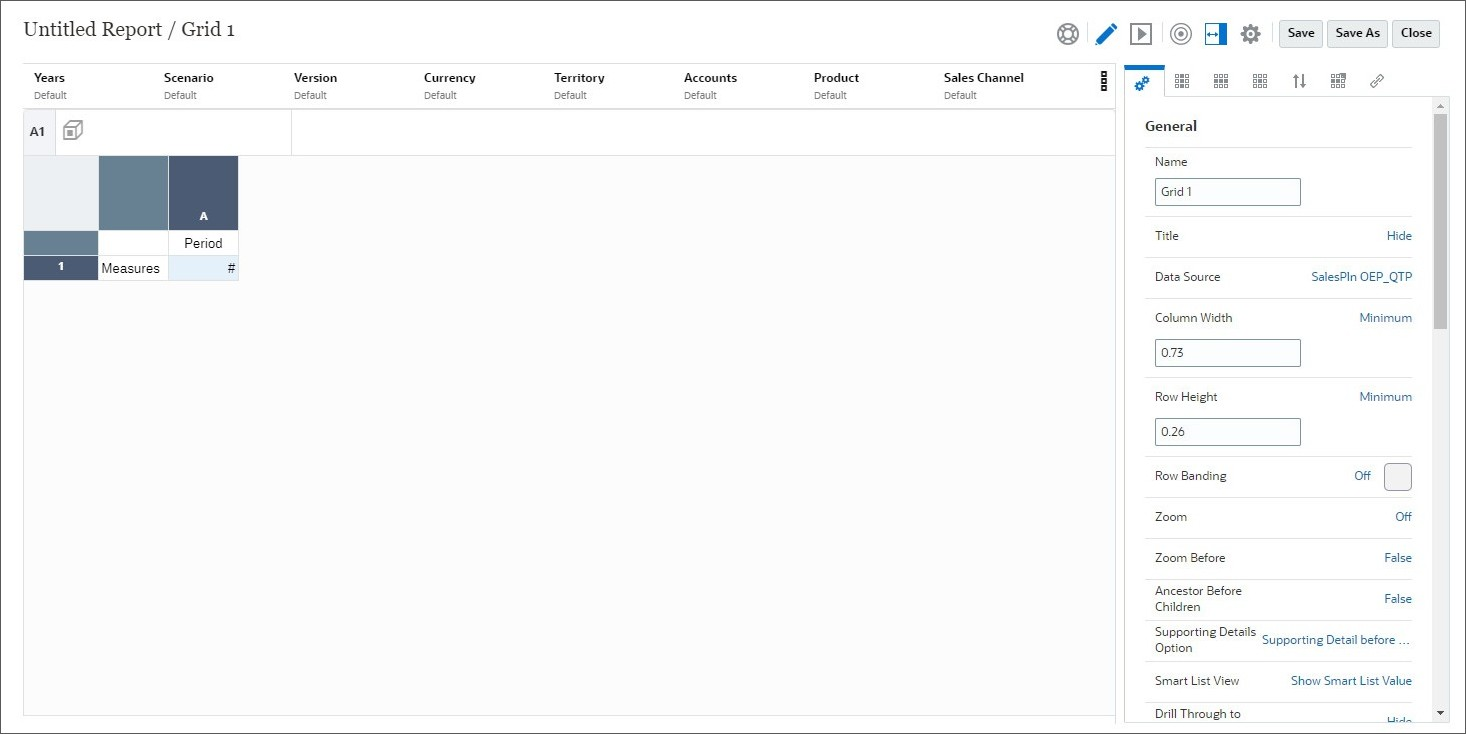
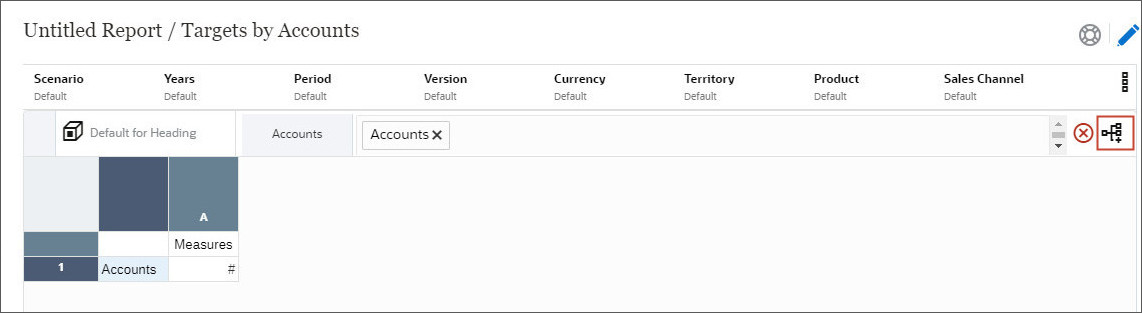
Defining the Grid Dimension Layout
You design report grids in Dimension Layout. By default, all dimensions are in the POV.
- Click
 (Show Dimension
Layout) to setup dimensions for the grid.
(Show Dimension
Layout) to setup dimensions for the grid.
- From Point of View, click and drag the following dimensions and click OK:
- Measures to the Columns
- Accounts to the Rows
- Click (Show Dimension
Layout) again to go back to the grid editor.
- Select the Account row and click
 (Select Members) to select members for the Accounts dimensions
in the grid.
(Select Members) to select members for the Accounts dimensions
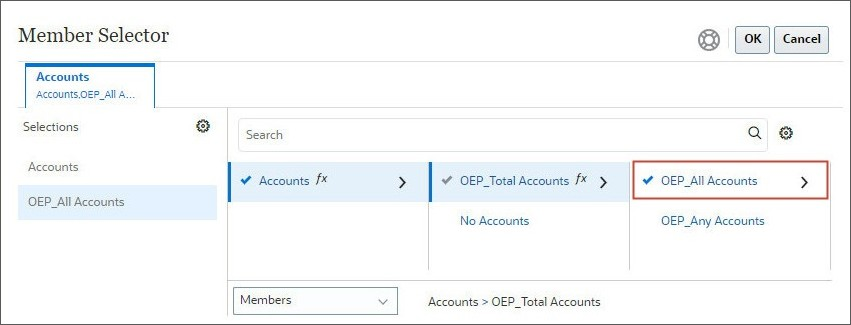
in the grid. - In Member Selector, click
 (Show
Child Members) for Accounts, and then click (Show Child Members) for OEP_Total Accounts to display
its members.
(Show
Child Members) for Accounts, and then click (Show Child Members) for OEP_Total Accounts to display
its members.
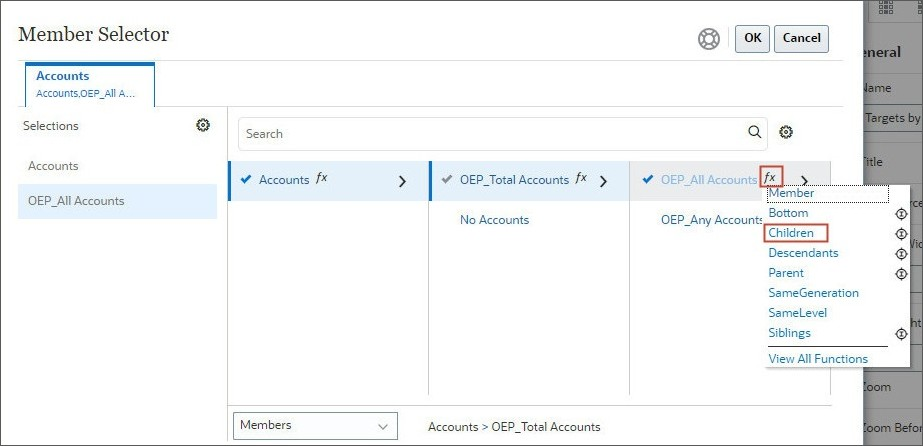
- Click
 (Select) for OEP_All
Accounts.
(Select) for OEP_All
Accounts. - Click
 (Functions) for OEP_All
Accounts, and select Children.
(Functions) for OEP_All
Accounts, and select Children.
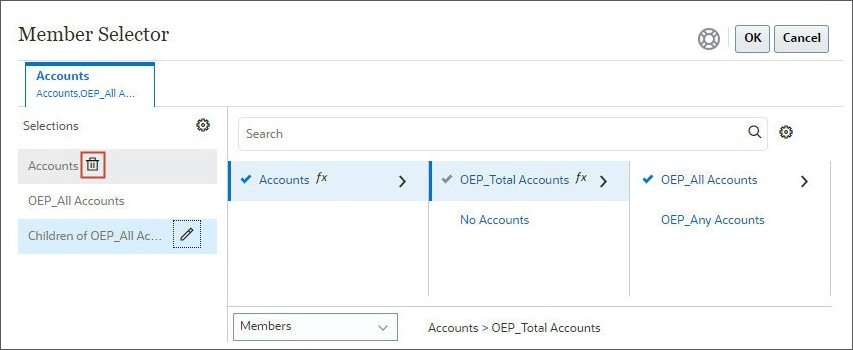
- Click
 (Delete) for
Accounts to remove it as a member.
(Delete) for
Accounts to remove it as a member.
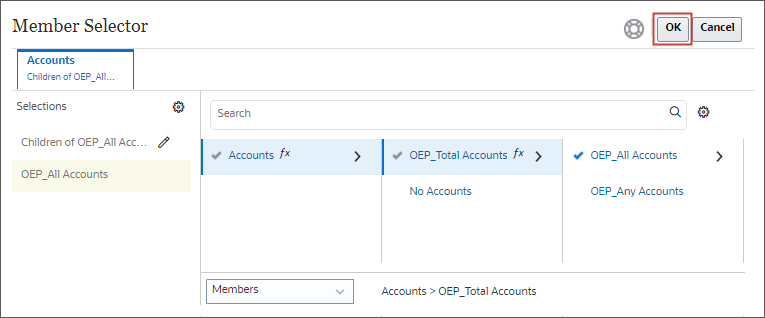
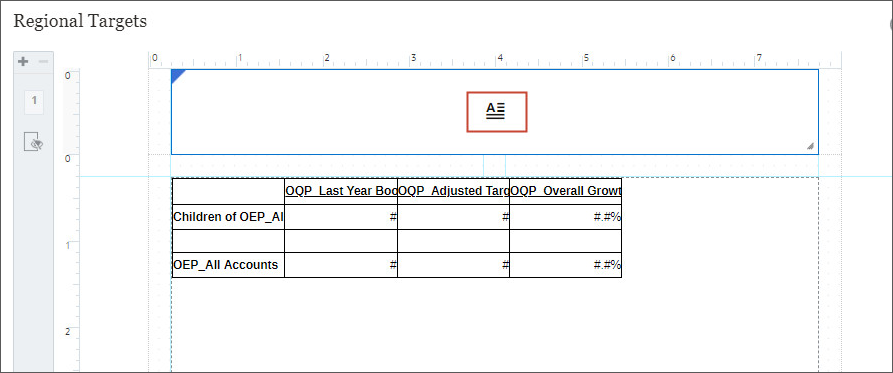
- Drag Children of OEP_All Accounts and place it before OEP_All Accounts, then click OK.
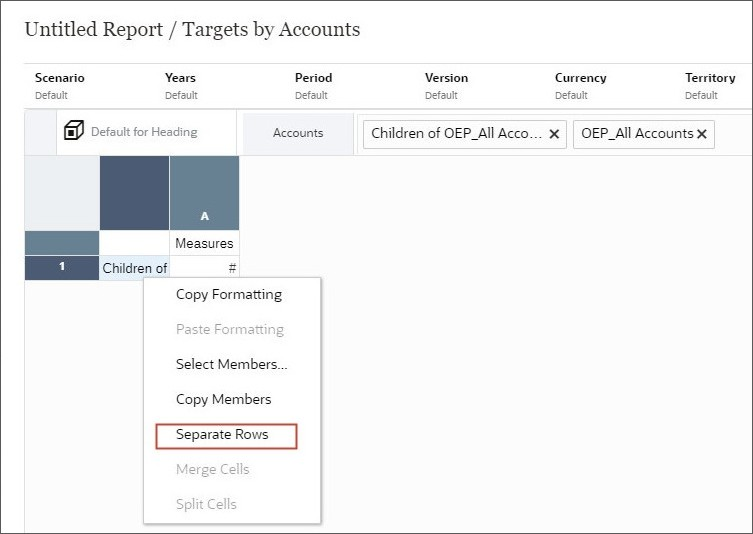
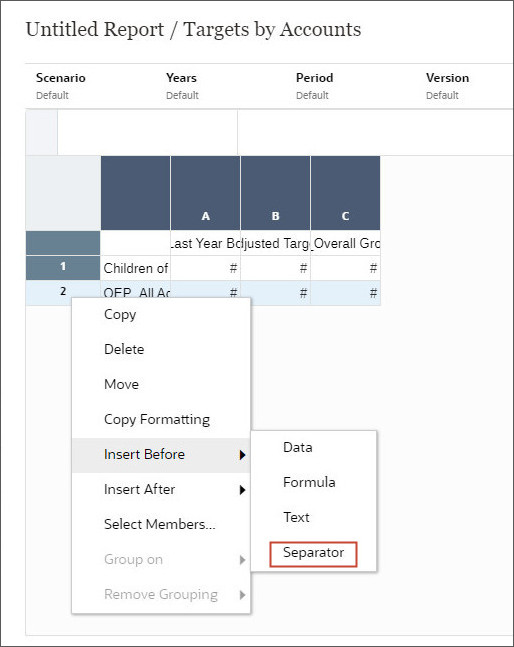
- Right-click the Accounts row and select Separate Rows to separate the members in different rows.
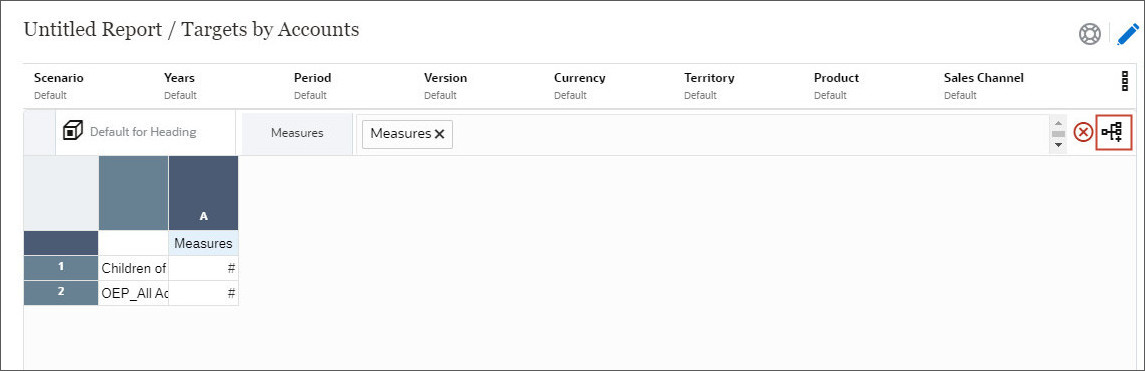
- Select the Measures column and click (Select Members) to select members for the Measures dimensions in the
grid
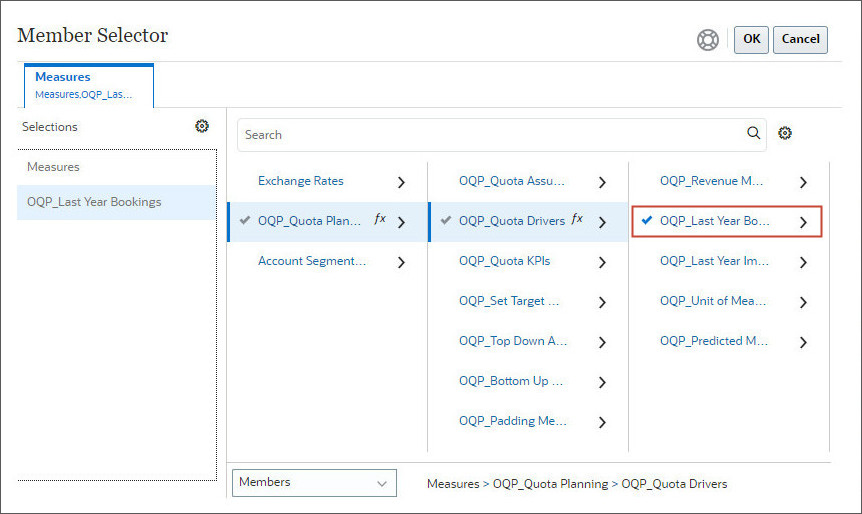
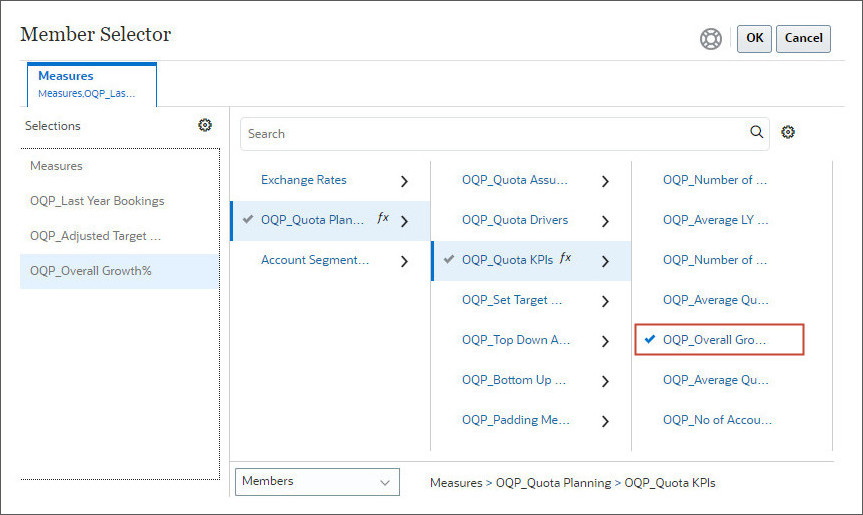
- In Member Selector, click (Show
Child Members) for Measures, OQP_Quota
Planning, and OQP_Quota Drivers and click (Select) for OQP_Last
Year Bookings.
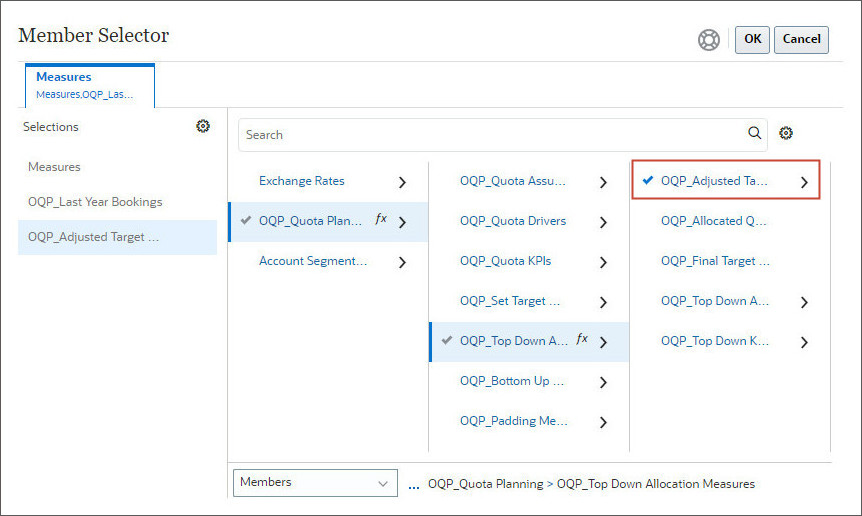
- Click (Show
Child Members) for OQP_Top Down Allocation Measures and click (Select) for OQP_Adjusted
Target Quota.
- Click (Show
Child Members) for OQP_Quota KPIs and click (Select) for OQP_Overall
Growth%.
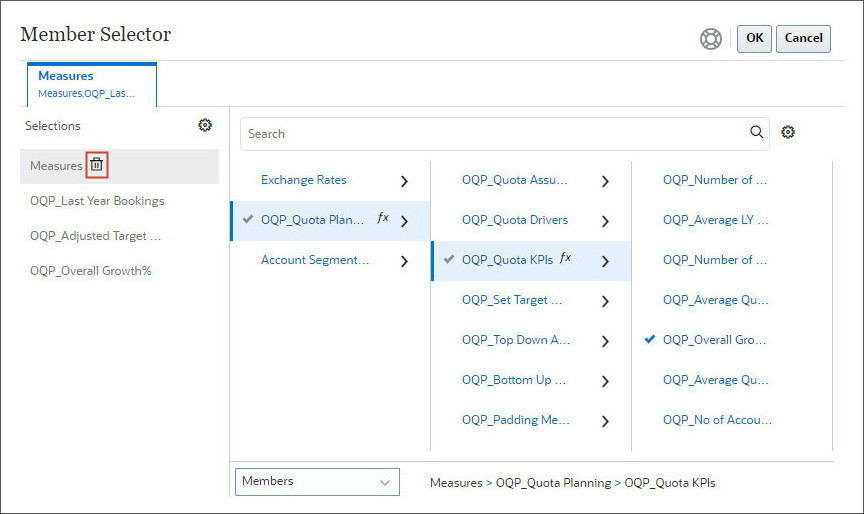
- Click (Delete) for
Measures to remove it as a member.
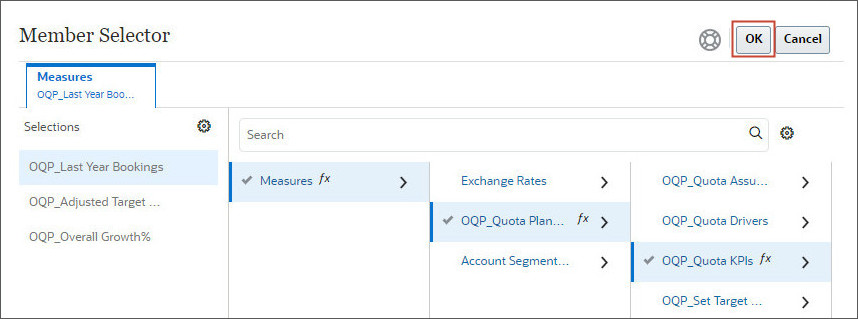
- Click OK to save selections.
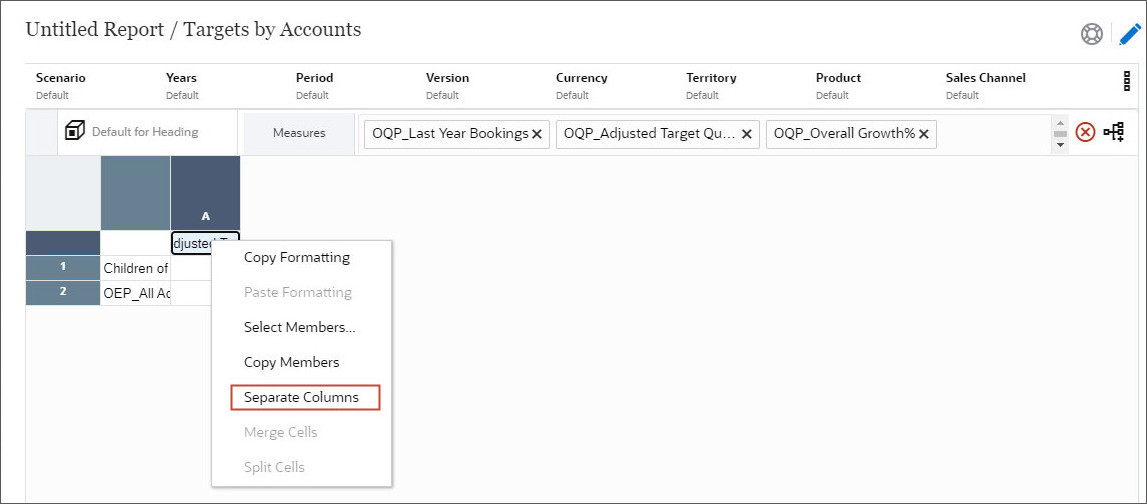
- Right-click the Measures column and select Separate Columns to separate the members in different columns.
- Right-click OPE_All Accounts row and click Insert Before and select Separator to add a separator row.
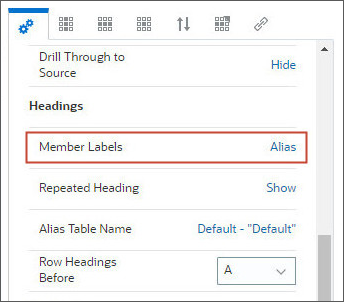
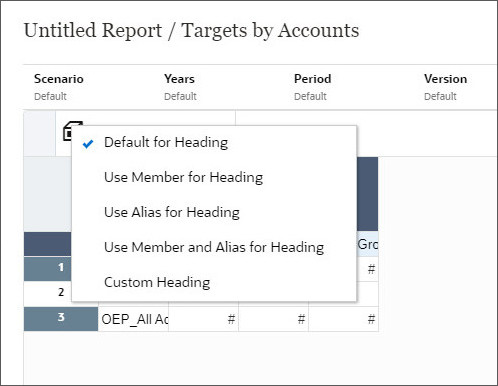
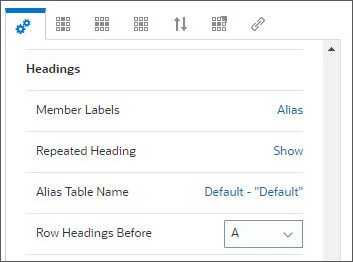
- In Headings property for the grid, ensure that Member Labels is set to Alias.
Tip:
You have the option to change the Data Source for the grid.Click SalesPln OEP_QTP Data Source under General and select another Data Source to change it.
Tip:
You can also search for the Member in the search bar and use the auto-complete feature to select the Members for your grid.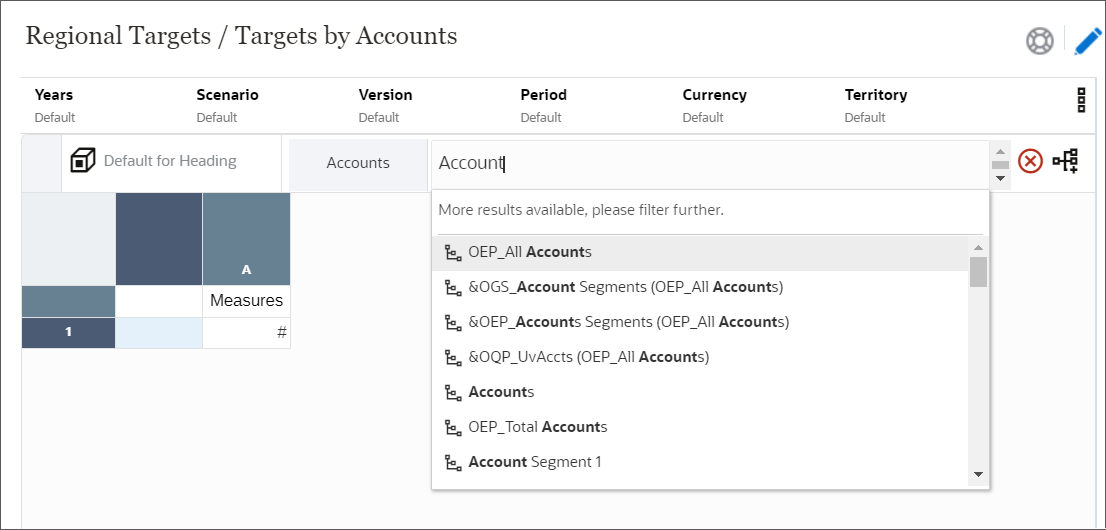
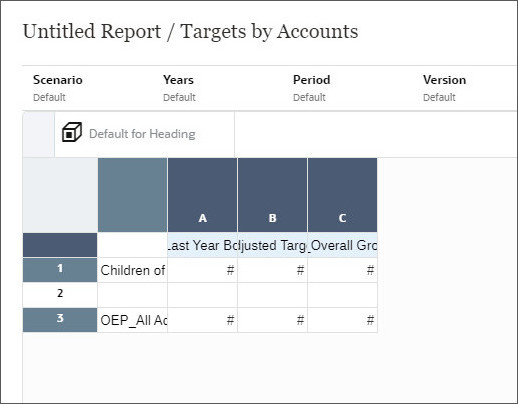
A separator row is added to the grid.
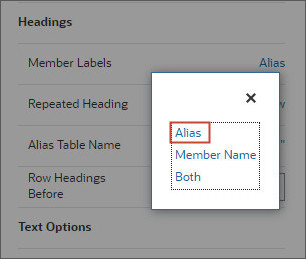
You can set the Member Label to Alias, Member Name, or Both.
You can also click ![]() (Dimension) to select the appropriate label for Heading.
(Dimension) to select the appropriate label for Heading.
Saving Reports
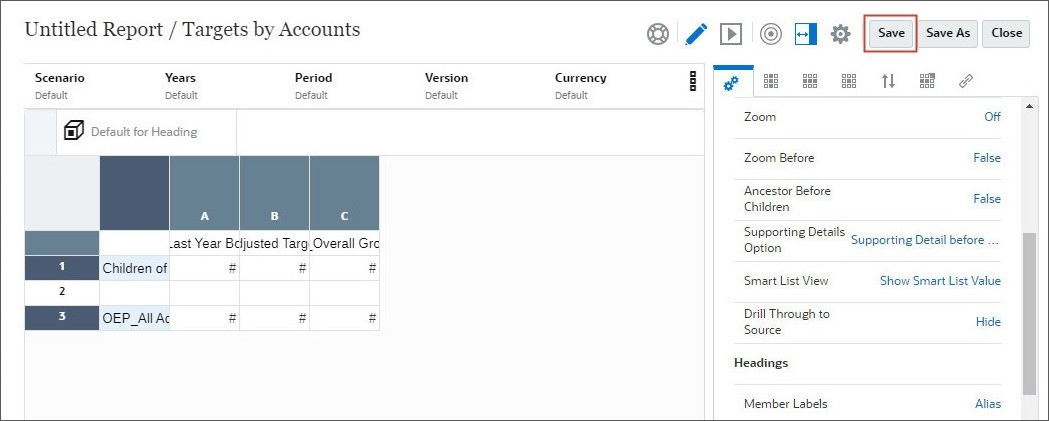
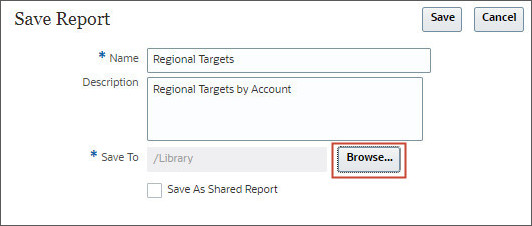
- On the top-right, click Save to save the report.
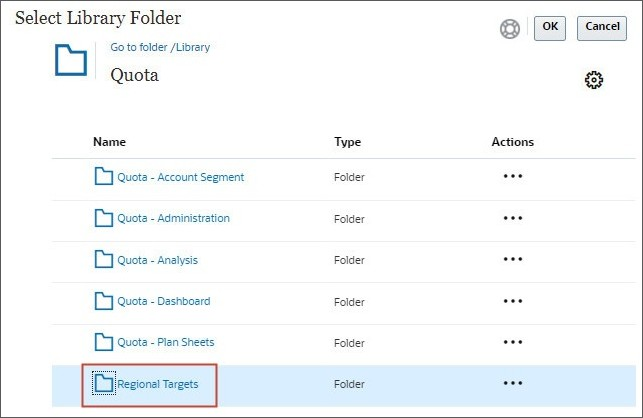
- Enter Regional Targets as the Name and click Browse.
- Click Quota folder, then select Regional Targets folder and click OK.
- Click Save.
Previewing Reports
You preview the report to see how it looks. You can view the report in HTML or PDF.
- Click
 (Preview).
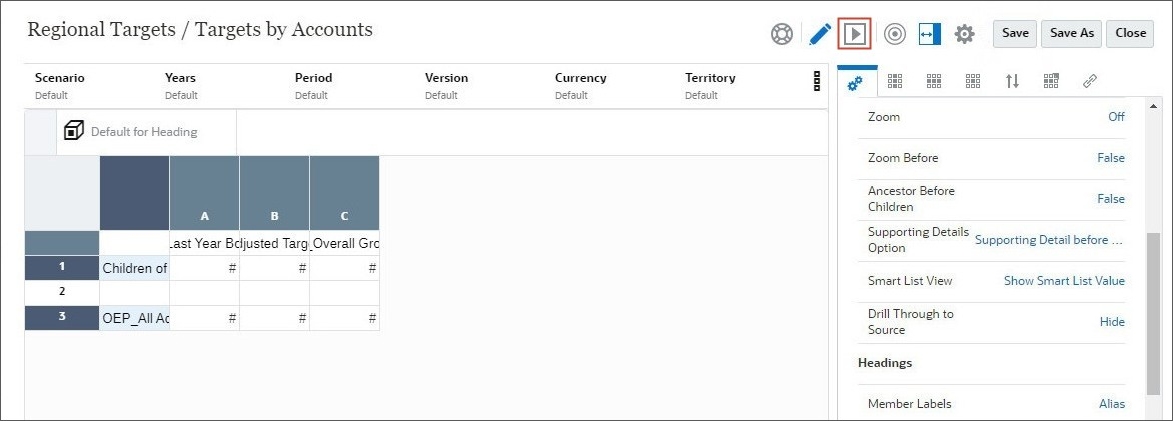
The report preview is opened. You can switch between preview and edit mode by using the
(Preview) and  (Edit) icons.
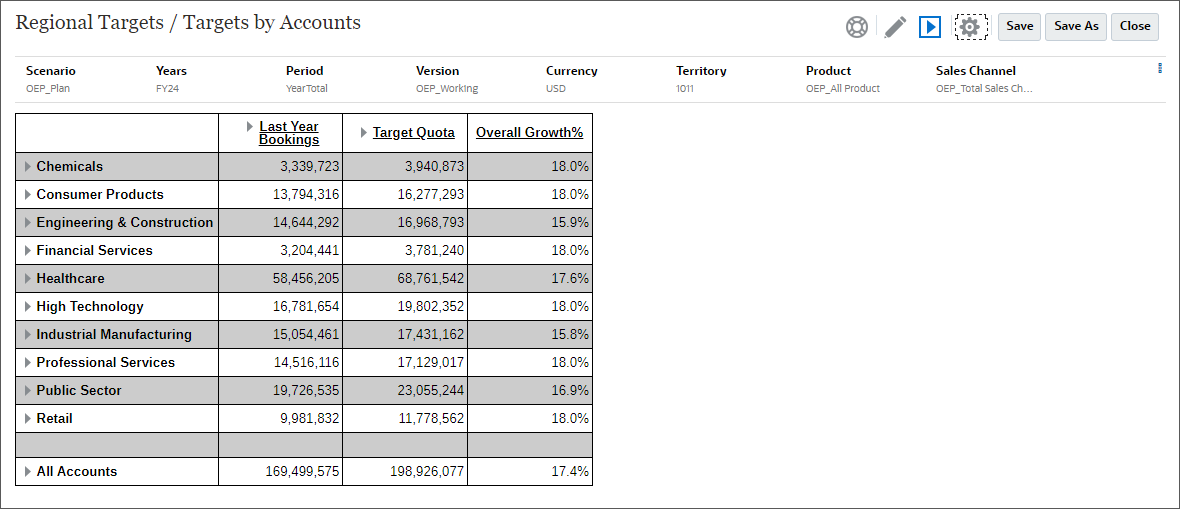
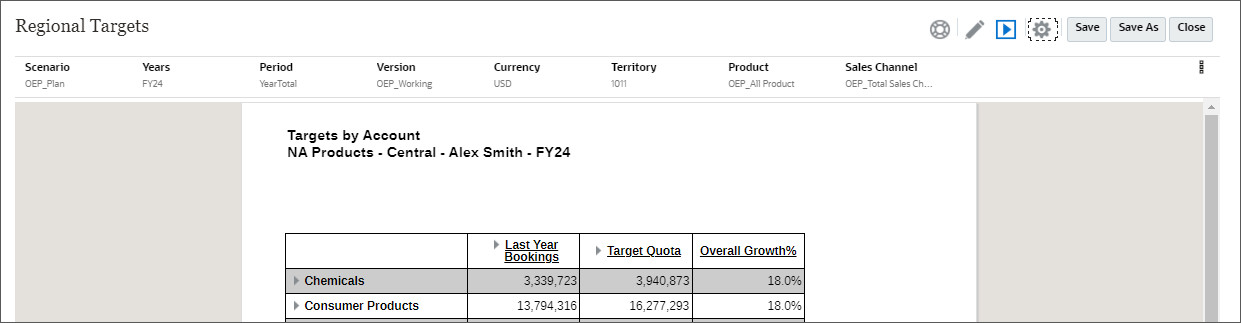
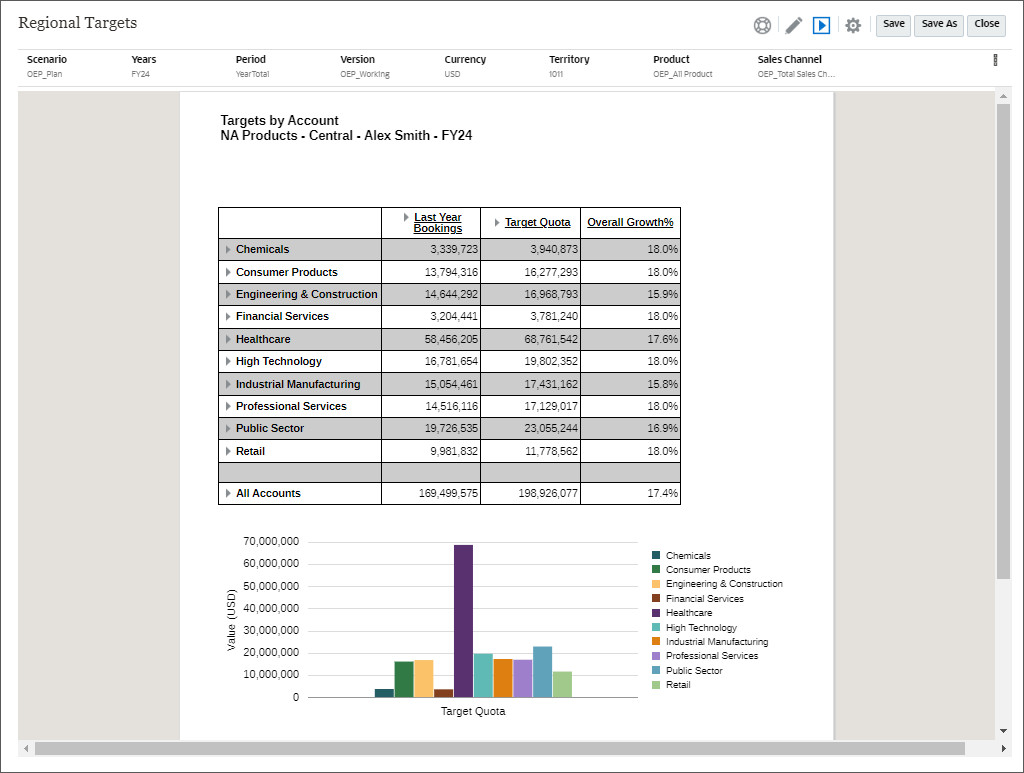
- Period: YearTotal
- Years: FY24
- Scenario: OEP_Plan
- Version: OEP_Working
- Currency: USD
- Territory: 1011
- Product: OEP_All Product
- Sales Channel: OEP_Total Sales Channel
- Click (Edit) to go back to the
editor
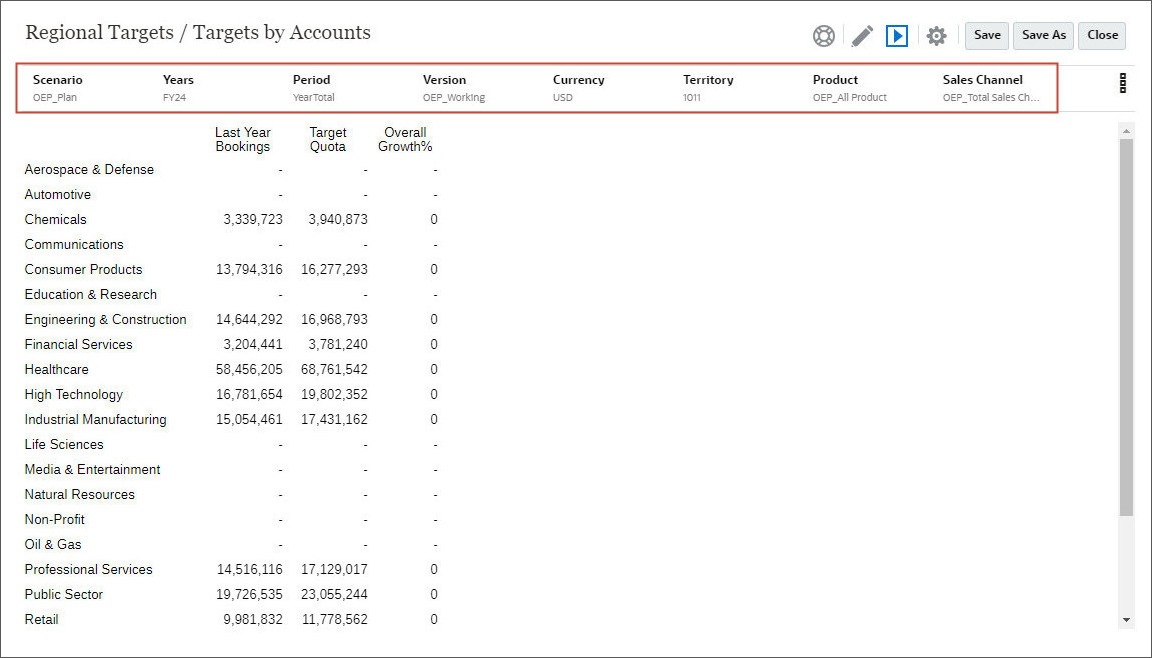
Tip:
Ensure that the report POV is set as the following members:Formatting Grids
You can format numbers, apply currency formats, align and replace text, hide and sort rows and columns, modify the font, create custom colors, and add borders and shading.
Within grids, you can also insert rows or columns into a grid to add data to the grid. Types of rows and columns include:
- Data - Members of dimensions that are retrieved from a database connection. The member in a data row or column defaults to the top-level member of the dimension. A # symbol indicates data rows, columns, or cells.
- Formula - Values based on formulas. Commonly used to calculate totals, averages, and variances on data rows or columns. An # symbol indicates formula rows, columns, or cells.
- Text - Text typed into the cells or added dynamically through a text function. Text rows, columns, or cells in grids do not contain symbols when added to a grid. They are initially blank until populated with text.
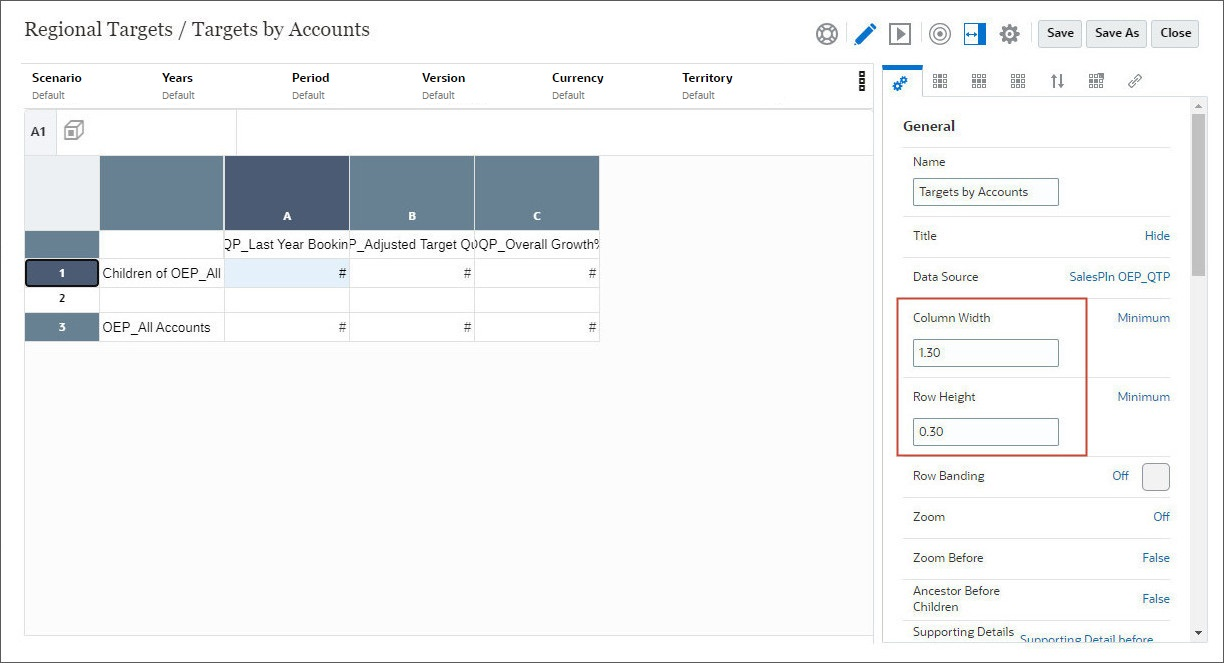
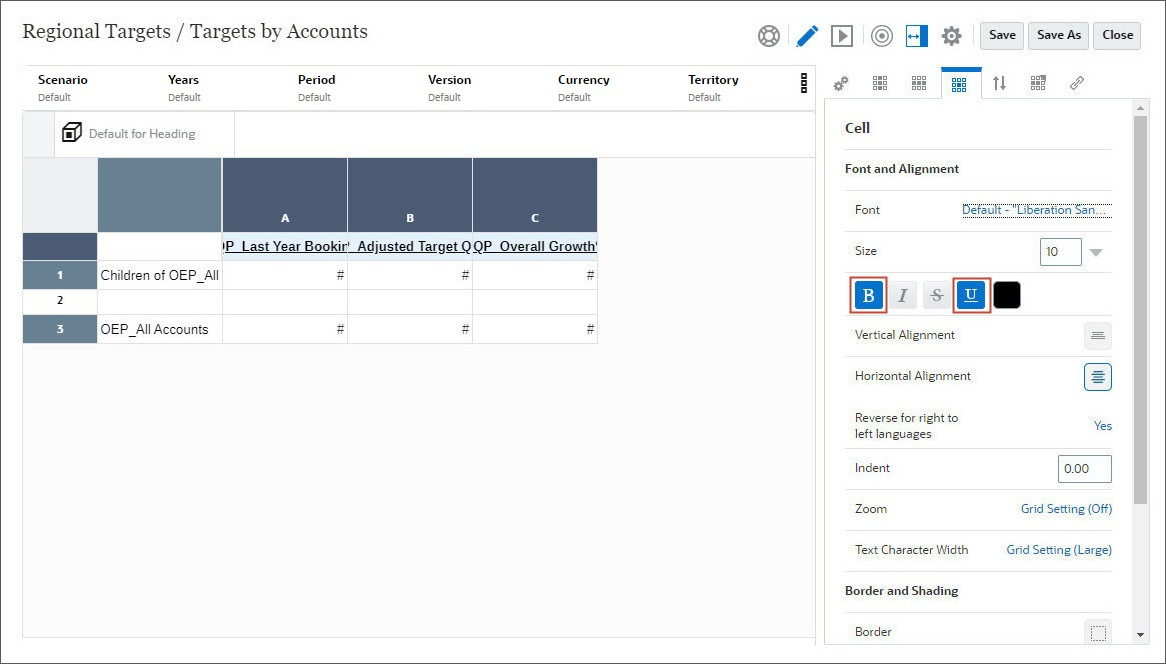
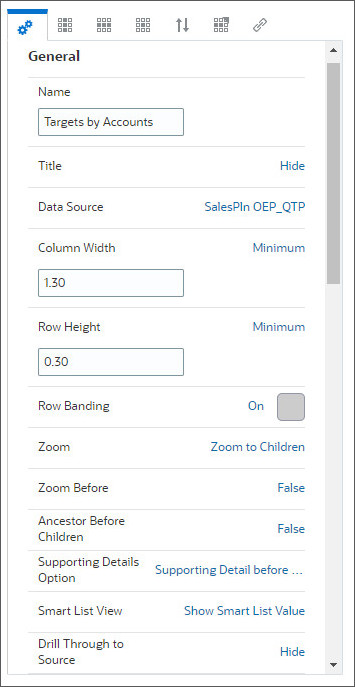
- On the right side, under General, for Column Width, enter 1.30 and for Row Height enter 0.30.
- Select all column headings, and click
 (Cell
Properties).
(Cell
Properties). - Click
 (Bold) and
  (Underline).
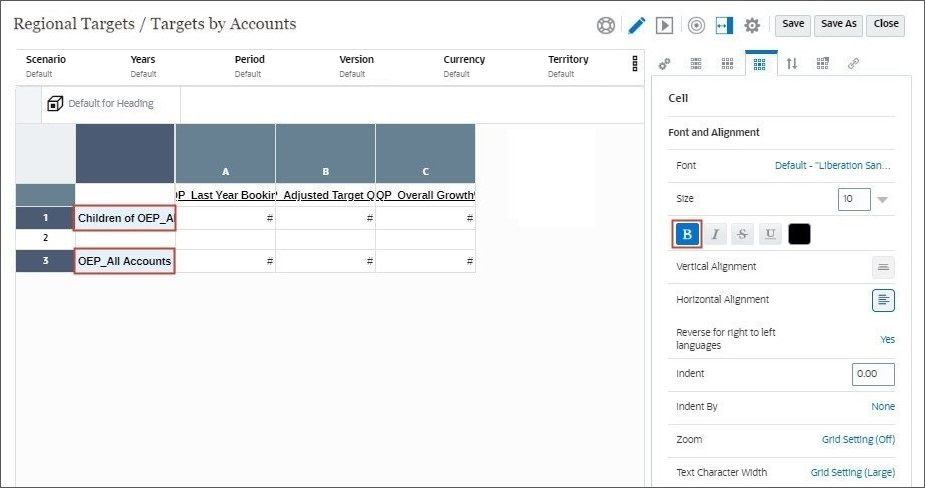
 - Select all row headings, and click (Bold).
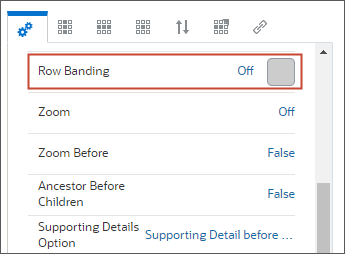
- Select
 (General) and change
Row Banding from Off to On.
(General) and change
Row Banding from Off to On.
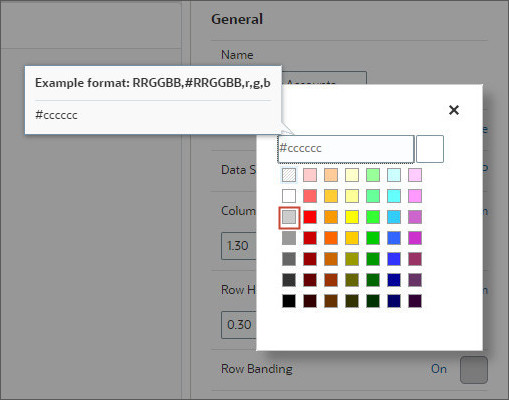
- Select the following color for row banding.
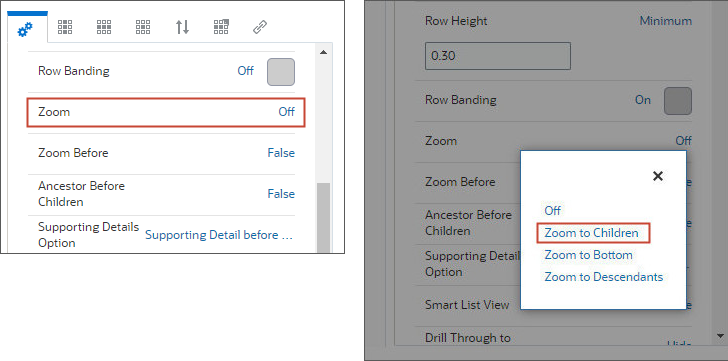
- Click Zoom (Off) and select Zoom to Children.
- Review the General Properties for the Grid.
- Scroll down to review Headings.
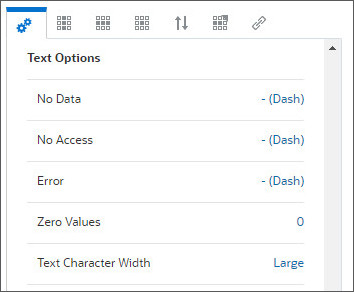
- Scroll down to review Text Options. You can change how the text is displayed from these options.
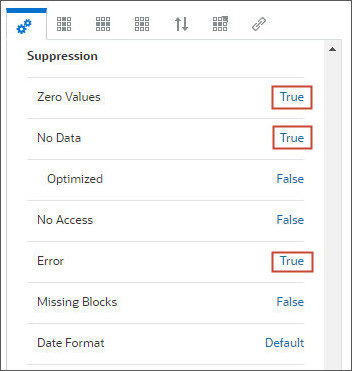
- Scroll down to set Suppression Options. Set the following to true:
- Zero Values - True
- No Data - True
- Error - True
- Select all the columns, and click
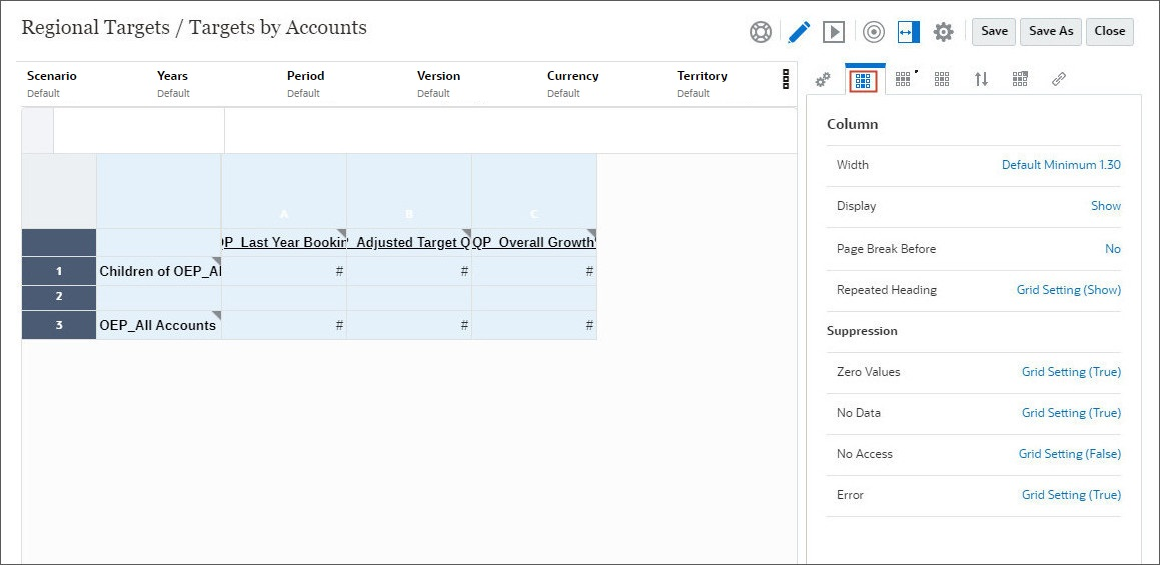
 (Column Properties). Review the Column Properties.
 - Select all the rows, and click
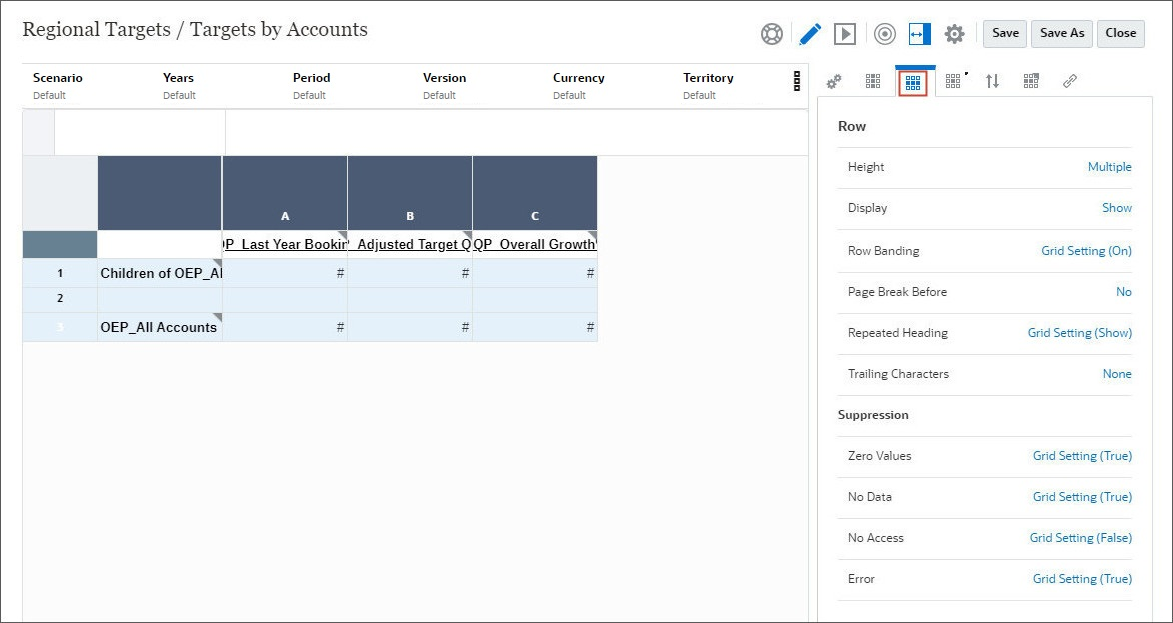
 (Row
Properties). Review the Row Properties.
(Row
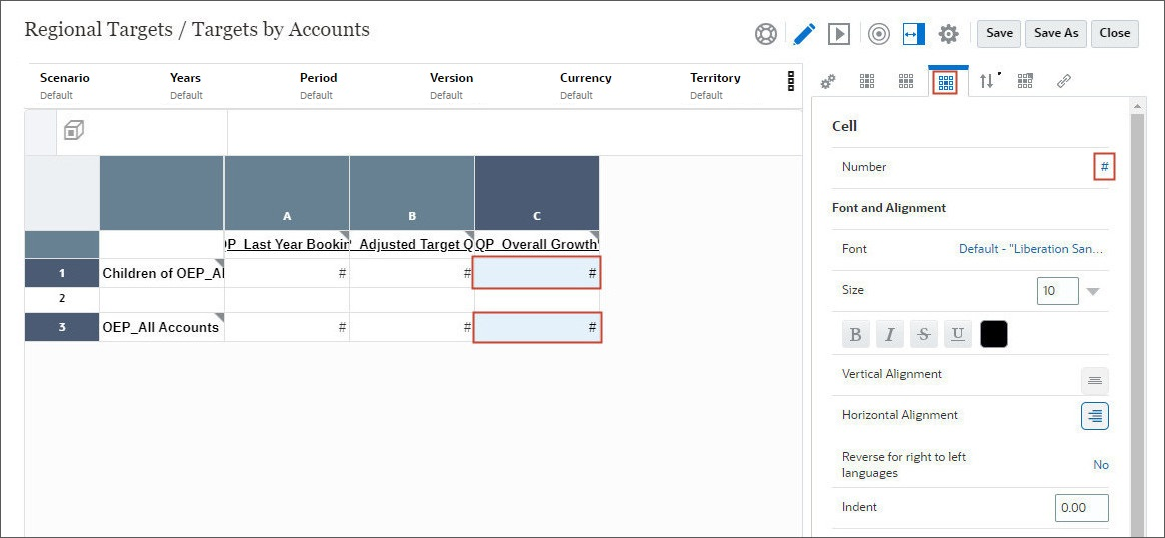
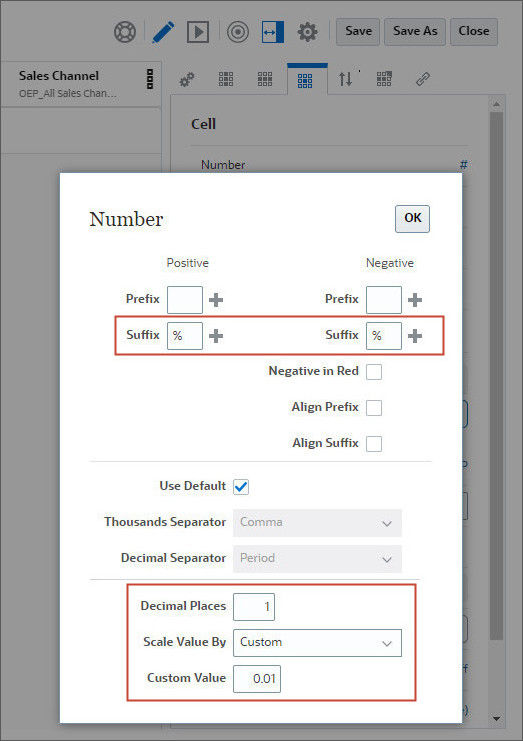
Properties). Review the Row Properties. - Select the data cells in column C, right-click and click (Cell Properties).
- Click Number (#) to format the cells.
- Format the cells with the following criteria:
- In Positive Number Symbols, for Suffix, select %.
- In Negative Number Symbols, for Suffix, select %.
- In Decimal Places, enter 1.
- In Scale Value By, select Custom.
- In Custom Value, enter 0.01.
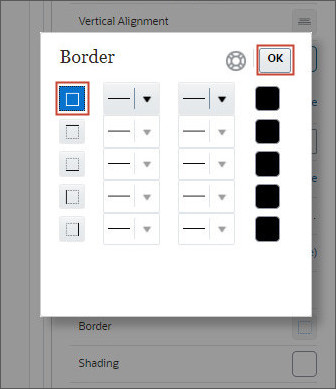
- Select all the cells in the grid and click
 (Border).
 - Select the first option to add border on all sides. Click OK.
- Review the final Grid.
- Click
(Preview) to preview the Grid.
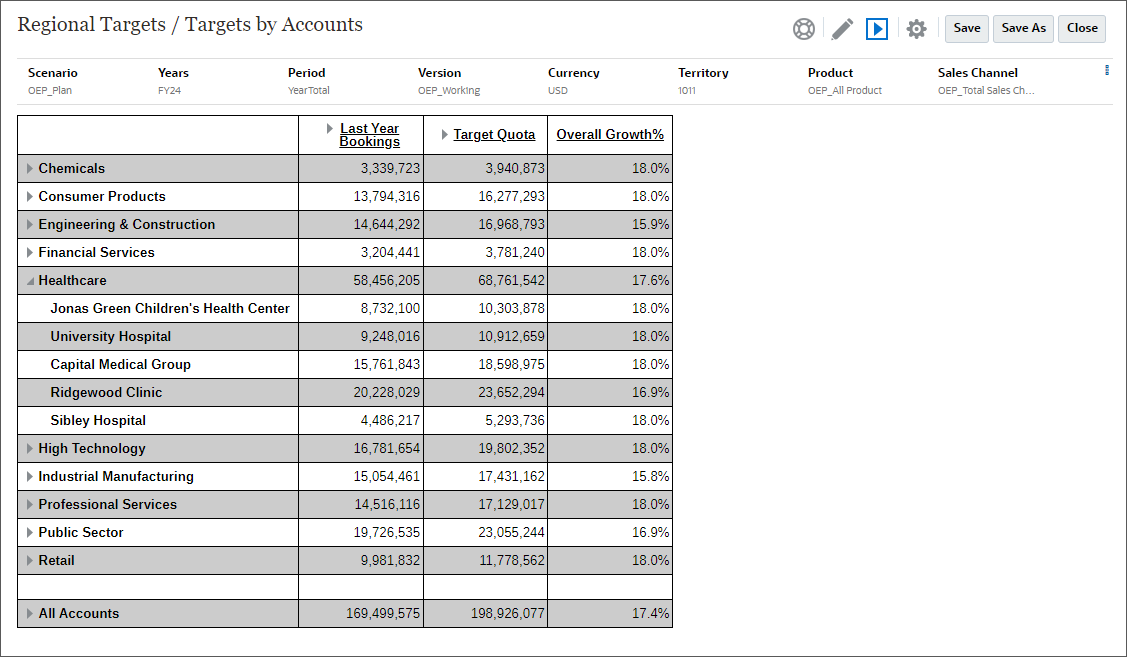
- In the grid, click
(Zoom in) to view accounts within Healthcare.
- Click Save to save the report.
- Click Close to close the preview.
Tip:
You can use the control or shift keys to make multiple selections.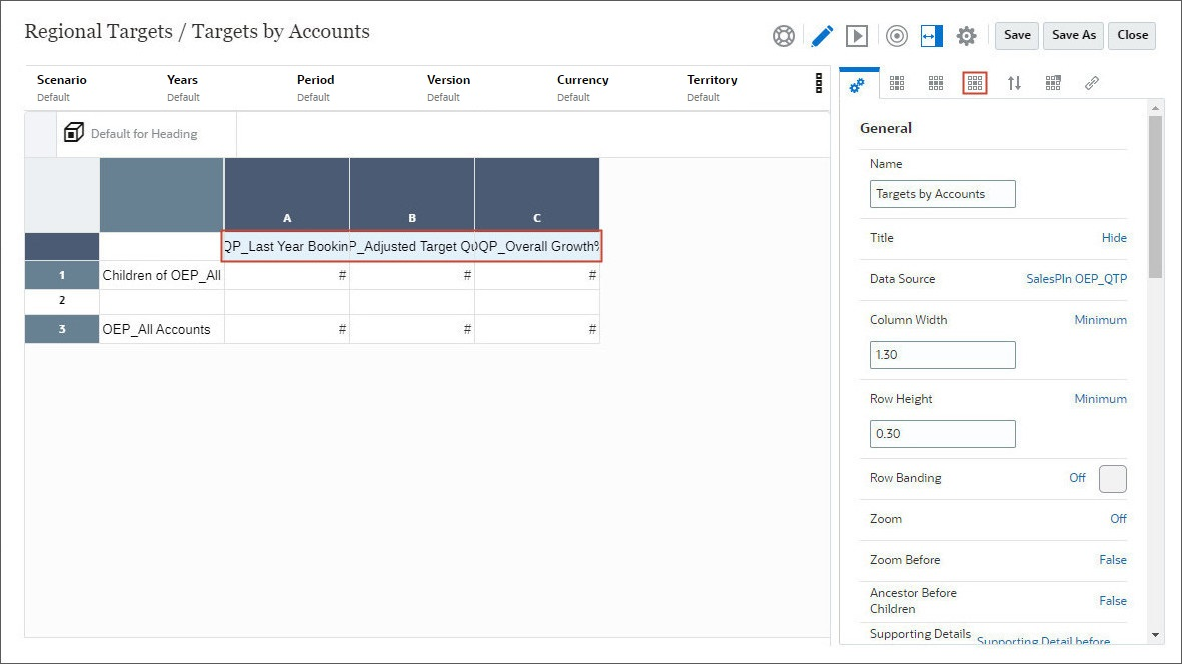

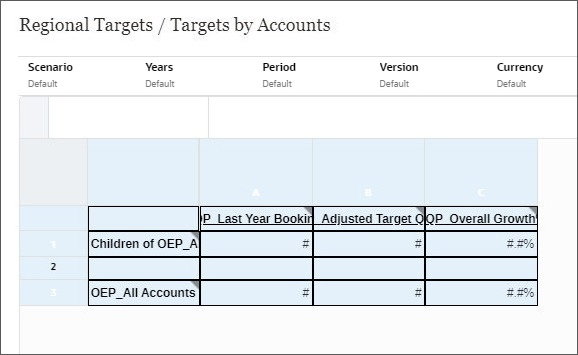
The grid is displayed with the formatting.
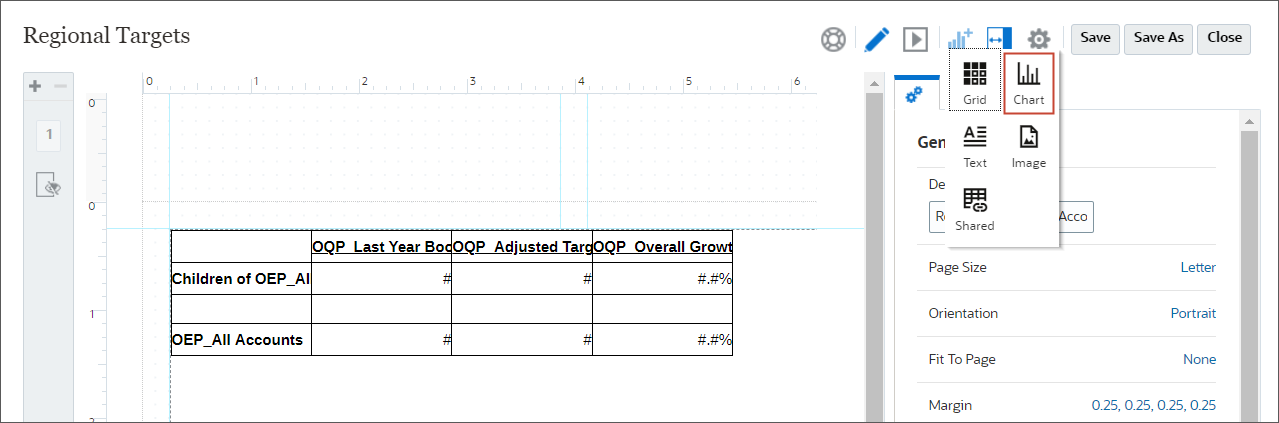
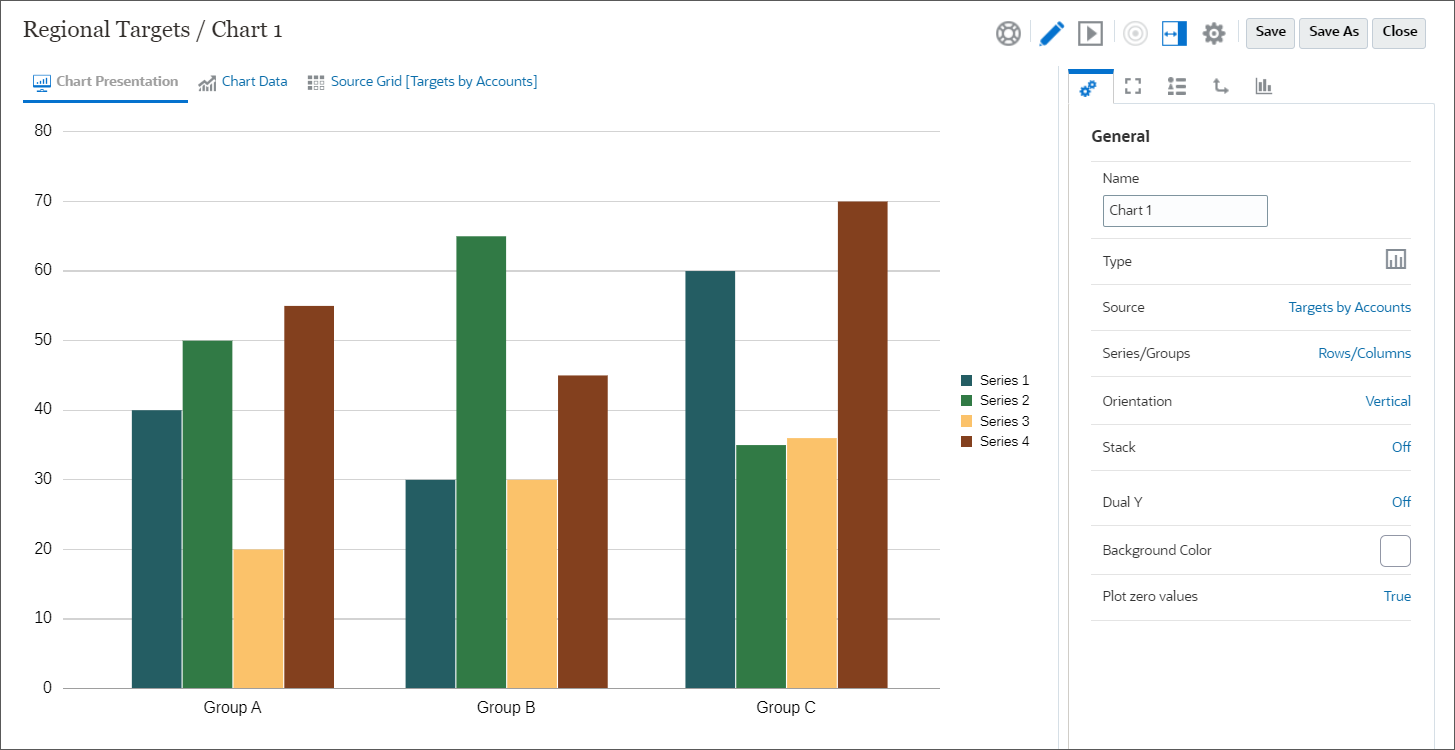
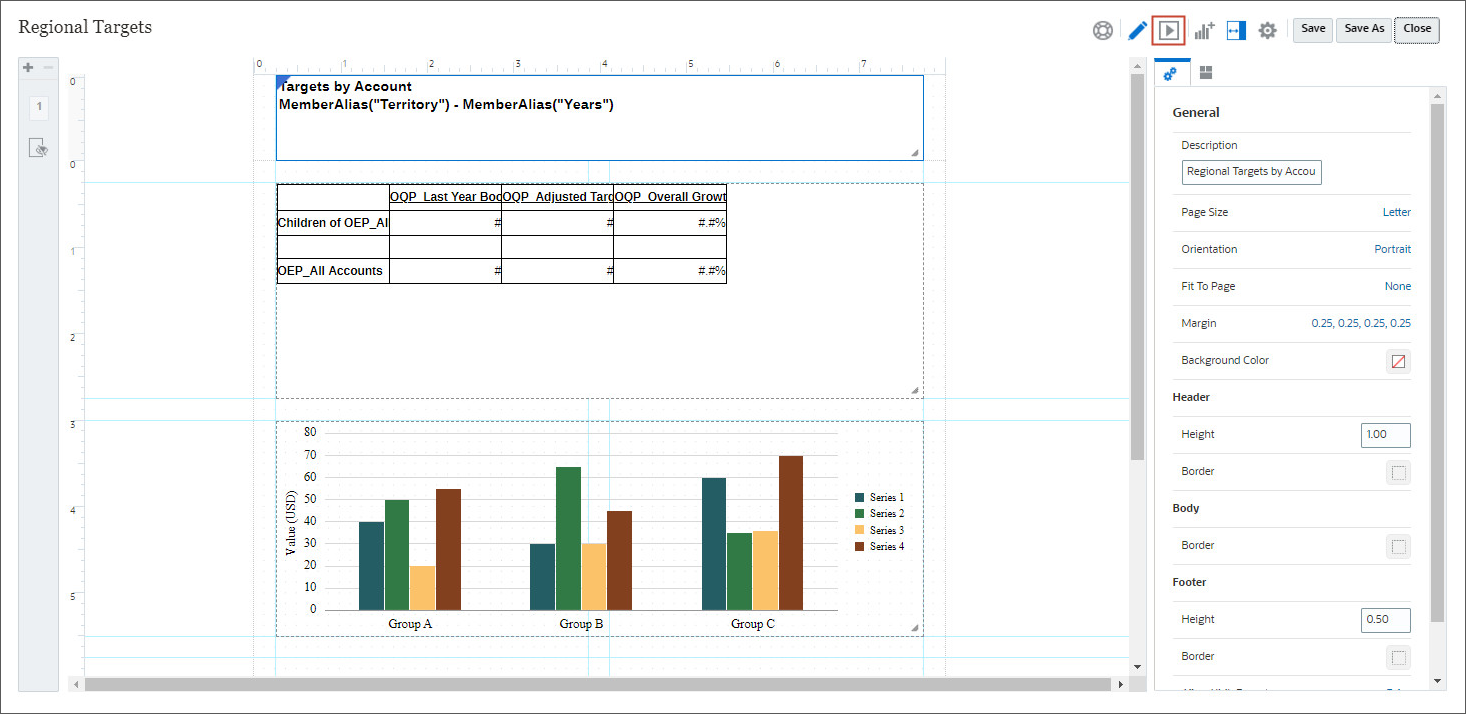
Adding Charts to Reports
You can include a chart to show a graphical representation of report data from a grid on a report.
- On top-right, click
 (Add), and select Chart.
- Click Setup Chart to configure the chart.
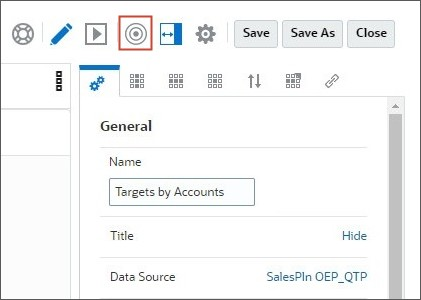
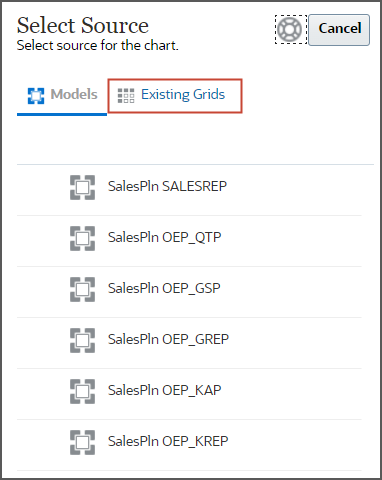
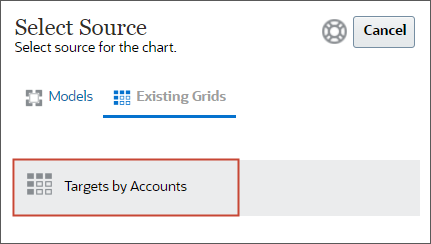
- Select Existing Grids.
- Select Targets by Accounts.
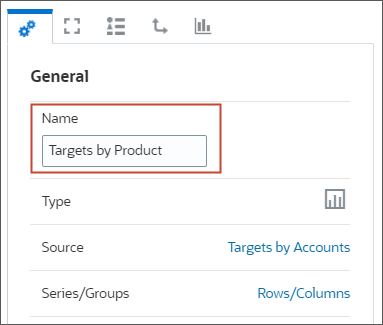
- On the right, under General, for Name, enter Targets by Product.
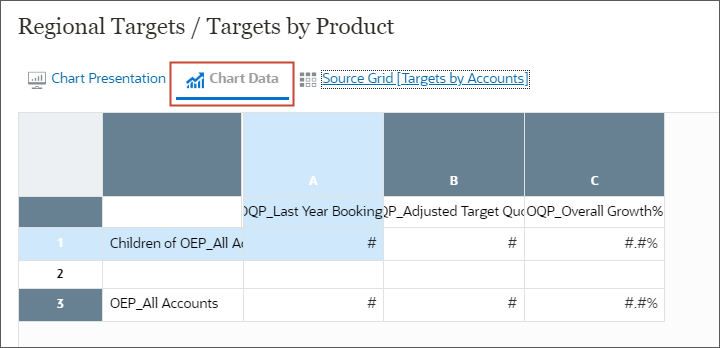
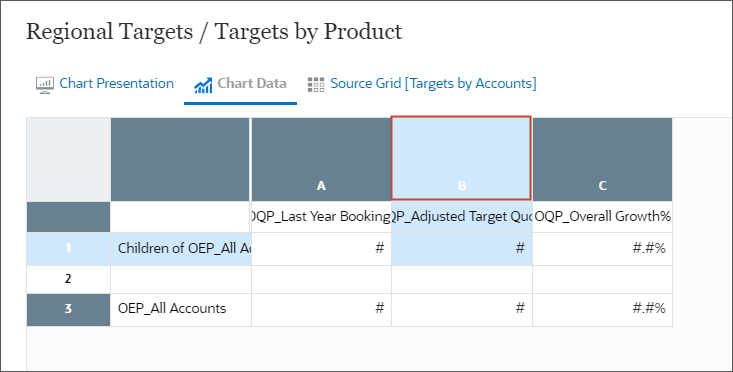
- Click Chart Data tab to setup data range for the chart.
- Click column A to deselect it and click column B to select
it.
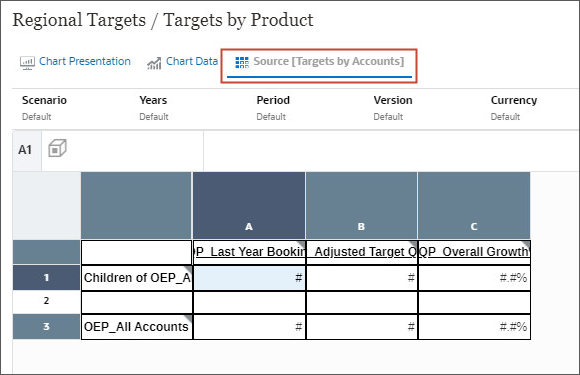
The chart data range will be an intersection of Row 1 (Children of OEP_All Accounts) and Column B (OQP_Adjusted Target Quota). - Click Source [Targets by Accounts] tab to review the source grid.
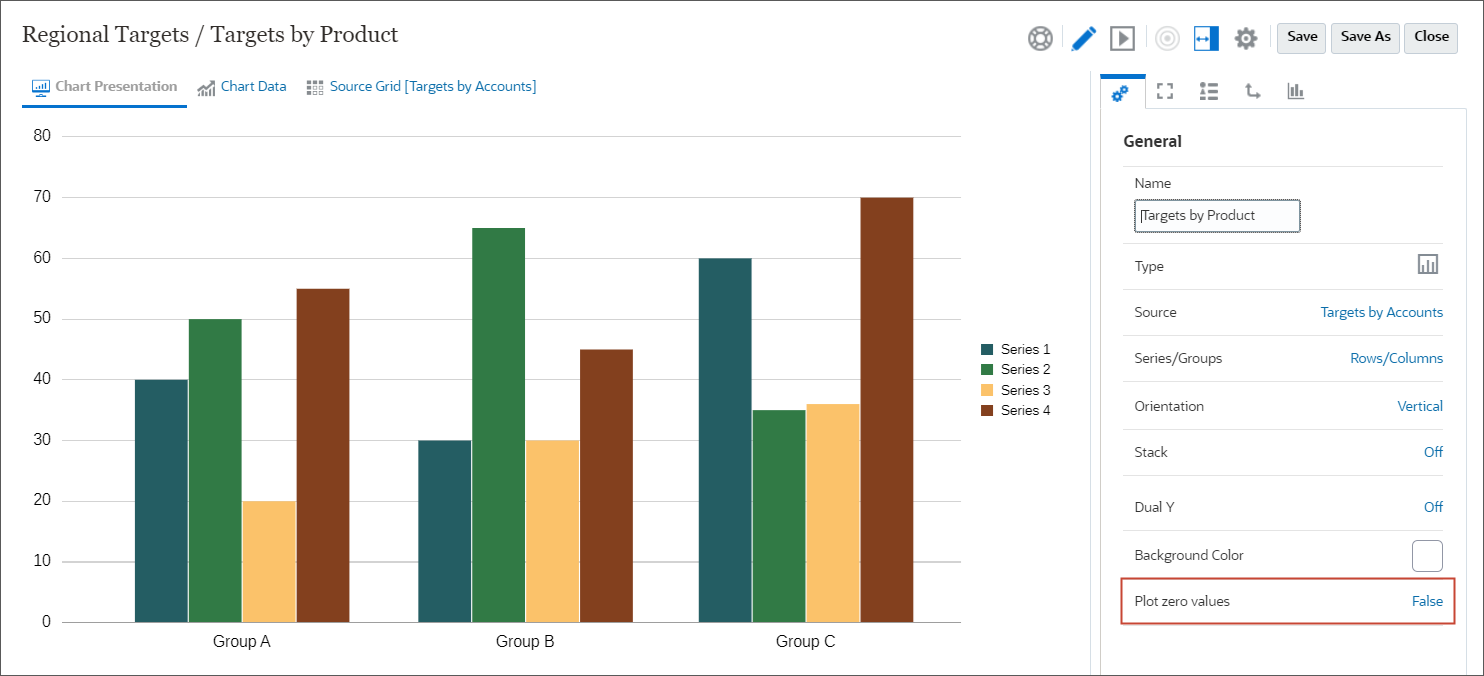
- Click Chart Presentation tab to configure the chart properties.
- Under General properties, change Plot zero values from True to False.
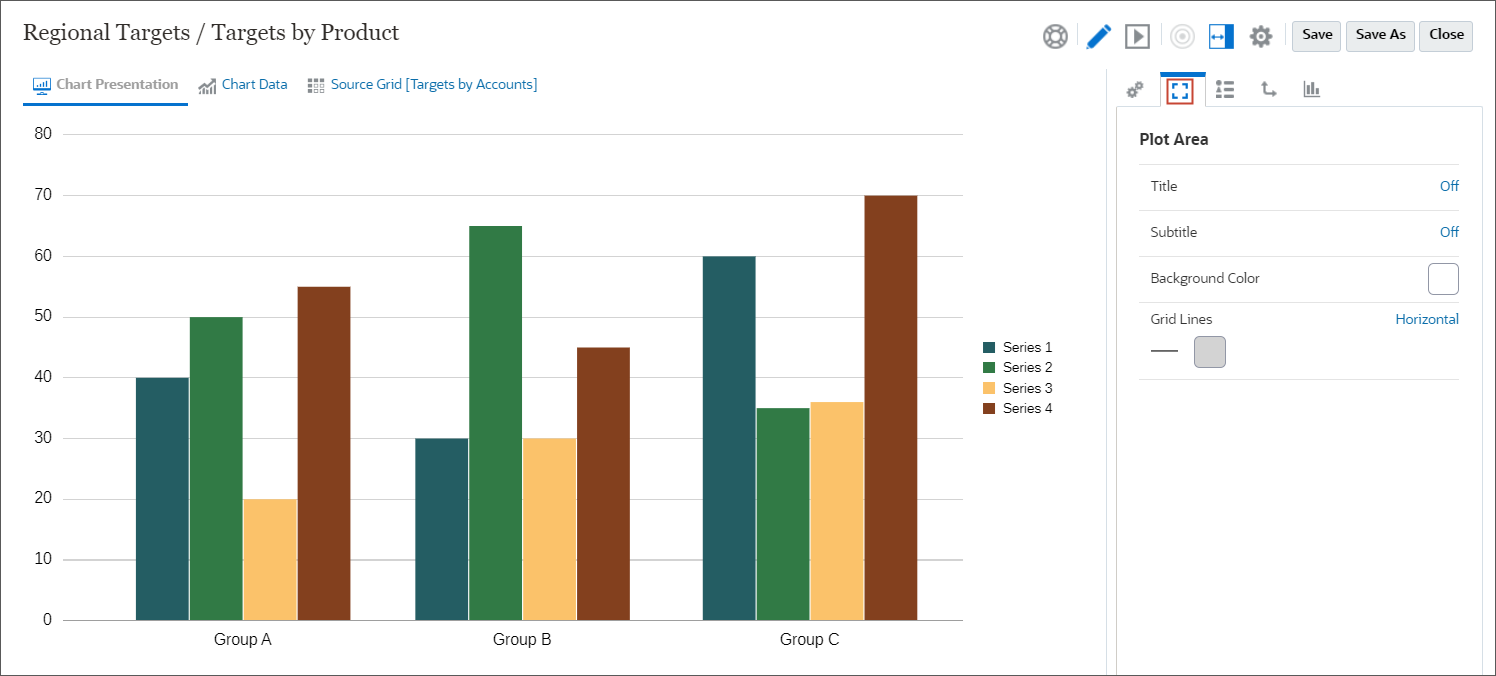
- Click
 (Plot Area) to
review Plot Area properties. You can change the chart background and grid line color under this
tab.
(Plot Area) to
review Plot Area properties. You can change the chart background and grid line color under this
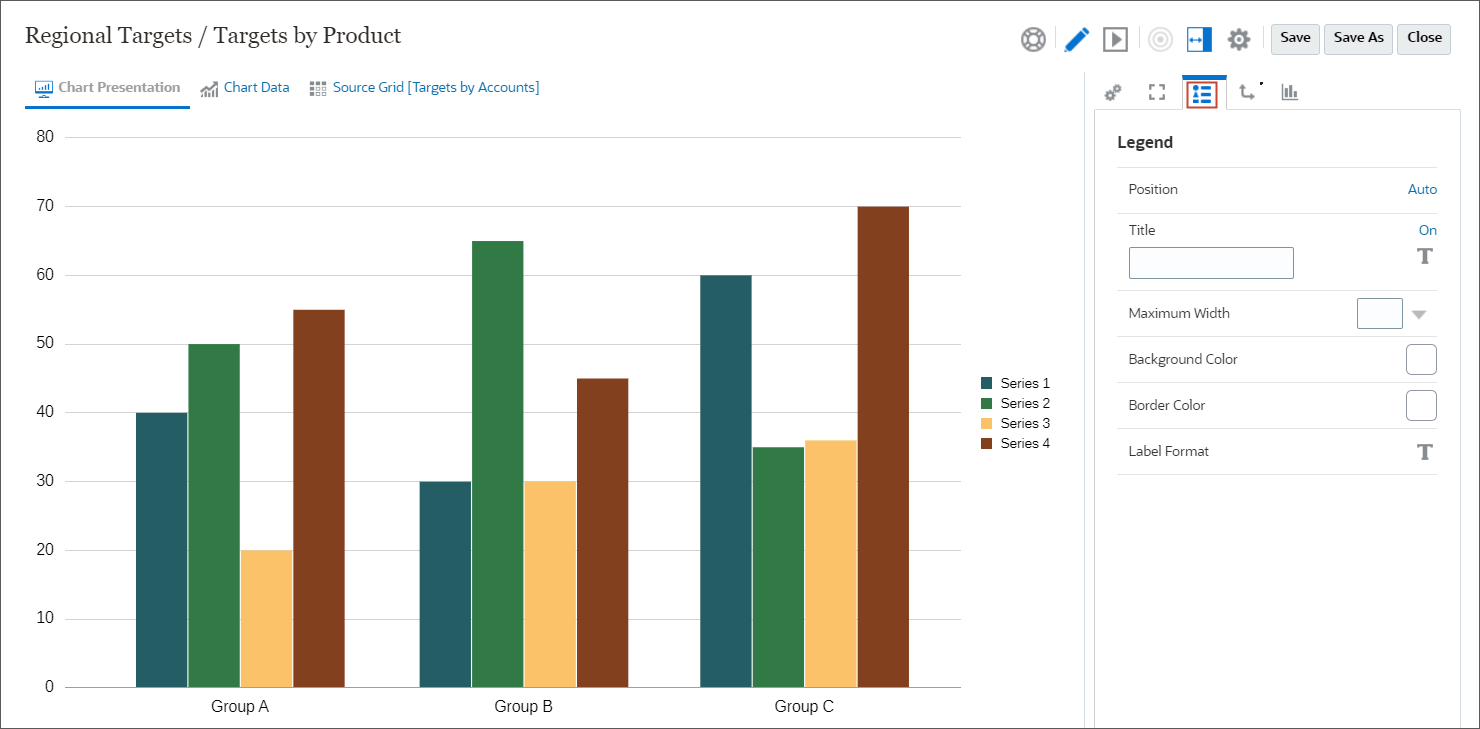
tab. - Click
 (Legend) to setup Legend
properties.
(Legend) to setup Legend
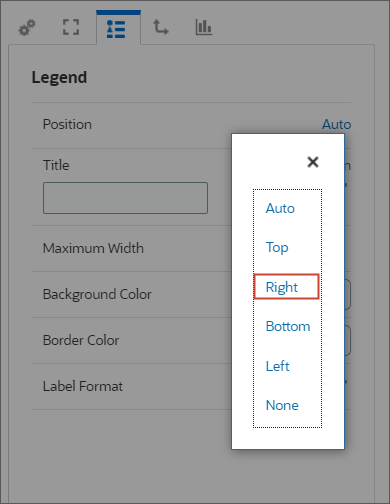
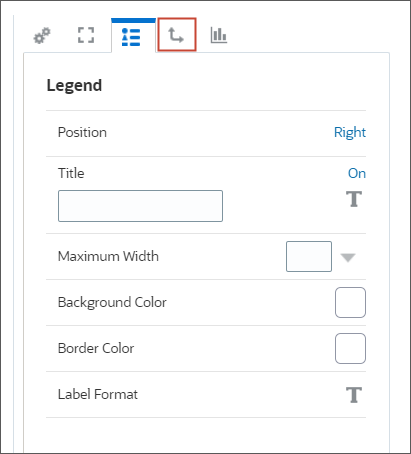
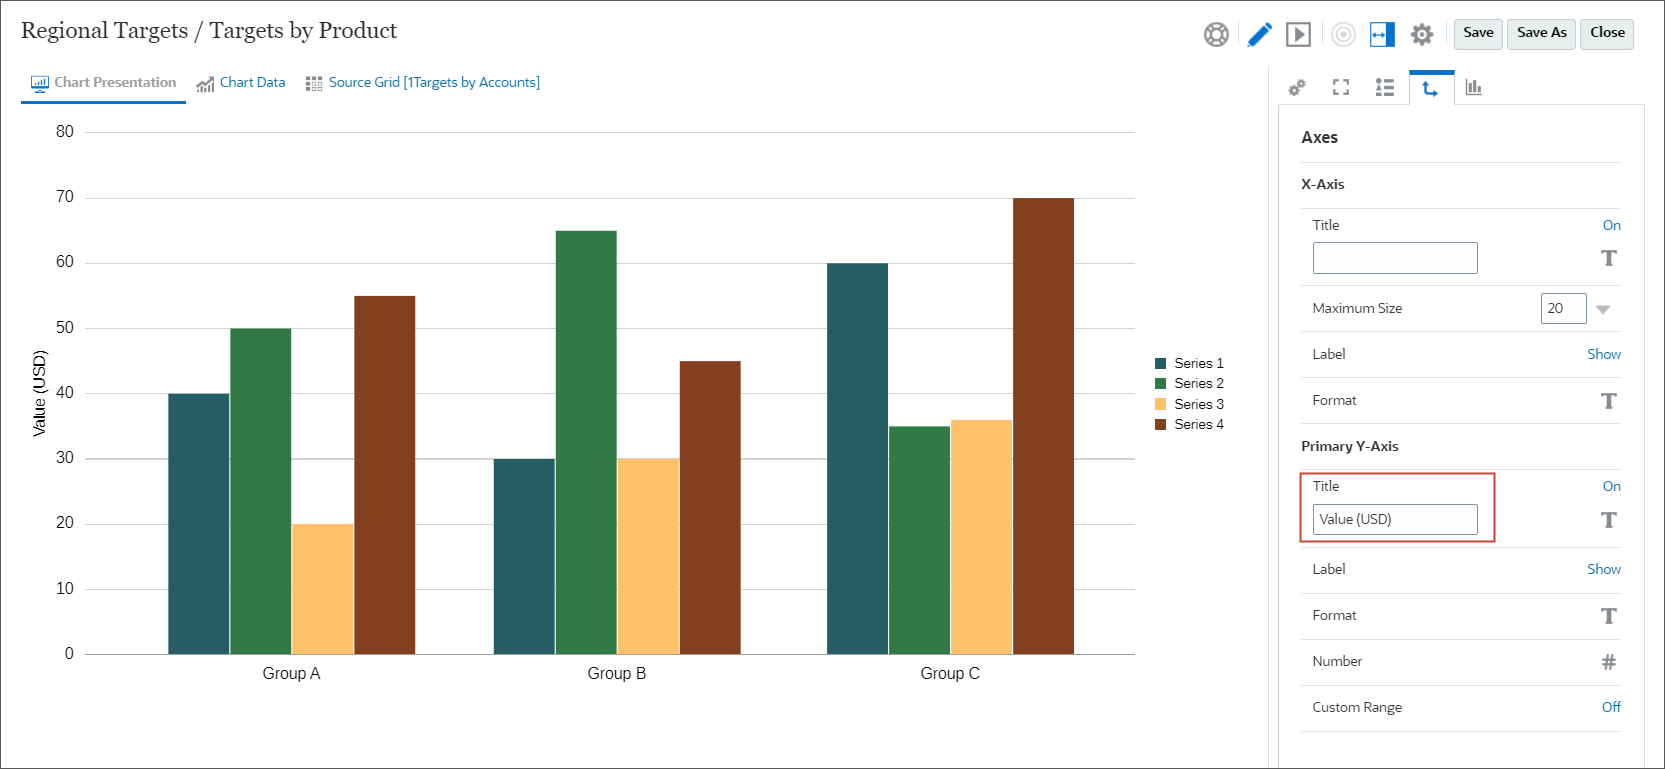
properties. - Under Legend, for Position, click Auto, and select Right to set legend position to Right.
- Click
 (Axes) to setup Axes
properties.
(Axes) to setup Axes
properties. - Under Primary Y-Axis, for Title, enter Value (USD).
- Click
 (Bar Options)
to review the Bar Options. You can change the color and fill properties of the bars under this
tab.
(Bar Options)
to review the Bar Options. You can change the color and fill properties of the bars under this
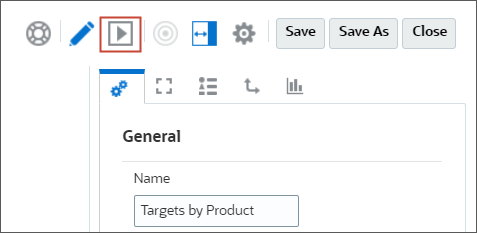
tab. - Click
(Preview) to preview the chart.
- Click Save to save the report.
- Click Close to close the preview.
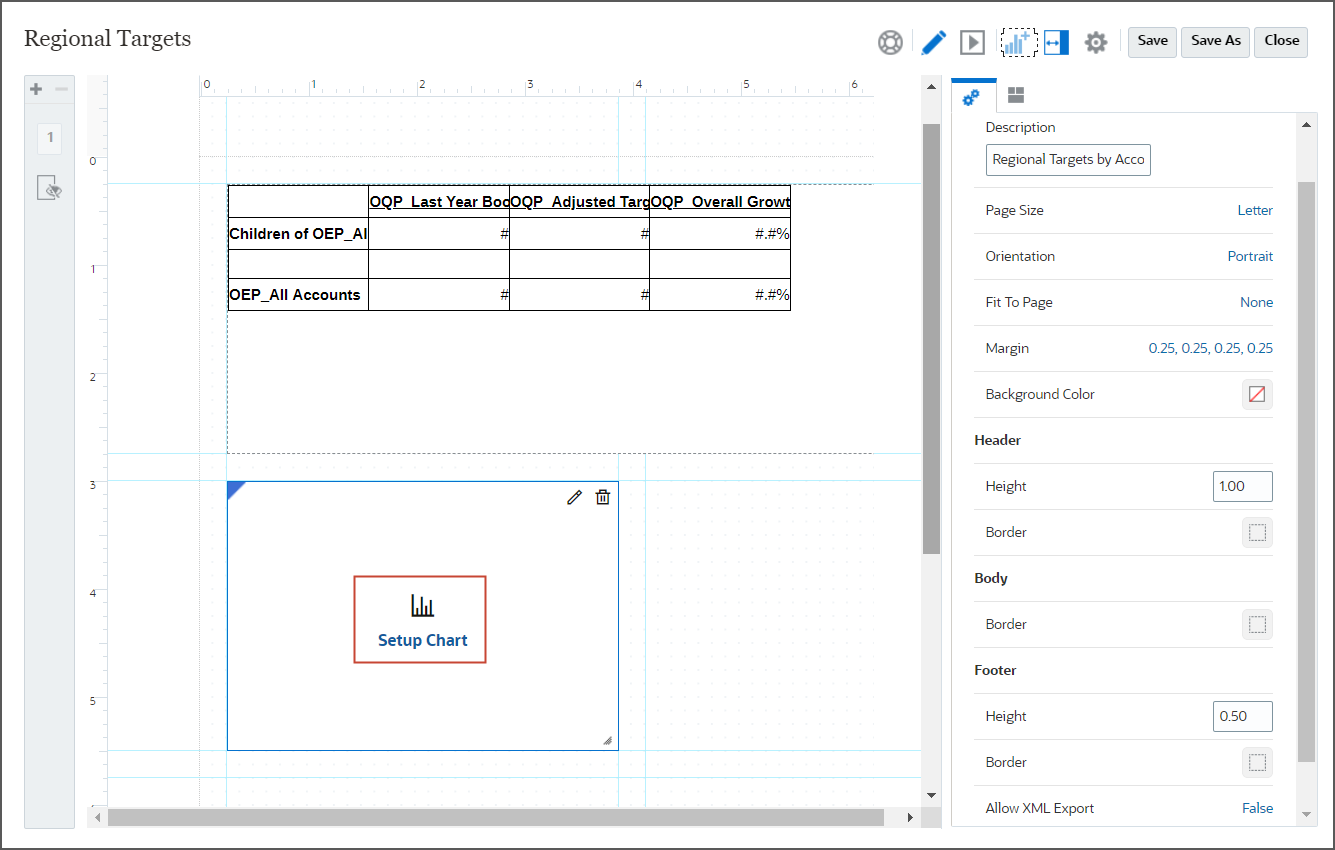
The chart editor opens in a new window.

The chart is displayed for the default POV.
Setting Up the Report Header
You set up the header which can include a text function. Text functions return report information, such as the report name or the report description.
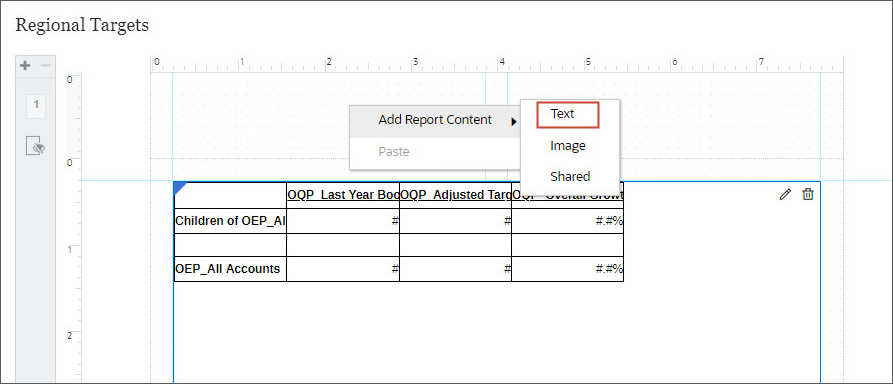
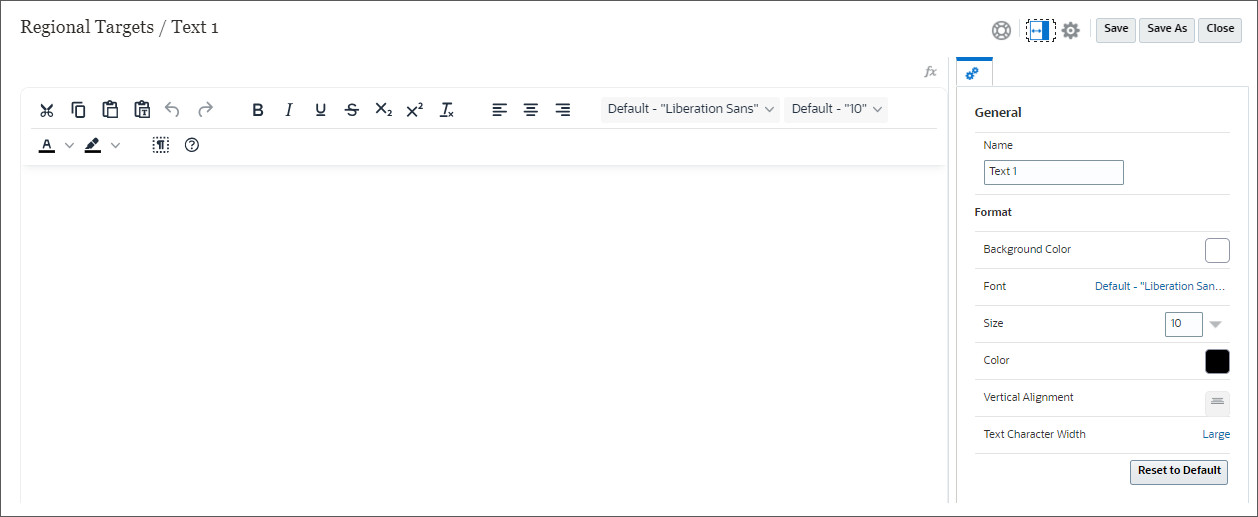
- Right-click on the report canvas, click Add Report Content and select Text.
- Click
 (Setup Text) to configure
the text.
(Setup Text) to configure
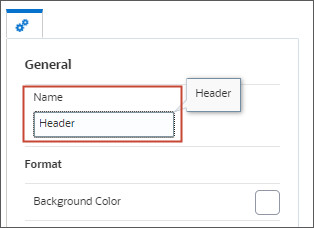
the text. - On the right, under General, for Name, enter Header.
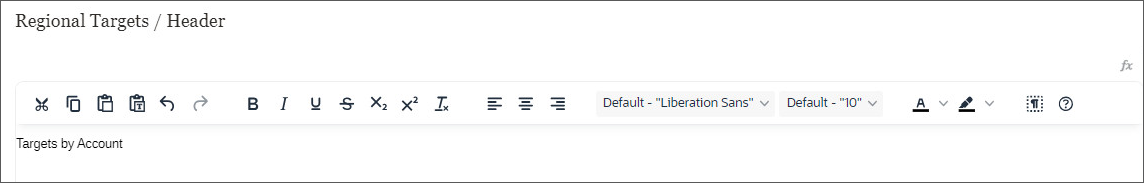
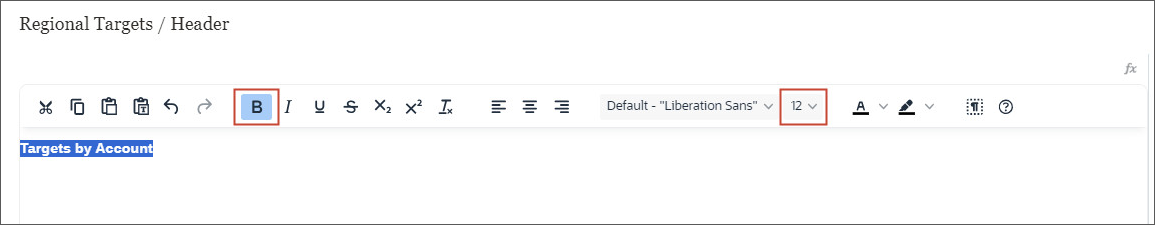
- In the text editor pane, enter Targets by Account.
- Select the text Targets by Account, click
 (Bold) and set the font size to
12 point.
(Bold) and set the font size to
12 point.
- Click at the end of the first line, and press enter to insert a new line. Make sure the cursor is on the new line.
- On the top-right, click (Text
Functions).
- From Available Text Functions, select MemberAlias, and for Dimension, select Territory.
- Click Select.
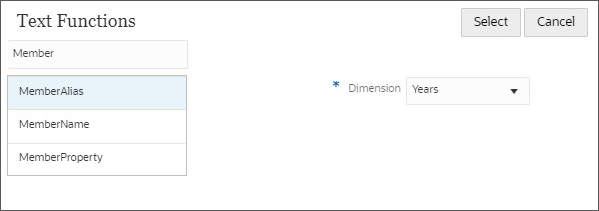
- After the inserted function, type a - (dash), and on the top-right, click (Text Functions).
- From Available Text Functions, select MemberAlias, and for Dimension, select Years.
- Click Select.
- Review the Header text and click Save, and then click Close.
- Click
(Preview) to preview the report.
- Click Close to close the preview.
The text editor opens in a new window.

Note:
Text functions return report information, such as the report name or the report description. You use text functions in grids or in text objects.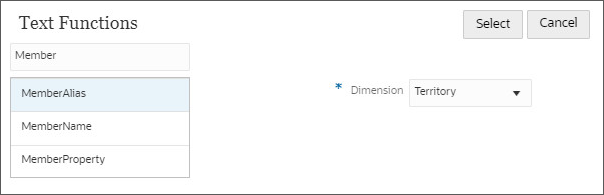

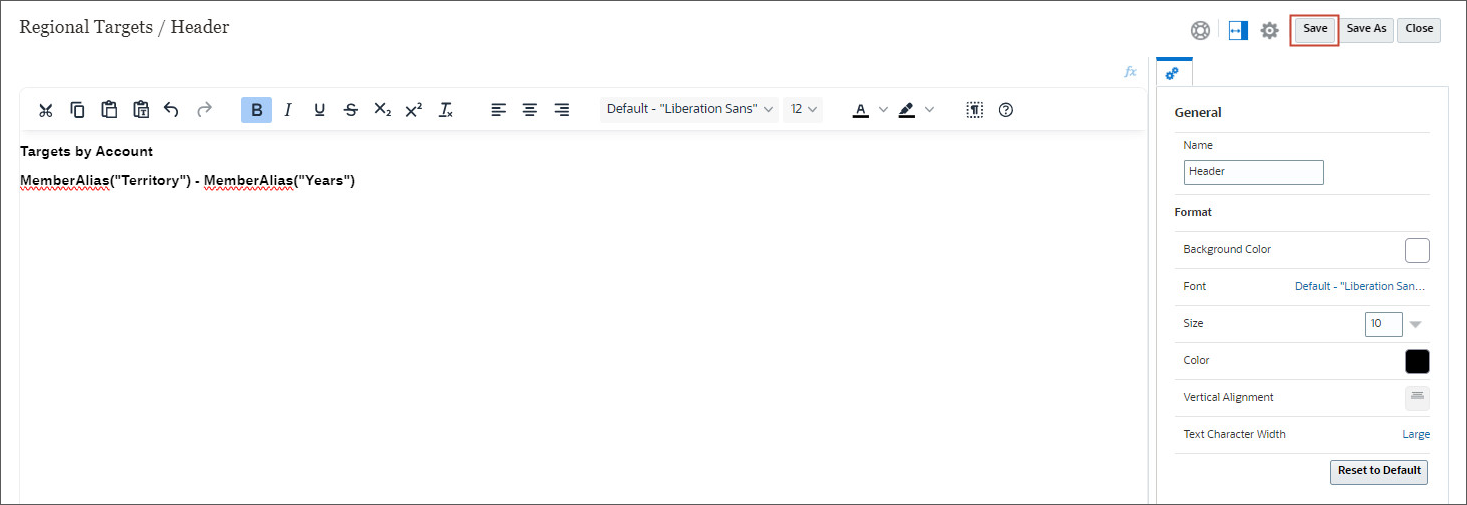
The report is displayed with the header data.
Running Reports
- To run reports in Oracle Sales Planning, navigate to the home page and click
Reports.
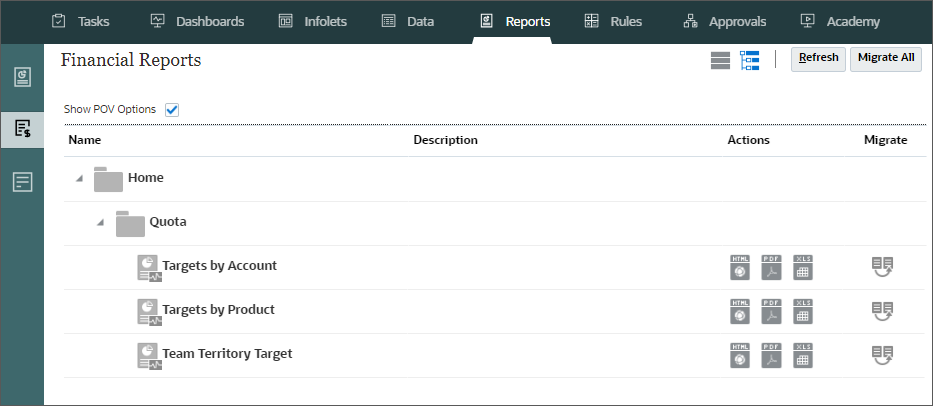
- Under Reports, expand Library, Quota and Regional Targets. The report you created is displayed under Regional Targets.
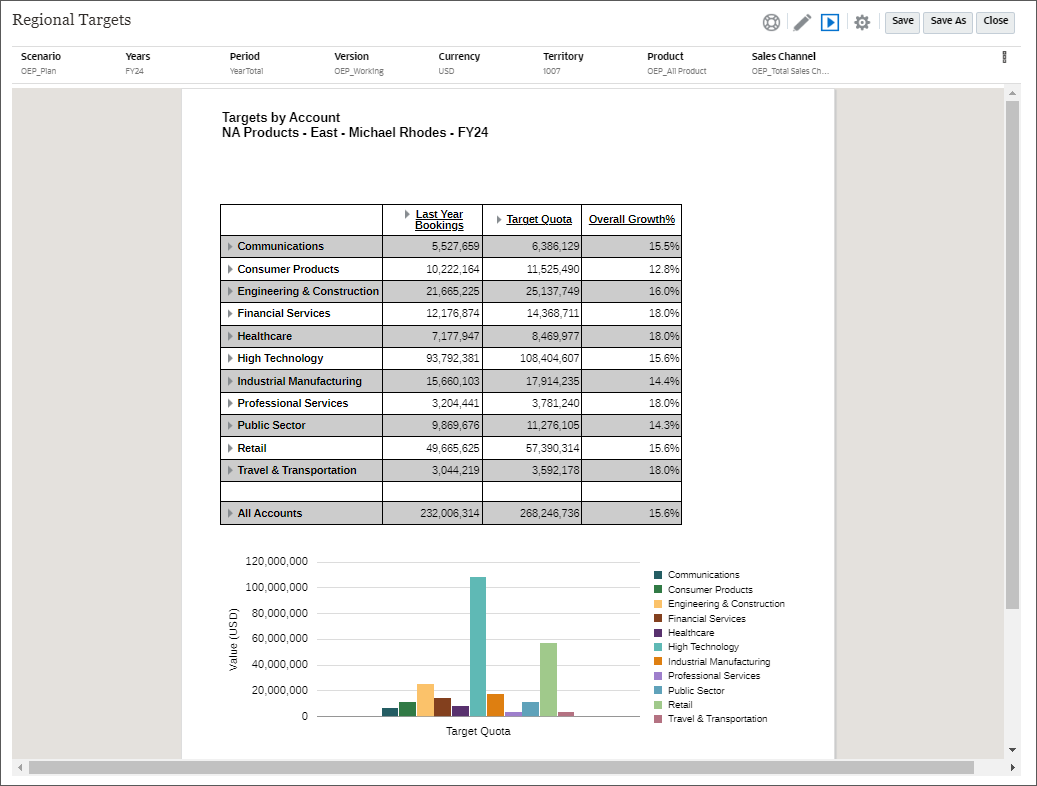
- Click
 (HTML) to view the
Report.
(HTML) to view the
Report.
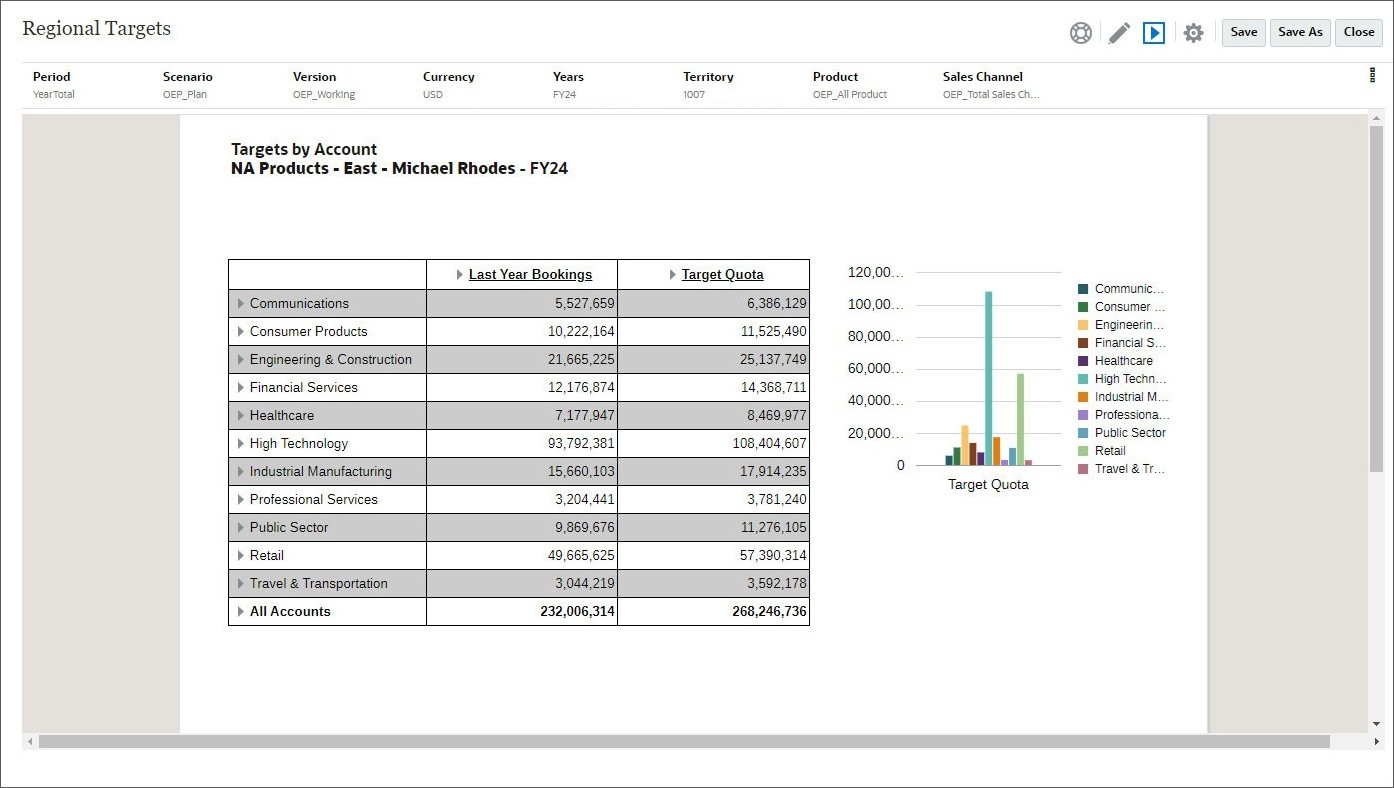
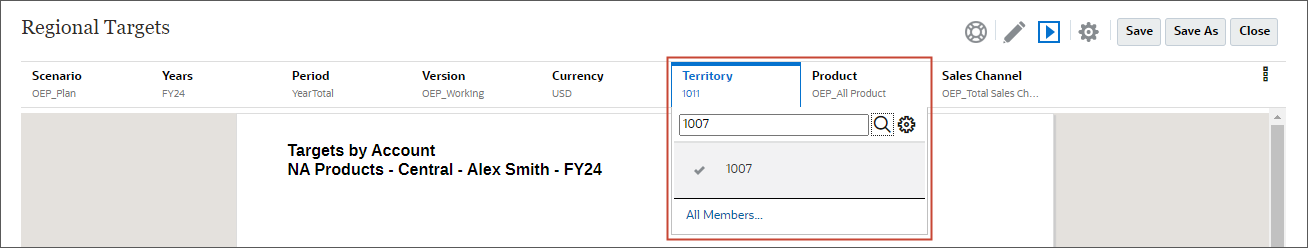
- In the POV, click Territory and select 1007 (NA Products - East - Michael Rhodes) to view the Report for Michael Rhodes.
- To view the Report in PDF format, click
 (Report Actions) and select PDF.
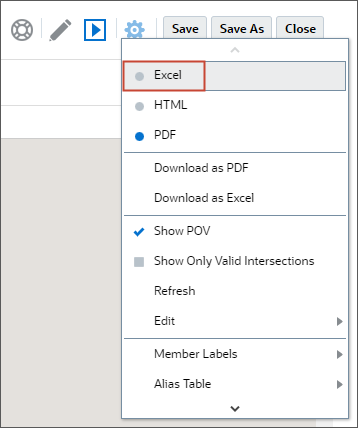
 - To download the report as an excel file, click (Report Actions) and select
Excel
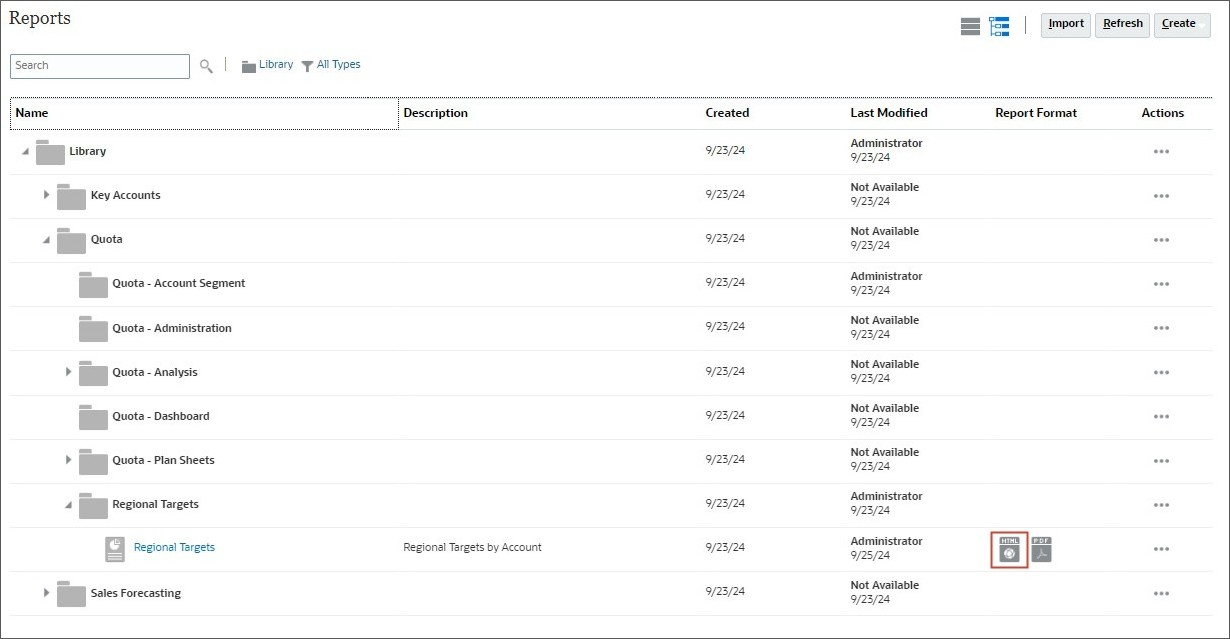
A report is displayed with the Regional Targets by Accounts.
A report is displayed for the selected Territory.
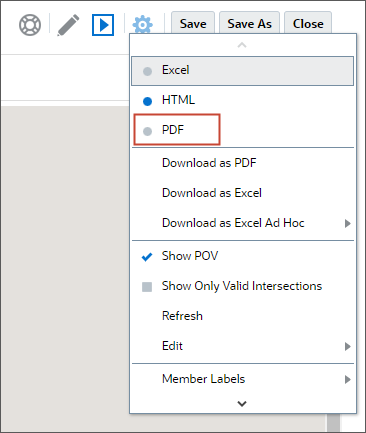
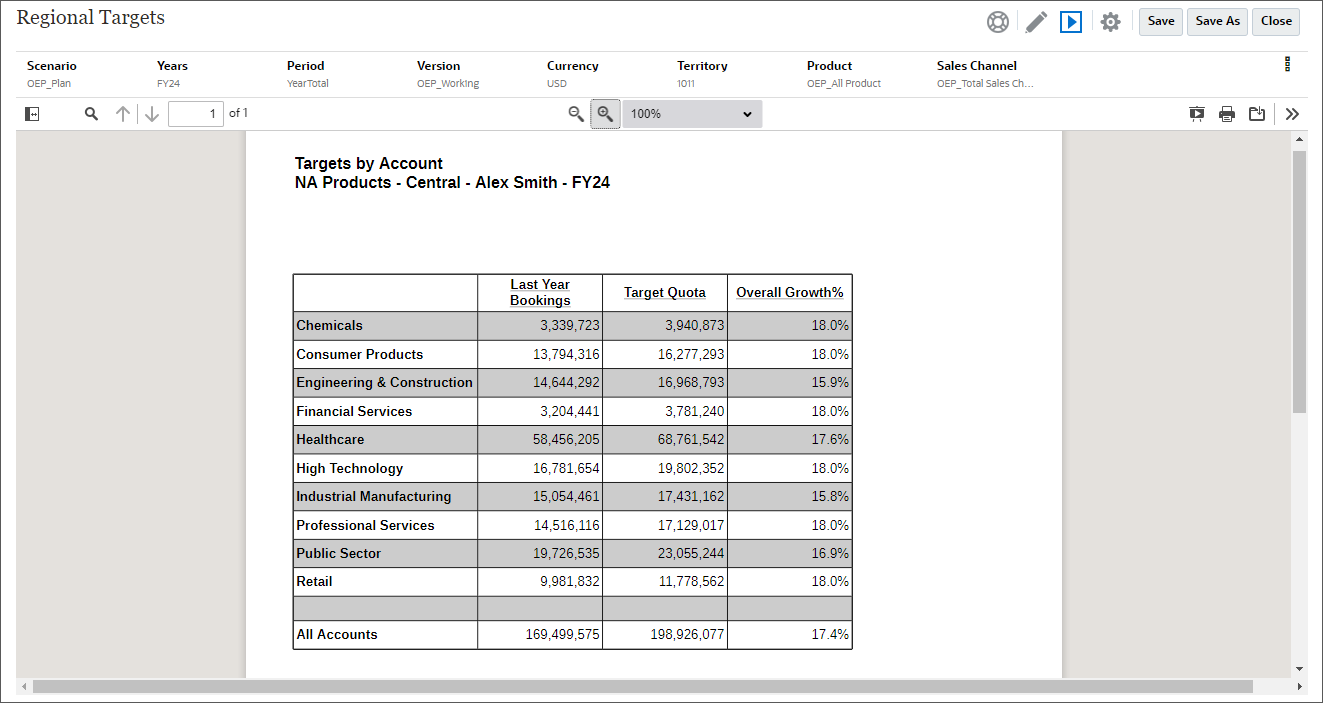
The report is displayed in the PDF format.
The report downloads in the Excel.
