Introduction
This hands-on tutorial shows you how to set and analyze data-driven, intelligent sales quotas in Oracle Sales Planning. You set target quotas and specify targets by running predictions. You also evaluate different scenarios with what-if analysis. You perform top down and bottom up quota planning. The sections build on each other and should be completed sequentially.
Background
Oracle Sales Planning provides an extensible, reliable framework that enables your teams to set and analyze data-driven, intelligent quotas using best practice methodologies, such as top-down, waterfall, and bottom-up. All key participants engage in the sales planning process including sales operations, sales management, and sales reps.
With Quota Planning, you can plan reliable target quotas by engaging all of the participants in the process, for example, the VP of Sales, Sales Operations, Sales Managers, and Sales Reps. Set a target quota for the next year. Then, optimize your results by making adjustments by product, applying padding or seasonality, or performing predictive planning or what-if analysis. When the target is ready, planners perform top-down or waterfall planning to allocate the target quota throughout the hierarchy.
If needed in your organization, you can also perform bottom-up planning to get quota commitments from Sales Reps, allowing a collaborative approach. After the target quotas are pushed up to the next level of the hierarchy and aggregated, you can compare top-down and bottom-up results. With built in dashboards, you can analyze and evaluate quota plans that include quota attainments.
Quota Planning offers top-down and bottom-up target quota planning by territory, product, account, or other custom dimensions. Use Predictive Planning and what if scenario planning to explore and compare different quota scenarios for informed decision making. Quota Planning builds best practices into its content, including its forms, calculations, dashboards, infolets, drivers, and measures.
Enhance the planning process in your organization by adding additional measures, task lists, or approvals. Extend Oracle Sales Planning by adding configurations and personalization into your sales planning application with custom navigation flows, dashboards, and infolets. Use tasks and approvals to manage the quota planning process. Use Groovy rules to customize even further for enhanced calculation and business rules. Integrate Oracle Sales Planning with Oracle Engagement Cloud - Sales Cloud to push quota targets to incentive compensation or bring in actual attainment.
You can perform quota planning using best practice methodologies such as top down, waterfall and bottom up:
- Top Down allocates the target quota starting at the highest level of the hierarchy down to each level of the dimension hierarchy, throughout the entire hierarchy. Use this method when target setting is centralized.
- Waterfall allocates the target quota starting at the highest level of the hierarchy step by step down to each level of the dimension hierarchy. Each level in the hierarchy reviews and makes adjustments before pushing the target quota down to the next level. Use this method when target setting is more decentralized with input from regional or business line sales leaders. One of the benefits of waterfall planning is that the adjustments made by sales managers are not visible to subordinates, who see only the adjusted target quota.
- Bottom Up is a collaborative approach performed in addition to top-down planning. After top-down allocation is complete, each level in the hierarchy, starting with the lowest level, reviews their target quota, enters their quota commitments, and pushes them up to the next level in the hierarchy.
Depending on how your administrator configured the application, you can:
- Perform bottom-up planning in addition to top-down or waterfall planning, and then compare the results.
- Plan by territory or resource.
- Plan overlay target quotas in addition to your primary target quotas.
You can base your target quota on prior year's sales, and consider last year's bookings to specify year over year growth for all territories. You can also specify targets by running a prediction and using the statistics based results to plan quota by territory, product, account, or any category that you use.
You can perform what-if analysis to evaluate different scenarios and then compare those scenarios to the base plan.
Prerequisites
Cloud EPM Hands-on Tutorials may require you to import a snapshot into your Cloud EPM Enterprise Service instance. Before you can import a tutorial snapshot, you must request another Cloud EPM Enterprise Service instance or remove your current application and business process. The tutorial snapshot will not import over your existing application or business process, nor will it automatically replace or restore the application or business process you are currently working with.
Before starting this tutorial, you must:
- Have Service Administrator access to a Cloud EPM Enterprise Service instance. The instance should not have a business process created.
- If you haven't already, register for a free Oracle Cloud Customer Connect account so you can
access the required files.
- Download the latest Sales Planning Sample Application snapshot from this idea page.
- Upload and import the latest Sales Planning Demo Application snapshot into your Planning instance.
Note:
If you run into migration errors importing the snapshot, re-run the migration excluding the HSS-Shared Services component, as well as the Security and User Preferences artifacts in the Core component. For more information on uploading and importing snapshots, refer to the Administering Migration for Oracle Enterprise Performance Management Cloud documentation.
Reviewing Quota Planning Configuration and Enabled Features
- On the home page, click Application, then Configure.

The configuration tasks are displayed.

- Click Enable Features.
- Review the enabled features.
-
You can plan by territory. The lowest level in each hierarchy represents a sales rep. With Territory, you can integrate with Oracle Engagement Cloud's Territory Management. The commonly-used Accounts (customers), Product (high-level product families), and Geography (a reporting dimension, configured as an attribute of Territory) dimensions can be optionally enabled. These core custom dimensions have predefined functionality and artifacts associated with them.

-
You plan quota by dollars not units.

-
With Overlay Targets, you can plan for the additional sales from a support sales force whose assistance increases revenue. With seasonality selected, you can adjust quota to better reflect the seasonal impact. With padding, management can make top side adjustments of target quotas before the final quotas are rolled out. With What-if analysis, you can compare different business outcomes with the base plan.

-
With the waterfall method, you can plan target quota at the top of the organization and then allocate it one step below in the hierarchy. With bottom up, sales reps can propose quotas for each account that they collaboratively review and adjust with their managers.

-
With Predictive Planning enabled, you can perform time series statistical analyses on historical data to predict future results. You can copy these predictions into forecast and what-if scenarios.

- You can plan with a product and accounts dimension, and the additional dimension
named Sales Channel.

-
- Click Close.
Setting Variables and User Preferences
In this section, you review the substitution variables that are set up. You also set user preferences so that you can work with forms and dashboards.
Setting Values for Substitution Variables
- Click
 (Navigator), and
under Tools, click Variables.
(Navigator), and
under Tools, click Variables.

In Variables, you can administer user variables and substitution variables.

- Click the Substitution Variables tab.
- Review the values for substitution variables.
For all cubes, OEP_CurYr is FY24.

- Scroll down and notice the values for OEP_QTP. The current year is FY24, the
prior year is FY23, and the version is the Working version.

Setting User Preferences
- Click (Navigator), and
under Tools, click User Preferences.

- In General, under Approvals, select Display Aliases.

- On the left, under Preferences, click Display.

- Under Number Formatting, for Thousands Separator, ensure Comma is selected, and
for Decimal Separator, ensure Dot is selected.

- On the left, under Preferences, click Ad Hoc Options.

- Ensure the precision is set to:
Minimum Maximum Currency Values 0 0 Non-Currency Values 0 0 Percentage Values 0 1 Note:
Precision settings affect the value display only, not their stored values.
Setting Values for User Variables
- On the left, under Preferences, click User Variables.

- For each variable, click its
 (Select Member) to select a member as the variable's value:
Dimension User Variable Member Accounts Accounts Segments All Accounts Currency Currency USD Period Period Granularity YearTotal Product Product Family All Product Currency Reporting Currency USD Scenario Scenario Plan Territory Territory NA Key Accounts - Anthony Furini Years Years FY24 Accounts Account Segments All Accounts Scenario Forecasting Scenario Forecast Version Forecasting Version Working Bottom Up Measures Drivers Product Measures Product Product Family All Product Territory Territory NA Products - West - Mateo Lopez Currency Currency USD BaselinePromotions Current Promotion Base Scenario Key Account Scenario Plan Version Key Account Version Working Bottom Up Territory Overlay Territory All Overlay Territory Territory Sales Rep Territory Central - Products - Div I -Peter Branch Territory Territory NA Products - Central - Alex Smith Accounts Accounts All Accounts Product Product All Product Tip:
If you selected to show aliases in Member Selector, the value listed in the Member column may vary. For example, for some dimensions, the prefix (OEP_ and OGS_) are not shown. For some territory members, instead of the numeric member name, the full alias name is displayed. - Verify your selections, and click Save.

- In the Information message, click OK.

Setting Quota Targets as the Sales Ops
You set quota targets by basing them on the prior year's sales, and you consider last year's bookings to specify year over year growth for all territories.
Activating Navigation Flows
In this section, you activate navigation flows to help you move through the steps for setting sales quotas.
- Return to the home page. Click
 (Home).
 - In the upper right, to the left of your user name, click
 (Select Navigation Flow) and select
Quota Sales Ops.
(Select Navigation Flow) and select
Quota Sales Ops.

- In the upper right, click
 (Administrator), and select Reload Navigation Flow.

Running Predictions with Predictive Planning
Since you have historical revenue data by territory, you can perform a statistical analysis on the
data to predict future revenue results.
Running Predictive Planning predicts
future revenue by territory or prediction, historical data for each member on the form is retrieved
and then analyzed using time series forecasting techniques to predict the future performance for
these members. The more years of historical data you have, the more accurate the prediction will be.
- On the home page, click Quota.

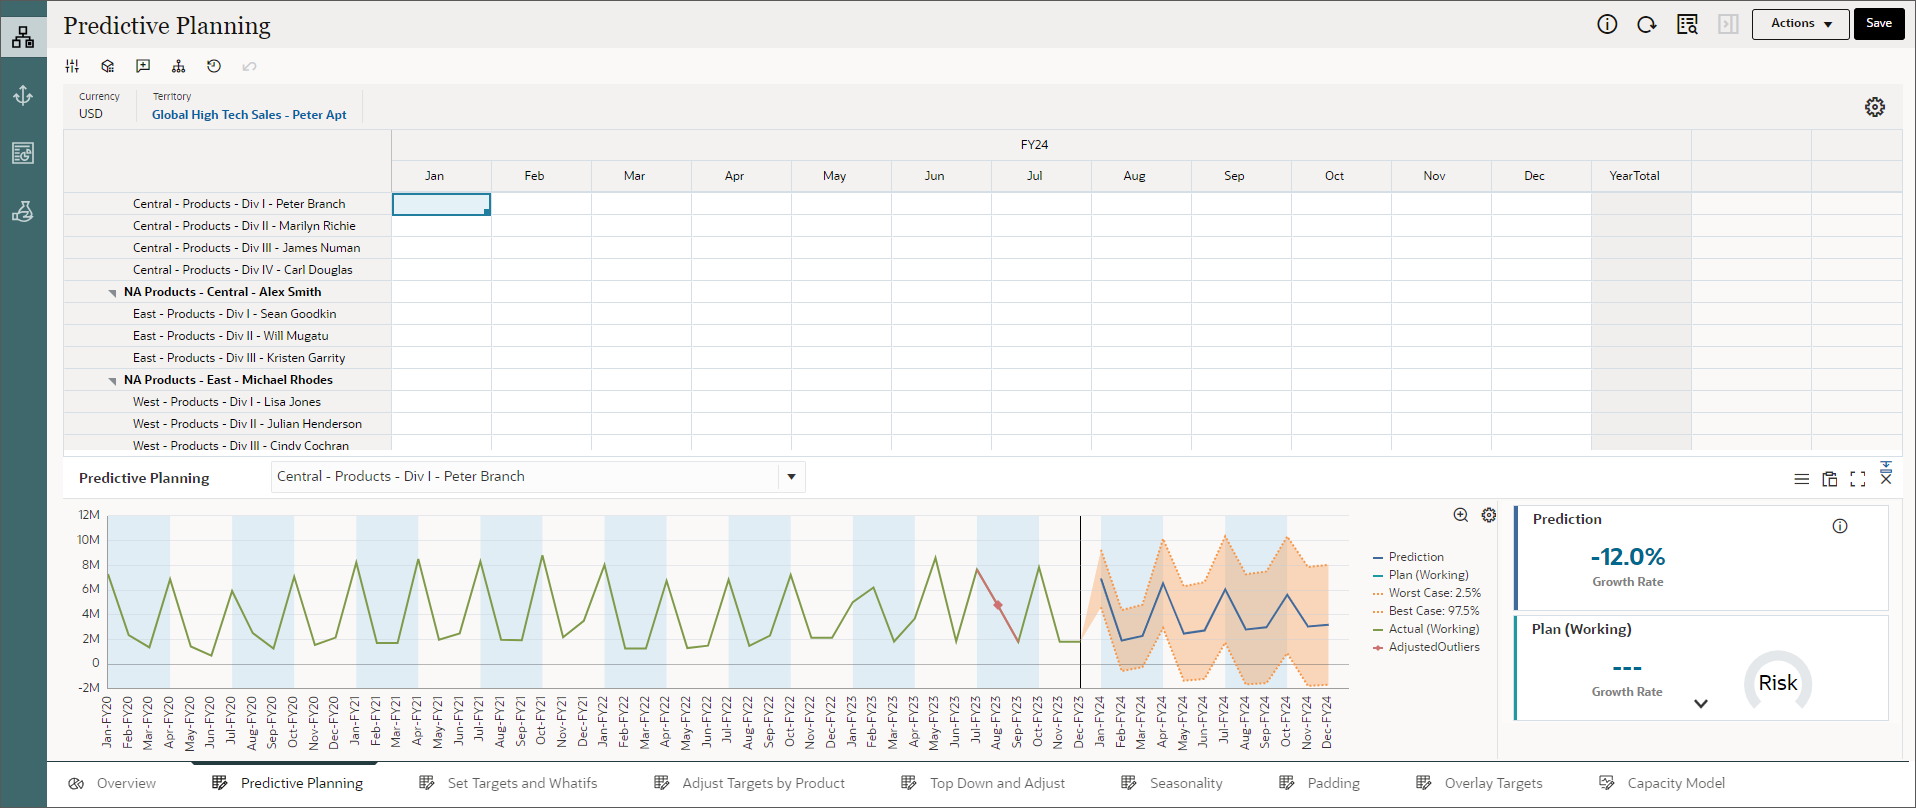
- Click the Predictive Planning horizontal tab.

- In the Member Selector, expand Territory > Total Territory,
select Global High Tech Sales - Peter Apt, and click OK.

- Click Actions, and select Predictive Planning

- The prediction runs, and a results area opens below the form with a chart and detailed
information about the prediction.
Review the results which provide detailed information about the prediction.
- In the Marilyn Richie row, select the Jan cell.
The results for Marilyn Richie's division are displayed.

- In the Prediction area, click
 (Details).
Depending on the data, the system predicts using the method with the greatest accuracy. To determine the prediction method, many factors are evaluated such as what historical data is available, and whether or not the data follows a trend or includes seasonality. Methods are described in the following table:
Method Seasonal Best Use Simple Moving Average No Volatile data with no trend or seasonality Double Moving Average No Data with trend but no seasonality Single Exponential Smoothing No Volatile data with no trend or seasonality Double Exponential Smoothing No Data with a trend but no seasonality Damped Trend Smoothing non-seasonal method No Data with a trend but no seasonality Seasonal Additive Yes Data without trend but with seasonality that does not increase over time Seasonal Multiplicative Yes Data without trend but with seasonality that increases or decreases over time Holt-Winters' Additive Yes Data with trend and seasonality that does not increase over time Holt-Winters' Multiplicative Yes Data with trend and with seasonality that increase over time Damped Trend Additive Seasonal Method Yes Data with a trend and with seasonality Damped Trend Multiplicative Seasonal Method Yes Data with a trend and with seasonality ARIMA No Data with minimum of 40 historical data points, limited number of outliers and no seasonality SARIMA Yes Data with minimum of 40 historical data points, limited number of outliers and seasonality - Review the prediction details including the prediction method. The best prediction method is
SARIMA.

- Click outside Prediction Details to close it.
- In the lower right corner of the screen, click
 (Paste) to copy the predicted data to the Plan scenario.
 - In Paste Prediction, select All Members on Form, and click
Apply.

- To copy the predicted data to the Plan scenario, for all time periods and all territories, click
Save.

- You can review the data and make changes. For Sean Goodkin, click the February cell and enter 6m.
- Click Save.

Note:
Predictions are shown for the selected member.Tip:
If your prediction results are not displayed, close the form and then open the form and try again.Set Targets
- You can compare the predicted values to your planned targets. Click the Set Targets and
Whatifs horizontal tab.

- Review last years bookings with the predicted revenue.

- Set the predicted values as the target. Right-click on the Set YoY Growth form
and select Set Predictive as Target.

- In the Information message, click OK.

- You can also specify an overall target by entering a specific amount. In the upper grid, for
Plan Target Quota, enter 1160m, and in the upper grid, click
 (Save).

- In the Information message, click OK.

- Set quota based on year over year growth from last year's bookings. In the upper grid, for Plan
YOY Growth %, enter 18.5%, and in the upper grid, click (Save).

- In the Information message, click OK.
Performing What-if Analysis
After you set initial target quota, you can perform what-if analysis to evaluate different scenarios.
You can then compare those scenarios to the base plan and choose to use them in your plan.
You set percentage values for the listed scenarios to calculate quota for each scenario. The
values are calculated on the Plan Target Quota, so if Best Case is set to 5% then it is 5% more than
the Plan Target Quota value.
- Right-click on the Set YoY Growth form and select Seed What If Scenarios.

- Accept -5 for Worst Case, 5 for Best Case, and
3 for Conservative, and click Launch.

- In the Information message, click OK.

- Review the results for Conservative, Best Case, and Worst Case.

- You can accept the results from one of your what-if scenarios as you Plan Target Quota.
Right-click and notice the Copy Data What If option, but don't select it.

- Click somewhere on the main screen to close the menu.
Adjusting Quota by Product
You can make quota adjustments by territory or product. Often the growth rate across product lines is different.
- Select the Adjust Targets by Product horizontal tab.

- For NA Business Sales - Products - Martin Conway, in YOY Growth%, enter the
following, and in
Adjust YoY Growth
by Product, click (Save):
- Servers: 15%
- Laptops: 18%
- Software & Services: 20%

- In the Information message, click OK.
- Click the Overview tab.

After finalizing target quota, you can discuss the plan with the Chief Revenue Officer. Review the predefined dashboard to provide insight into overall quota planning. And review revenue information and target quota - the high-level quota plan for all territories - along with other important measures. You can review information by industry, territory, product or other categorizations.
Next, you can handoff this plan to the Sales VPs so they can review the plan further before allocating the target quota throughout the organization.

Performing Top-down Planning as the Sales VP
Activating Sales VP's Navigation Flow
You activate the navigation flow for the Sales VP so that Martin Conway, the North American Business Sales Vice President can review quotas and make changes.
- Return to the home page. Click
(Home).
- In the upper right, to the left of your user name, click (Select Navigation Flow) and select
Quota Sales VP.

- In the upper right, click
(Administrator), and select Reload Navigation Flow.
Allocating Quota
In this section, you review the sales quota for the VP, and allocate to the next level in the hierarchy.
- On the home page, click Quota.

- Click the Top Down and Adjust horizontal tab.

- In the Member Selector, expand Territory > Total Territory,
select NA Business Sales - Products - Martin Conway, and
click OK.

- For the Sales VP, Martin Conway, review the target quota and other key measures such as last
year's bookings, predicted revenue, the assigned overall growth, average quota per rep and
account, and number of accounts.

- In the My Target form, right-click and select Waterfall Allocation.
To plan for the VPs team quota, you allocate target quotas to the Regional Sales Managers. Allocate quota using the waterfall method to plan sales quota one step below in the hierarchy to the regions.

- In the Information message, click OK.

Quota is allocated to sales managers. Key measures are calculated including the overall growth percentage, the average quota per sales rep, and per account, and the number of accounts.

Adjusting Allocated Quota by Region
In this section, you adjust the regional sales quota.
- In My Team Target, in Adjustment Value for YearTotal, enter the following, and click (Save):
- For the Central region for Alex Smith: 1.5m
- For the East region for Michael Rhodes: -1.2m
- For the West region for Mateo Lopez: -300k

- In the Information message, click OK.
Applying Seasonality Adjustments
By default, quota targets are spread based on historical data, however if needed you can adjust the spreading by season. In this section, you make adjustments for each month for the upcoming planning year, for example to reflect consumer and sales trends or holiday periods. This option overwrites the original spreading with the seasonally adjusted spreading.
- Click the Seasonality horizontal tab.

- For the NA Products - West - Mateo Lopez row, in Jan enter
5% and in Mar, enter 16%, and in upper
right-hand part of the top form,
click (Save):

- In the Information message, click OK.
Note:
Seasonality must always total 100%.
- To update target quota based on the updated seasonality percentages, click in the
Jan cell for NA Products - West - Mateo Lopez, right-click and
select Apply Seasonality.

- In the Information message, click OK.

Seasonality is applied to the selected row for NA Products - West - Mateo Lopez.

Adding Overlay Targets
You can include overlay targets to plan for those not directly responsible for the quota but who do support meeting quota targets. Overlay growth percentage is based on a percentage over last year's impacted bookings.
- Click the Overlay Targets horizontal tab.

- In My Overlay Target, in Overlay Growth%, enter 5%, and in the
upper right-hand part of the top form, click (Save).

- In the Information message, click OK.
Overlay quota is included.

- To review the predefined dashboard to gain insight into the overall quota planning, click the
Overview horizontal tab.

On the Overview dashboard, you can review information by industry, territory, product or other categorizations.

- Click the Top Down and Adjust tab.
- Review the allocated target quota for the regions. Alex Smith's allocated target quota is almost
185 million.

Performing Top-down Planning as the Sales Manager
Activating Manager's Navigation Flow
- Return to the home page. Click
(Home).
- In the upper right, to the left of your user name, click (Select Navigation Flow) and select
Quota Sales Mgr.

- In the upper right, click
(Administrator), and select Reload Navigation Flow.
Allocating Regional Targets to Sales Reps
- On the home page, click Quota.

- In the Member Selector, expand Territory > Total Territory,
select NA Products - Central - Alex Smith, and click OK.

- Click the Top Down and Adjust tab.

- Review the quota for Alex Smith's region.
Data for the Central region is displayed on the top of the page including the allocated quota for the Central region.

- In the My Target form, right-click and select Waterfall Allocation.

- In the Information message, click OK.
Quota is allocated to the sales reps.

Adjusting Allocated Quota by Account
- Click the Adjust by Accounts horizontal tab.

- In My Team's Target by Account, select Ixys Corp in Div I Peter Branch,
right-click and select Move Account.

- For Select territory to transfer account to, click (Select
Member).

- In Member Selector, select Central Products - Div II - Marilyn Richie, and click OK.
- Click Launch

- In the Information message, click OK.

The account is reassigned to a different territory. Also the LY Bookings and Allocated Target Quota with other measures have been moved to the new territory.


Adding a New Territory
You plan for a new sales rep for the Central region by adding a new territory and assigning quota to it.
- Click the Top Down and Adjust horizontal tab.

- In My Team Target form, right-click and select Add New Territory.

- For each member, click (Select Member), to set the value as specified below, and then
click Launch.
- Scenario: "OEP_Plan"
- Territory: "1015" (Central-Products-Div IV - Carl Douglas)
- Version: "OEP_Working"
- Year: FY24

- In the Information message, click OK.

- In My Team Target, expand Adjustment Value YearTotal, and make the following adjustments, and
click (Save):
- For the Div III - James Neuman row, in Q2, and Q3 enter -3M, in Q4, enter -1.5M.
- For the Div IV - Carl Douglas row, in Q2, and Q3, enter 3M, in Q4, enter 1.5M.

- In the Information message, click OK.
Adjusting Ramp Up and Sales Rep Profile
- Click the Ramp Up and Profile horizontal tab.

- Review the attributes of sales reps' profiles to gain insights into the sales rep productivity.
Based on these attributes, a Sales Rep Adjustment % can be calculated to determine the FTE Capacity and Threshold.
- In Sales Rep Profile Assumptions, make the following adjustments, and
click (Save):
- For Div I - Peter Branch row, in Ramp Profile, select Fast.
- For Div II - Marylin Richie row, in Comp Grade, select High.
- For Div III - James Neuman row, in Seniority, select Senior and in Comp Grade, select High.
- For Div IV - Carl Douglas row, in Tenure, select Range 12 Months, in Seniority, select Mid Level and in Comp Grade, select Average.

- In the Information message, click OK.

- After setting or adjusting the ramp up profile, you can review the FTE Capacity of the
sales reps.
Note:
A Negative Threshold indicates that a Sales Rep has a high quota that they may not be able to achieve.
A Positive Threshold indicates that they are not challenged with the right quota for their ability and their compensation grade / experience.
Performing Bottom-up Planning as the Sales Representative
Bottom-up quota planning complements your top-down planning strategy. After top down targets are set, you can have the lowest level in the hierarchy review their target quota, make any required adjustments, and then submit their expected account plans and quota commitments to the next higher level in the hierarchy for approval.
Note:
To perform bottom up planning, each user would log on to review quotas and make adjustments. In this tutorial, to simulate the steps, you switch between navigation flows.Activating Quota Sales Rep's Navigation Flow
- Return to the home page. Click
(Home).
- In the upper right, to the left of your user name, click (Select Navigation Flow) and select
Quota Sales Rep.

- In the upper right, click
(Administrator), and select Reload Navigation Flow.
Reviewing Top-down and Bottom-up Quotas
As a sales rep in charge of Central Products in Division 1, you can plan for each of your accounts, and allocate quota based on market knowledge and can factor in future sales opportunities.
- On the home page, click Quota.

Adjusting Quotas for Accounts
- In Set Quota, change the quota values for each of the following accounts, and click (Save):
- Dixon Mfg Industries - MI Plant: 3.5m
- Jonas Green Children's Health Center: 9m
- Freeman Manufacturing: 15.5m
- Tony Tone Talent Agency: 7.5m
- Burgess Robert K: 8.5m

- In the Information message, click OK.
- Review the top down quota allocated by your manager, along with the overall growth percentage.
You can compare the top-down quota with the bottom-up quota, as well as the percent of the
target.
The top down quota is displayed in the Final Target Quota column and the bottom up quota is displayed in the Quota column.

Adding Accounts and Assigning Quotas
In this section, you add a new account to help you reach your quota.
- In Set Quota form, right-click and select Add Account.

- For Enter Account, click
(Select Member), to set the account value to: Wells Fargo Bank, National
Association, and click OK.

- In Enter Quota Amount, enter 1500000, and click Launch.

- In the Information message, click OK.
With the added account quota, Peter Branch is closer to achieving his overall target quota.

Managers can also assign accounts to Sales Reps.
Reviewing Quota by Product
You can review and adjust quota allocated per product.
- Click the Adjust by Product horizontal tab.

- Review quota assigned to each account for servers and laptops.

Submitting Account and Quota Plans for Approval
Sales Reps Finalize Quota
In this example, quota information for Peter Branch, a Sales Rep, is displayed.
Note:
You are not expected to perform the approval steps. These are included for illustration purposes only.- The first column references last year's bookings.
- Top-down quota allocated to the Sales Rep by the Sales Manager is in the second column.
- The Sales rep's proposed quota is in the Quota column.
- The overall growth percentage of quota compared to last year's bookings is in Overall Growth%.
- In Quota % of Target, the percentage that the proposed quota is of the allocated quota is
displayed.

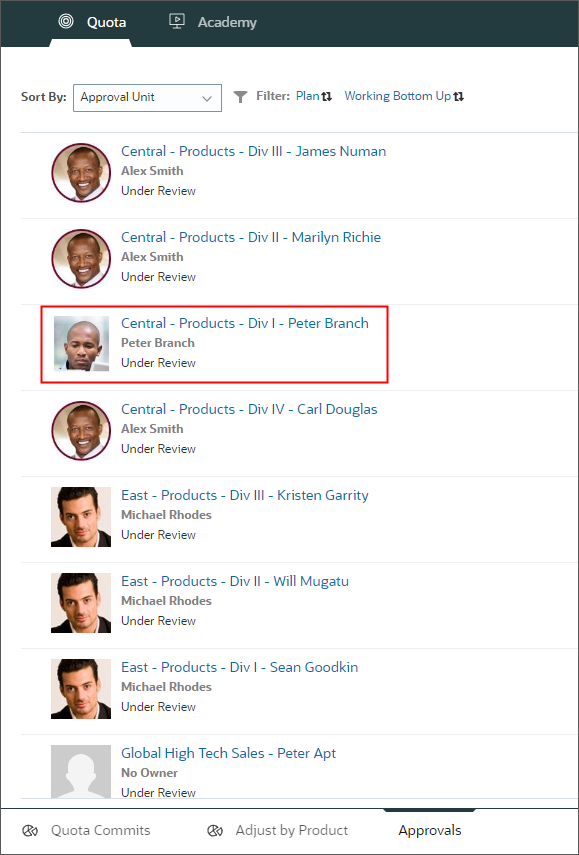
Sales Reps Submit Quota for Approval
The Sales Rep, Peter Branch, submits the quota for approval. Sales Reps can submit quotas for approval on the Approvals tab.
Note:
You are not expected to perform the approval steps. These are included for illustration purposes only.- The Sales Rep can select the territory for which they want to submit quota.
- They can add comments such as "Quota committed" before promoting quota to the next level in the
hierarchy for review.

- They can review the promotion hierarchy on the second vertical tab. The promotional path
includes Alex Smith the North American Sales Manager for the Central region, Martin Conway the
North American Sales VP, and Amy Feng the Sales Ops Director.

Sales Managers Review Sales Reps Proposed Quota
Note:
You are not expected to perform the approval steps. These are included for illustration purposes only.- The Sales Manager makes quota adjustments. For example, they can adjust quota by account for
each of the Sales Reps.

- After making adjustments, to update the quota totals, the Sales Manager aggregates the data.
- The quota is closer to achieving the target.


Sales Managers Submit Quota for Approval
The Sales Manager, Alex Smith, submits the quota for approval.
Note:
You are not expected to perform the approval steps. These are included for illustration purposes only.- Sales Managers can submit quotas for approval by selecting the Approvals tab.

- The Sales Manager can select the territory for which they want to submit quota.

- They can add comments such as "Quota are set for my team's territories." before promoting quota
to the next level in the hierarchy for review.

Here, Quotas are promoted by Alex Smith.

The review process continues until the last person in the review process approves the quota plan.

Sales Ops Perform High Level Commission Modeling
Oracle Sales Planning can further be extended to perform high-level commission modeling to simulate the compensation scenarios for the targeted quota.
Note:
You are not expected to perform the approval steps. These are included for illustration purposes only.- Here you can see the different views that a Sales Ops can model. Multiple versions can be
planned;
in this case Version A is selected.
- Headcount displays the current headcount and a conservative quota (based on last year's quota)
- Target Commission provides guidance for the upcoming year
- Commission Structure displays the commission rates for different Tiers and Bands
- Attainment Bands helps in running what ifs for different headcounts with different bands of attainment and their impact on the overall commission
- Charts are used to show the % of Revenue and the Commission Target vs Planned Commission based on the attainment
 This gives the Sales Ops an opportunity to try out several scenarios by changing target quota,
attainment bands, headcount, and commission structure to get close to the overall commission target.
This gives the Sales Ops an opportunity to try out several scenarios by changing target quota,
attainment bands, headcount, and commission structure to get close to the overall commission target.
- Sales Ops can also review all the different version assumptions and the commission costs in a
comparison view under the Commission Plan by Version tab.

Related Links
Setting and Analyzing Data-Driven Quotas in Sales Planning
G12063-01
August 2024