Introduction
This 60-minute hands-on tutorial shows you how to forecast and analyze sales quotas in Oracle Sales Planning with Smart View. The sections build on each other and should be completed sequentially.
Background
Oracle Sales Planning provides an extensible, reliable framework that enables your teams to set and analyze data-driven, intelligent quotas using best practice methodologies. All key participants engage in the sales planning process including sales operations, sales management, and sales reps.
You can enable the following business processes in Sales Planning:
- Quota Planning offers top-down and bottom-up target quota planning by territory, product, account, or other custom dimensions. Use Predictive Planning and what if scenario planning to explore and compare different quota scenarios for informed decision making. Quota Planning builds best practices into its content, including its forms, calculations, dashboards, infolets, drivers, and measures.
- Advanced Sales Forecasting provides a robust platform for the sales forecasting process, allowing multidimensional sales forecasting across territories, products, accounts, channels, or other custom dimensions. It offers sales teams connected sales planning with integration between Quota Planning, compensation planning, and sales forecasts. With Advanced Sales Forecasting, you can plan at the weekly or monthly level, and use a rolling forecast if your business requires it.
- Key Account Planning expands Sales Planning to cover a data driven approach to sales baseline planning, resulting in an overall view of the customer's profit and loss. Key Account Planning helps key account managers plan trade promotion strategies in order to optimize their trade spends and offers collaborative sales planning. By using baseline planning and promotion planning, key account managers or sales managers can perform gap analysis and see the uplifts - the impact on sales volume or revenue - from running trade promotions.
Extend Oracle Sales Planning by adding configurations and personalization into your sales planning application with custom navigation flows, dashboards, and infolets. Use tasks and approvals to manage the quota planning process. Use Groovy rules to customize even further for enhanced calculation and business rules. Integrate Oracle Sales Planning with Oracle Engagement Cloud - Sales Cloud to push quota targets to incentive compensation or bring in actual attainment.
You can review and adjust quota on the web or in Oracle Smart View for Office. This tutorial shows you how to review and adjust quota in Smart View.
Note:
Watch the Overview: Smart View and Sales Planning Cloud video to learn more about Smart View in Oracle Sales Planning Cloud.Prerequisites
Cloud EPM Hands-on Tutorials may require you to import a snapshot into your Cloud EPM Enterprise Service instance. Before you can import a tutorial snapshot, you must request another Cloud EPM Enterprise Service instance or remove your current application and business process. The tutorial snapshot will not import over your existing application or business process, nor will it automatically replace or restore the application or business process you are currently working with.
Before starting this tutorial, you must:
- Have Service Administrator access to a Cloud EPM Enterprise Service instance. The instance should not have a business process created.
- If you haven't already, register for a free Oracle Cloud Customer Connect account so you can
access the required files.
- Download the latest Sales Planning Application snapshot from this idea page.
- Upload and import the latest Sales Planning Demo Application snapshot into your Planning instance.
Note:
If you run into migration errors importing the snapshot, re-run the migration excluding the HSS-Shared Services component, as well as the Security and User Preferences artifacts in the Core component. For more information on uploading and importing snapshots, refer to the Administering Migration for Oracle Enterprise Performance Management Cloud documentation. - Download this file and extract the contents to a local folder.
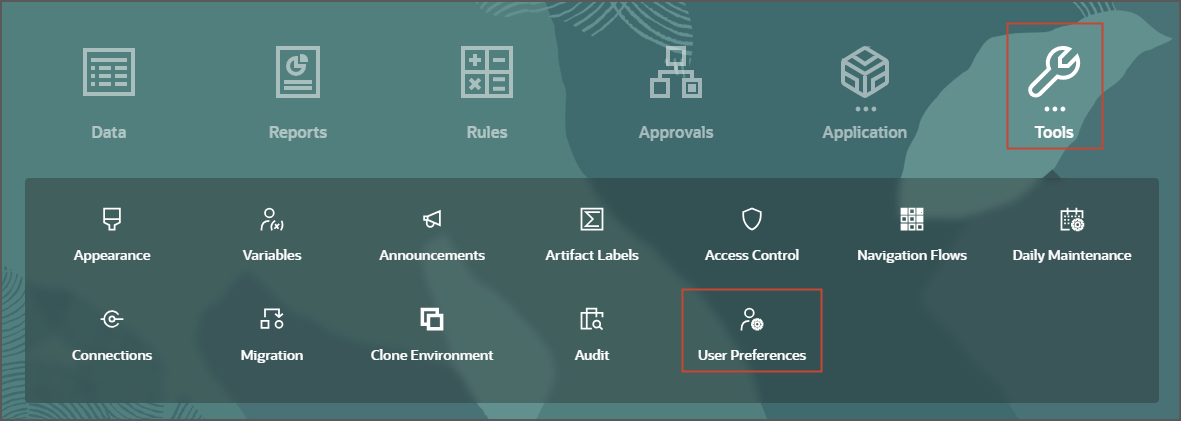
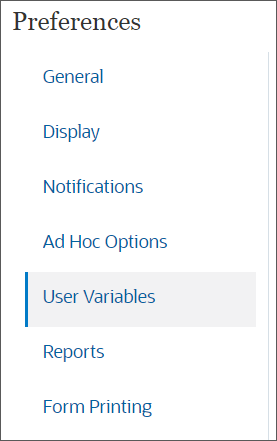
Setting User Preferences
- Log on to Oracle Sales Planning with the URL provided by your administrator.
- From the home page, click Tools, then User Preferences.
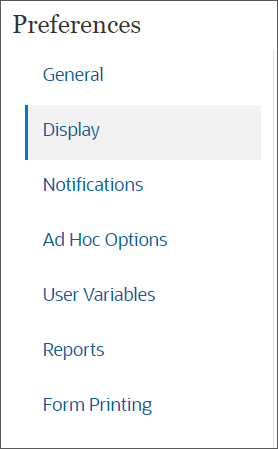
- On the left, under Preferences, click Display.
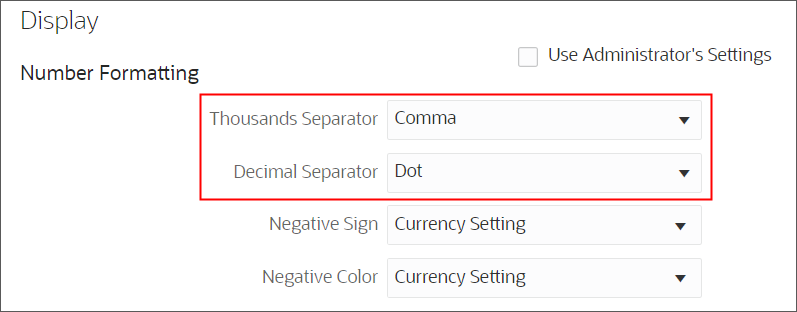
- Under Number Formatting, for Thousands Separator, ensure Comma is selected, and
for Decimal Separator, ensure Dot is selected.
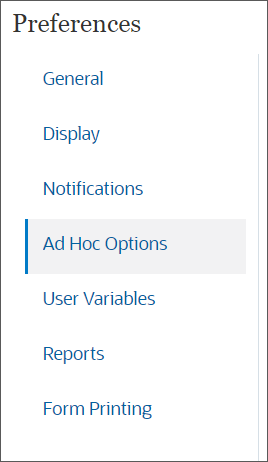
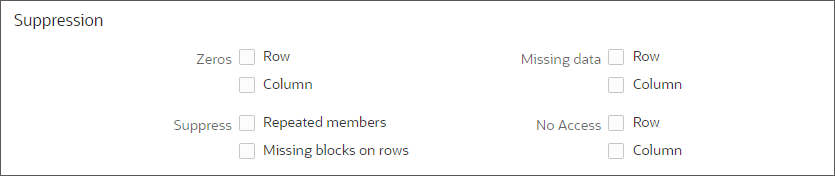
- On the left, under Preferences, click Ad Hoc Options.
- Ensure your Ad Hoc Options, Suppression and
Precision matches the following:
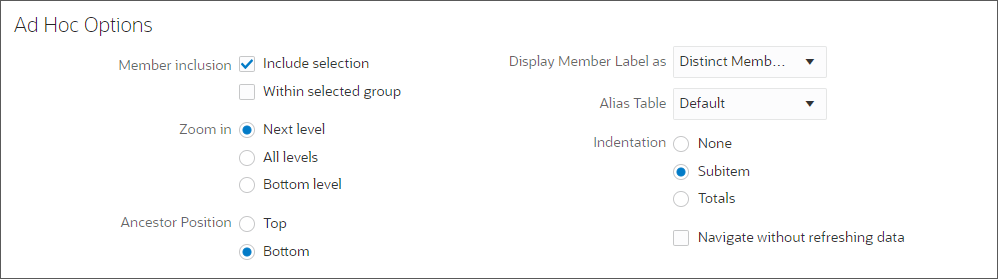
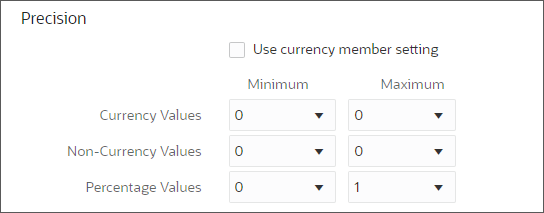
Note:
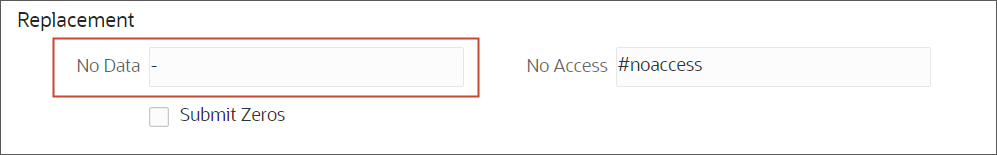
Precision settings affect the value display only, not their stored values. - Under Replacement, for No Data, change #missing to - (dash).
- On the left, under Preferences, click User Variables.
- For each variable, click its
 (Select Member) to select a member as the variable's value:
Dimension User Variable Member Accounts Accounts Segments All Accounts Currency Currency USD Period Period Granularity YearTotal Product Product Family All Product Currency Reporting Currency USD Scenario Scenario Plan Territory Territory NA Key Accounts - Anthony Furini Years Years FY24 Accounts Account Segments All Accounts Scenario Forecasting Scenario Forecast Version Forecasting Version Working Bottom Up Measures Drivers Product Measures Product Product Family All Product Territory Territory NA Products - West - Mateo Lopez Currency Currency USD BaselinePromotions Current Promotion Base Scenario Key Account Scenario Plan Version Key Account Version Working Bottom Up Territory Overlay Territory All Overlay Territory Territory Sales Rep Territory Central - Products - Div I -Peter Branch Territory Territory NA Products - Central - Alex Smith Accounts Accounts All Accounts Product Product All Product Tip:
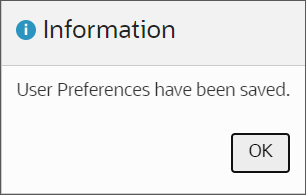
If you selected to show aliases in Member Selector, the value listed in the Member column may vary. For example, for some dimensions, the prefix (OEP_ and OGS_) are not shown. For some territory members, instead of the numeric member name, the full alias name is displayed. - Verify your selections, and click Save.

- In the Information message, click OK.
- Return to the home page. Click
 (Home).
Preparing the Smart View Environment
Smart View Overview
Smart View provides a common Microsoft Office interface for Planning. With Oracle Smart View for Office, you can view, import, manipulate, distribute, and share data from various data sources using Microsoft Excel, Word, Outlook, and PowerPoint.
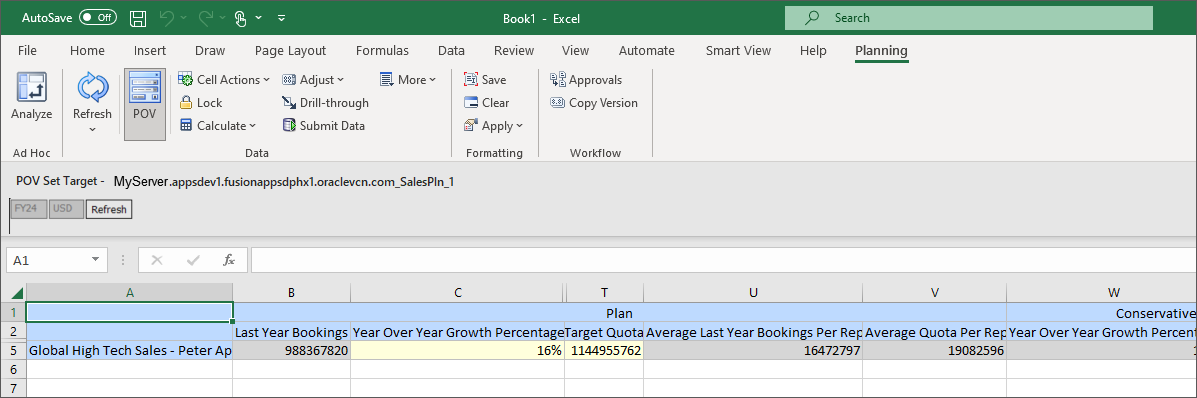
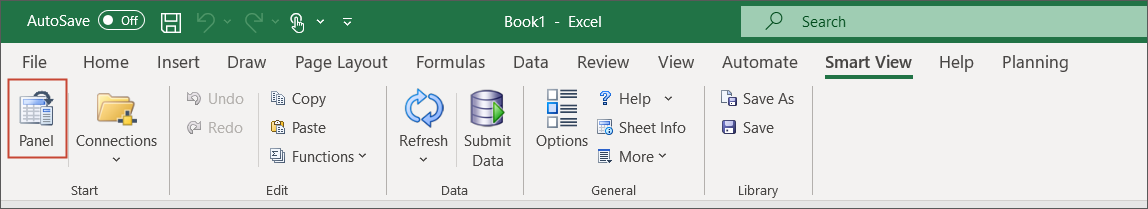
From Office applications, you access Smart View functionality through ribbon commands. The Smart View ribbon, which contains commands for common Smart View operations is always present. When you connect to a data source, the corresponding ribbon is also displayed. Each ribbon displays only the commands supported for that data source and mode. For example, in the following illustration for Planning, when you access a Planning form, the Planning ribbon is displayed.
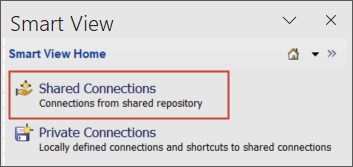
You can manage data source connections, access data, and open forms from the Smart View Panel. The Smart View Panel opened from the Smart View ribbon, is displayed by default on the right side of the Microsoft Office application. You can move, resize, or close the Smart View Panel. The Smart View Panel contains the following panes:
- Home — A panel that displays links to Shared Connections and Private
Connections as well as a
list of recently
used items such as ad hoc grids, forms, and tasks, that you can click to establish a connection.
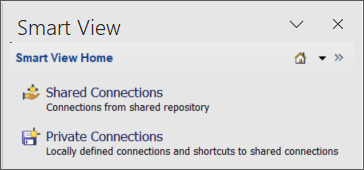
- Shared Connections — A drop-down menu of available connections from Application
Management and a
tree view of the contents of the currently selected connection.
- Private Connections — A drop-down menu of available connections saved on the local computer and a tree view of the contents of the currently selected connection. You can also enter a URL to connect directly to a data source.
- Task Lists — A tree list of tasks from which you can manage your tasks. This pane opens only when you select a task list from Shared Connections or Private Connections.
- Action Panel — A list of operations available based on the selection in the
shared connection,
private connection, or task list tree.
- Document Contents — A task pane in the Smart View Panel that provides a view of
the connections
and content existing in the current Office document.
Setting Smart View Options
- Launch Excel. Ensure that you have a blank worksheet open.
- On the Smart View ribbon, click Options.
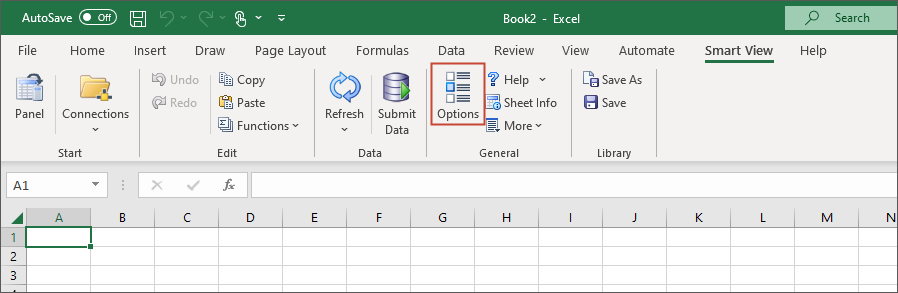
- On the left pane, ensure Member Options is selected.
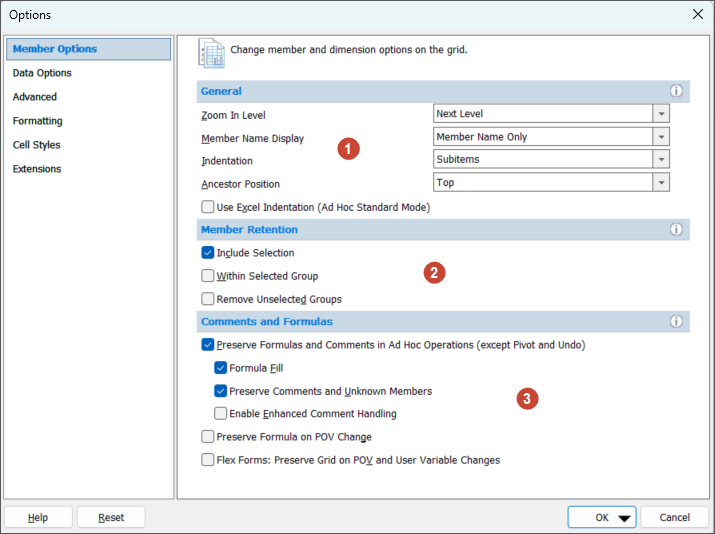
Member Options control the display of member cells, and are specific to the worksheet for which they are set. Select from the following Member Options:
- General Options:
- Zoom In Level: Select the default zoom level for ad hoc analysis.
- Member name Display: Select how to display member names in cells.
- Indentation: Specify how hierarchy levels are to be indented.
- Ancestor Position: Specify ancestor position in hierarchies.
- Member Retention:
- Select whether to include the selected member when members are retrieved as part of an operation.
- Select whether to perform ad hoc operations only within the selected group.
- Select whether for Zoom In or Zoom Out to remove all dimensions and members except the selected member and the members retrieved as a result of zooming.
- Comments and Formulas: Select options for processing comments and
formulas.
- Whether to preserve formulas and comments on the grid during queries.
- Whether to preserve formulas when you refresh or make changes to the POV. Otherwise, any formulas in the grid are lost.
- General Options:
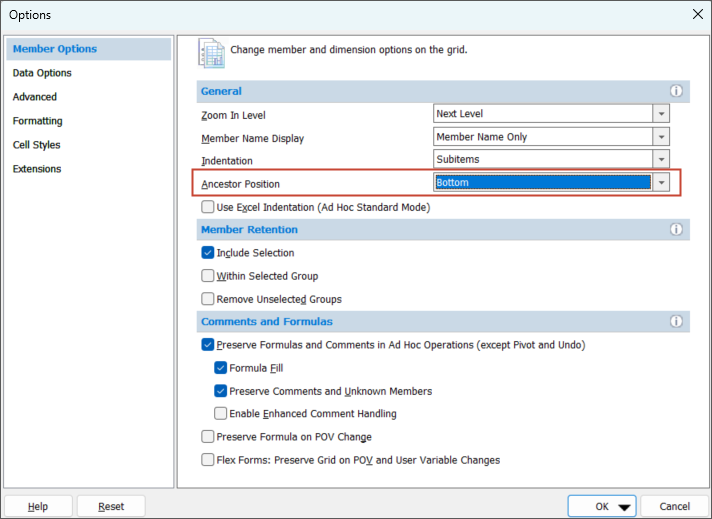
- In General, for Ancestor Position, select Bottom.
- On the left pane, click Data Options.
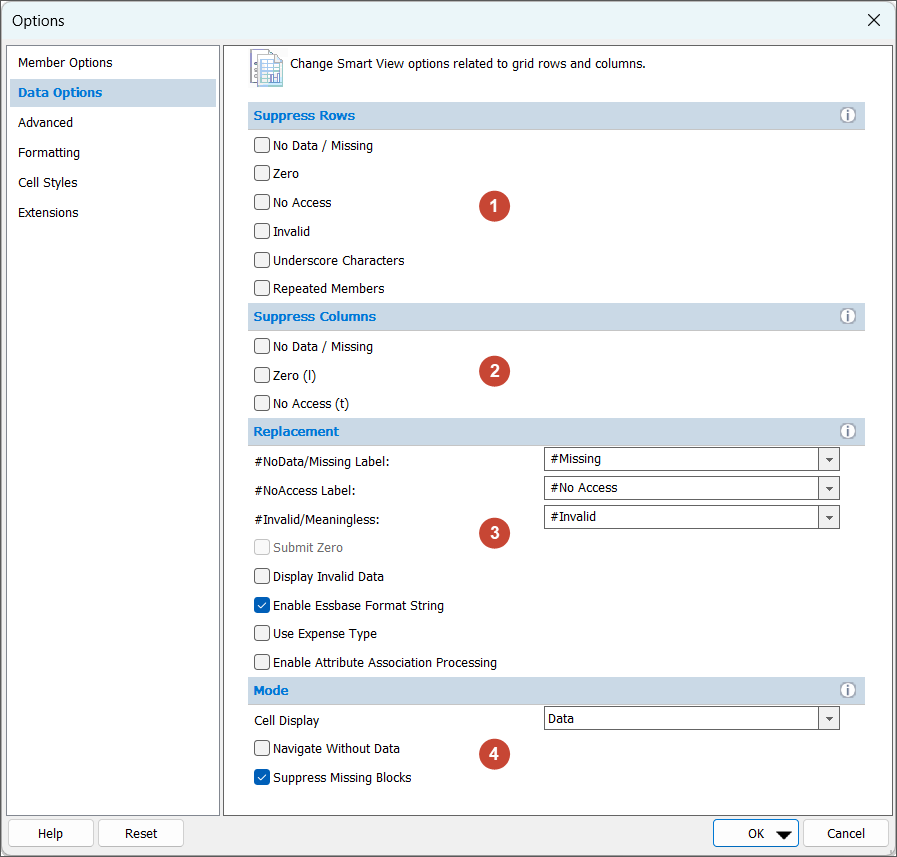
Data Options control the display of data cells. You can choose from the following data options:
- Suppress Rows to streamline the grid so that rows that contain types of data you do not need to view are suppressed.
- Suppress Columns to streamline the grid so that columns that contain types of data you do not need to view are suppressed.
- Replacement to select what to display in cells that meet specified criteria, and select how to replace values.
- Mode to speed up operations such as Pivot, Zoom, or Keep Only by navigating without data, or choose to suppress missing blocks.
- In Replacement, for #NoData/Missing Label, enter - (dash).

- On the left pane, click Advanced.
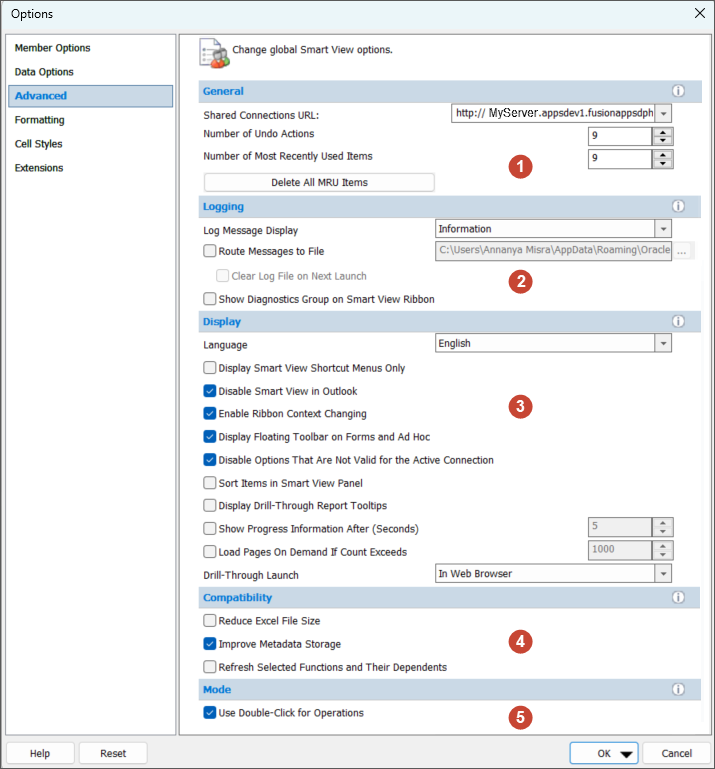
Advanced options are settings for administrative and other advanced tasks and apply to the entire current workbook, including any new worksheets added to the current workbook, and to any workbooks and worksheets that are created.
You can set the following Advanced Options:
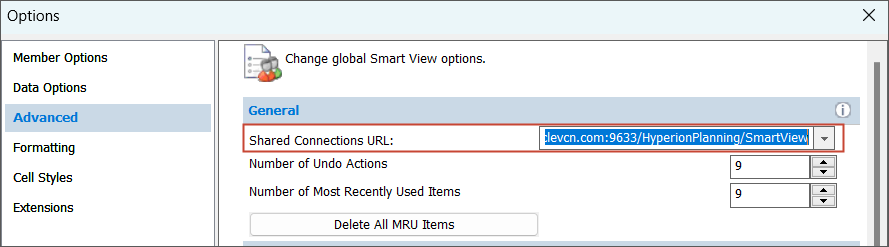
- General: Specify a default URL for all connections, the number of undo actions, and the number of most recently used connections to be displayed on Smart View Home.
- Logging: Choose which of the displayed messages to record in a log file.
- Display: Control what is displayed in Smart View.
- Compatibility: Compress the metadata maintained in Excel files containing Smart View workbooks, and allow for more efficient storage of internal data structures.
- Mode: Select the double clicking behavior for operations.
- In Shared Connections URL, enter the web URL followed by
workspace/SmartviewProviders. For
example,
http://xxxx-epmxxxx-xxxx.oracledemos.com:9010/workspace/SmartViewProviders.
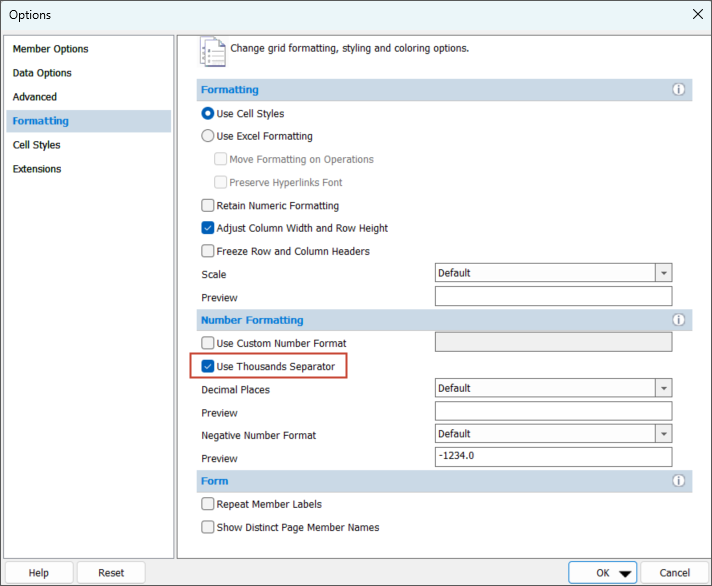
- On the left pane, click Formatting.

You can set the following formatting options:
- Format data:
- Include a thousands separator.
- Select whether to use cell styles or Excel formatting for data.
- Choose to retain numeric formatting when you drill down in dimensions, to retain the Excel formatting you have set. For example, if you chose to display negative numbers in red, then negative values will be displayed in red as you drill down on any member.
- Select to automatically adjust column width and row height.
- Choose options for scaling, previewing, and the number of decimal places.
- Facilitate the readability of Planning forms by allowing member names to appear on each row of data.
- Format data:
- In Formatting, select Use Thousands Separator.
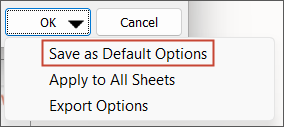
- To the right of OK, click
 , and
click Save as Default Options.
, and
click Save as Default Options.
- Minimize Excel.
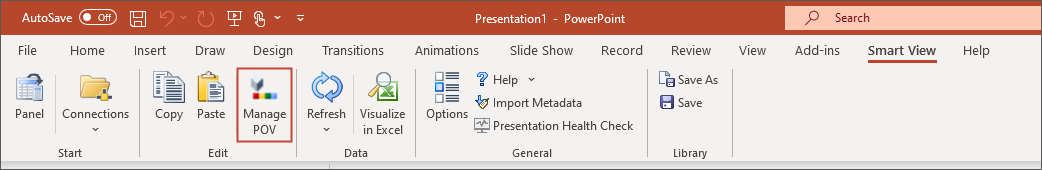
Setting up PowerPoint Connections
- Open the SmartView_SalesPlan.pptx file.
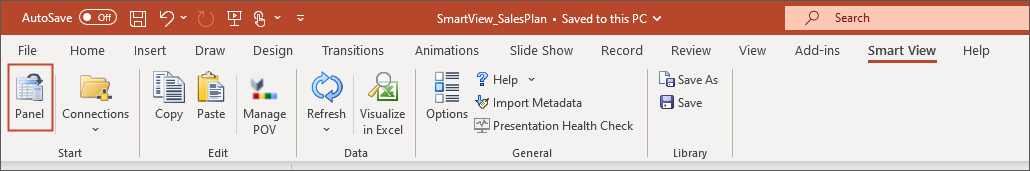
- In the ribbon, click Smart View.
- From the Smart View ribbon, click Manage POV.
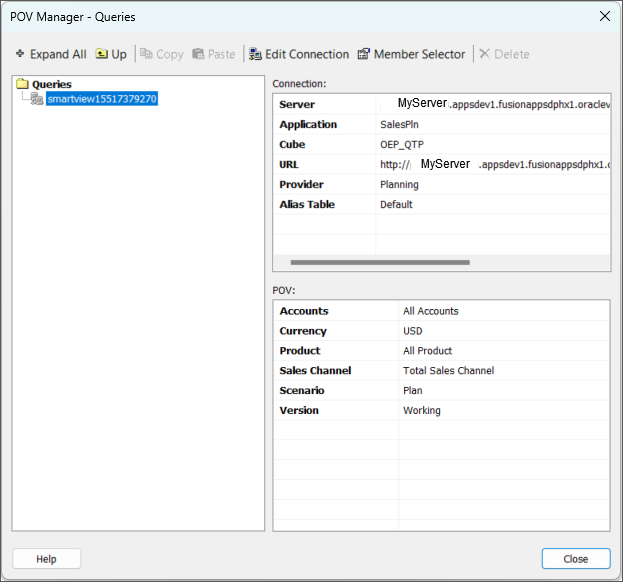
- Under Queries, select the Smart View connection, and click Edit Connection.
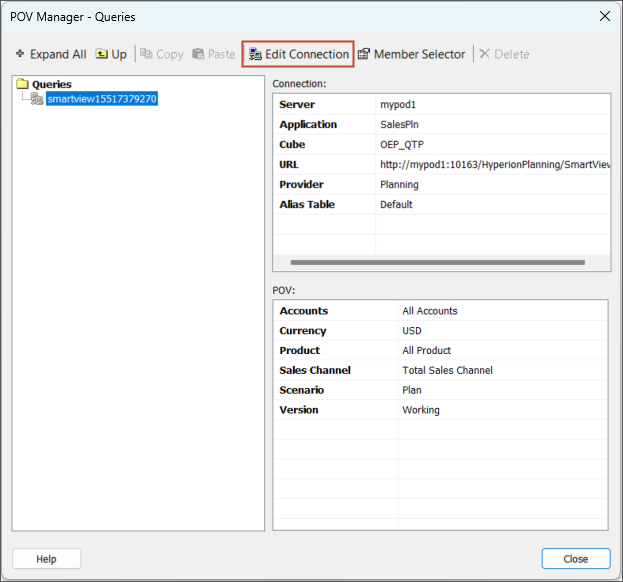
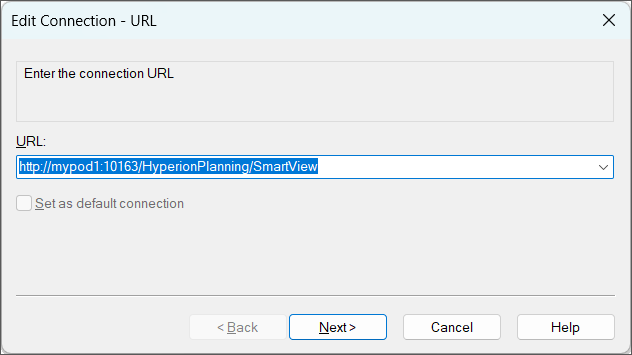
- Enter the URL for your environment. The URL will typically have this syntax:
http://xxxx-epmxxxx-xxxx.oracledemos.com/HyperionPlanning/SmartView, and click
Next.
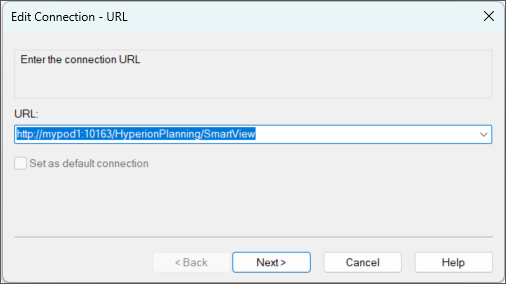
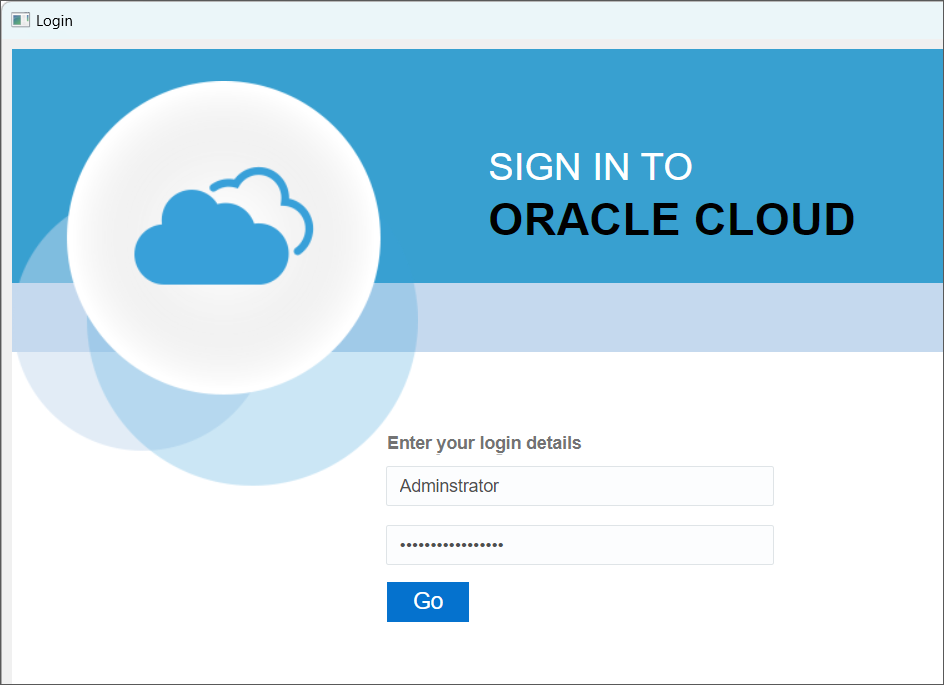
- Enter your login details and password, and click Go.
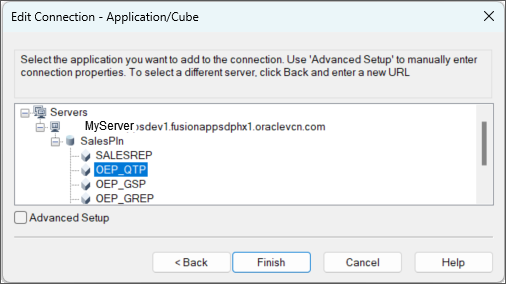
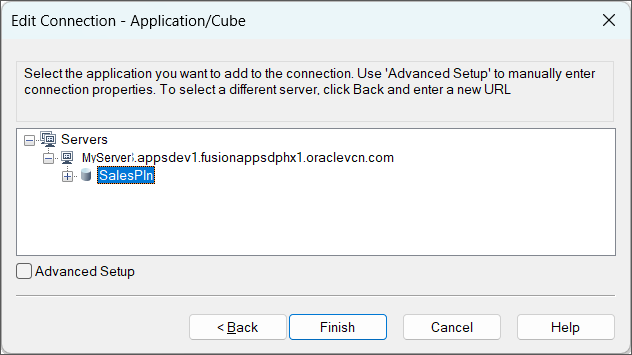
- Expand Servers, the connection, SalesPln, and select
OEP_QTP, and
click Finish.
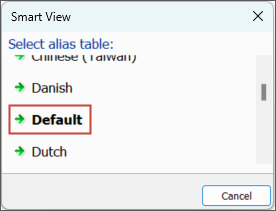
- Select the Default alias table.
- In POV Manager - Queries, click Close.
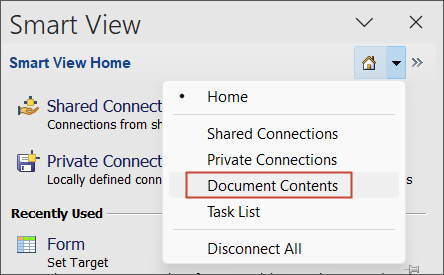
- In the Smart View ribbon, click Panel.
- In the Smart View panel, click the arrow next to the Home icon, and select Document
Contents.
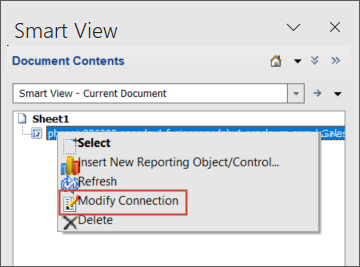
- Click the connection for Slide2, and select Modify Connection.

- Enter your URL, and click Next.
- Expand Servers, the server, and select SalesPln, and click Finish.
- Click the connection for Slide3, and select Modify Connection.
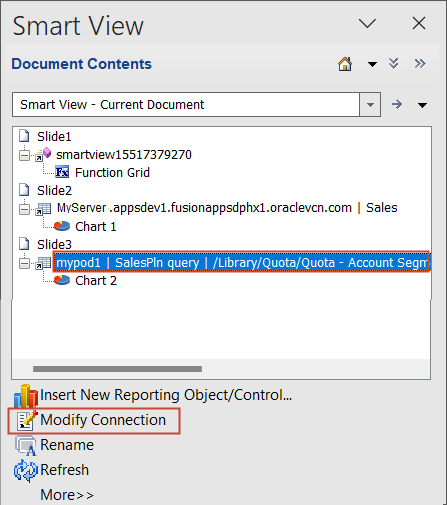
- Enter your URL, and click Next.
- Expand Servers, the server, and select SalesPln, and click Finish.
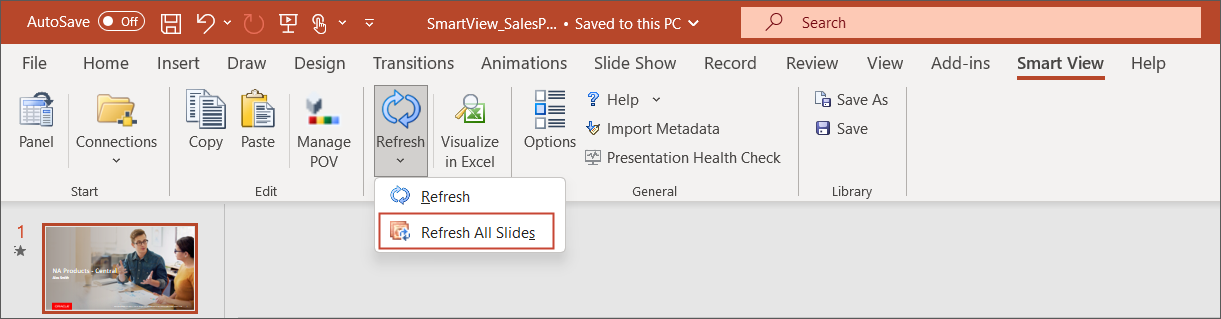
- On the Smart View ribbon, click Refresh drop-down and select Refresh All
Slides.
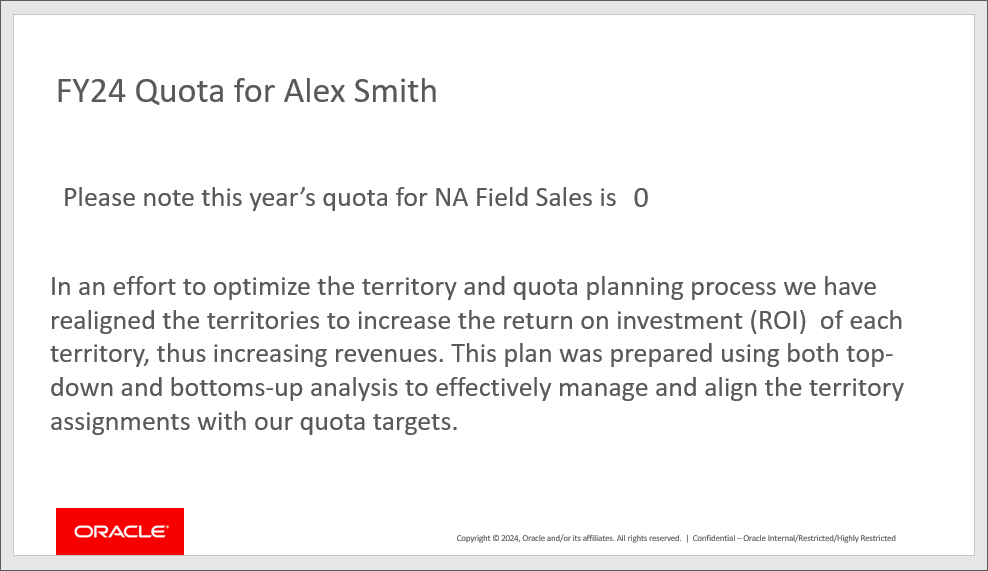
- Select the second slide.
Since no target data has been entered, 0 is displayed.
- Save the file. Click
 (Save).
 - Close PowerPoint.

Setting Quota Targets in Smart View
In this section, you set overall quota targets, and you set quota by product.
Setting Overall Quota Targets
- Maximize Excel.
- On the Smart View ribbon, click Panel.
- In the Smart View panel, click Shared Connections.
- Enter your login details and password, and click Go.
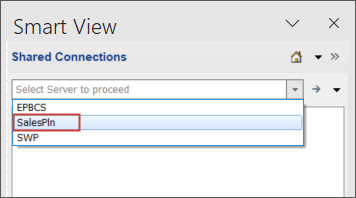
- From the Shared Connection drop down, select SalesPln.
Tip:
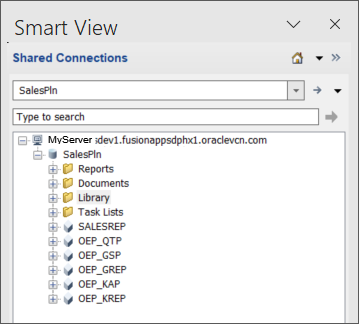
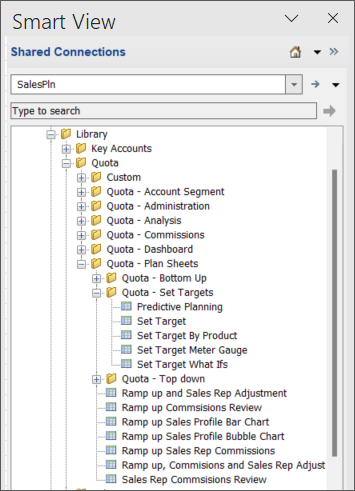
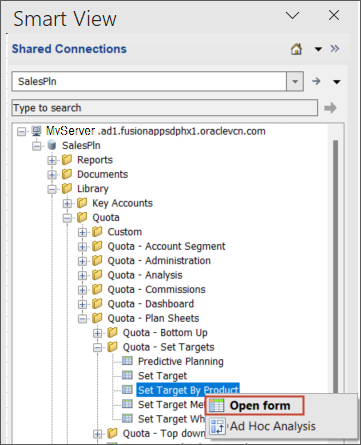
If you do not see EPM Cloud in the drop down, go back to Setting Smart View Options and verify you set up the Shared Connections URL correctly in Advanced options. - Expand the server, SalesPln, and Library.
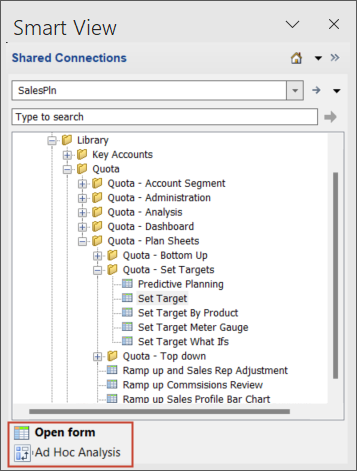
- Expand Quota, Quota - Plan Sheets, and Quota - Set
Targets.
- Right-click Set Target, and select Open Form.
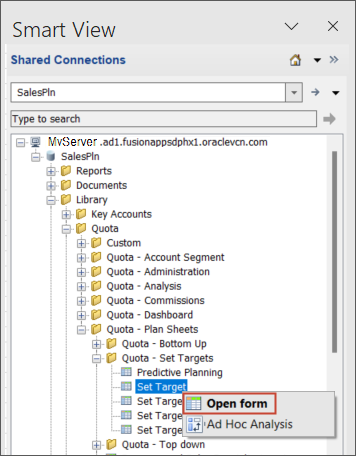
The form is opened and the Planning ribbon is displayed.
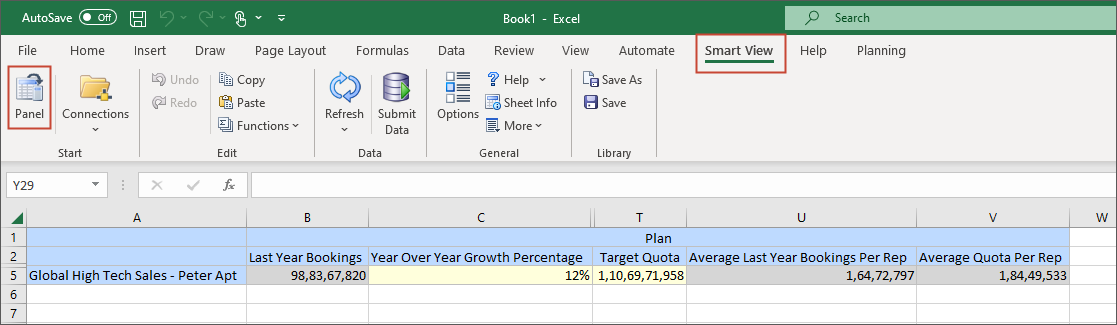
- To provide more space to work in Smart View, close the Smart View panel.

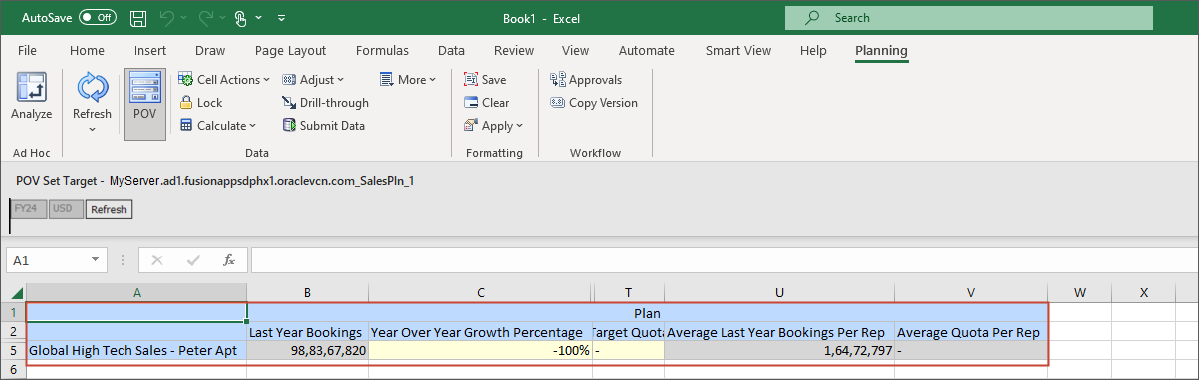
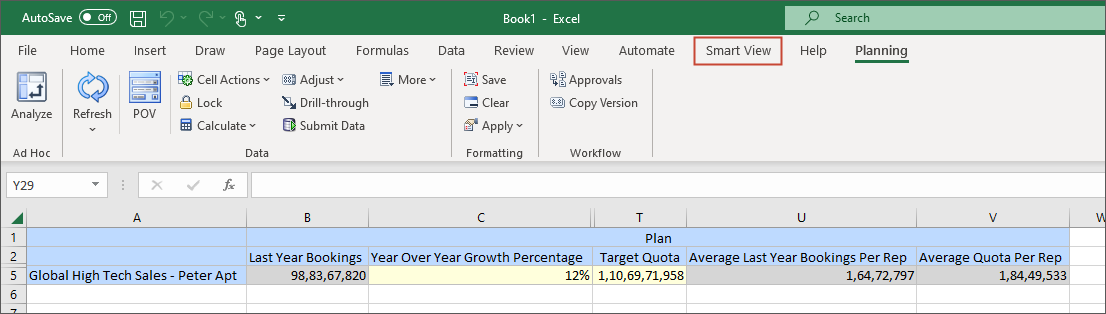
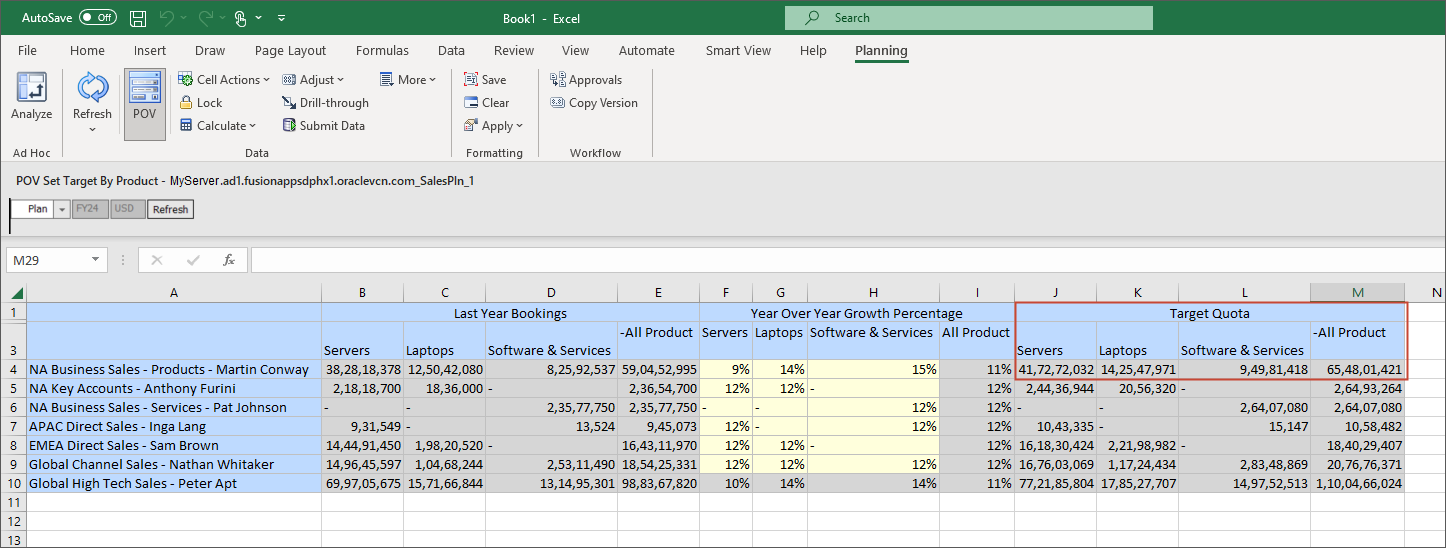
Information for Peter Apt's organization is displayed.

- In YOY Growth%, enter 12% and in the Planning ribbon, click Submit
Data.
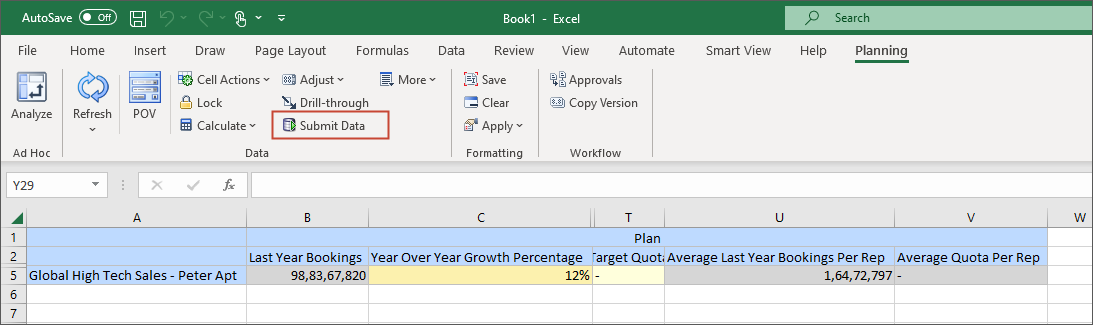
Target quota is updated, and is now 12% higher than last year's bookings.
Setting Targets by Product
- Click the Smart View tab. Then, click Panel, to open the Smart
View panel.
- In the Smart View panel, under Quota - Set Targets, right-click Set Target By
Product, and
select Open form.
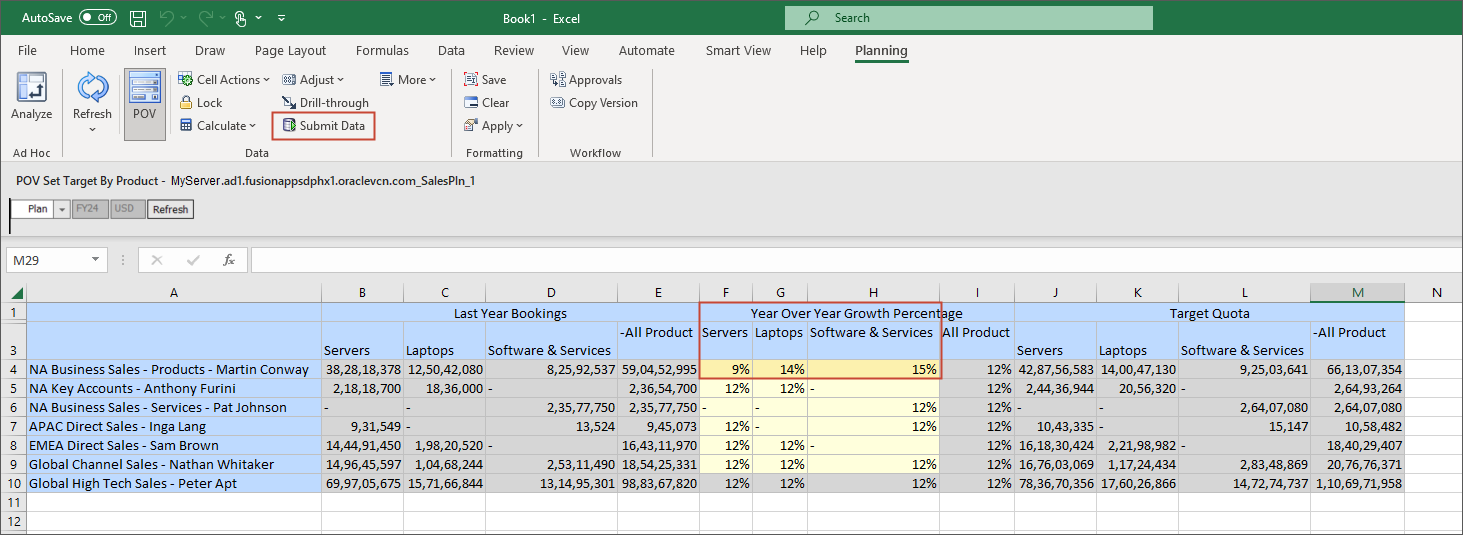
- For NA Business Sales - Products - Martin Conway, in YOY Growth%, enter the following, in Adjust
YoY Growth by
Product, and in the Planning ribbon, click Submit Data:
- Servers: 9%
- Laptops: 14%
- Software & Services: 15%
Tip:
To provide more space to work in Smart View, close the Smart View panel. To reopen the Smart View panel, click Panel in the Smart View ribbon.Target quota is updated based on the year over year growth percentages.
- Exit Excel without saving.
Allocating Target Quota
In this section, you allocate target quota to territories.
Activating the Sales VP's Navigation Flow
- Return to the home page. Click
(Home).
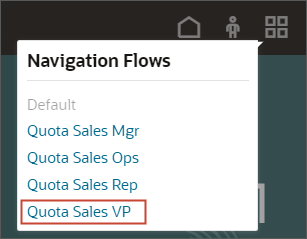
- In the upper right, to the left of your user name, click
 (Select Navigation Flow) and select
Quota Sales VP.
(Select Navigation Flow) and select
Quota Sales VP.
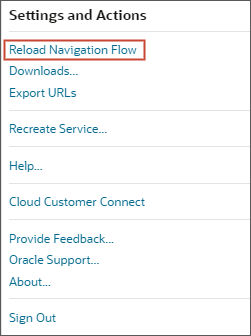
- In the upper right, click
 (Administrator), and select Reload Navigation Flow.
Allocating Target Quota to Regions
In this section, you review the sales quota for the VP, and allocate to the next level in the hierarchy.
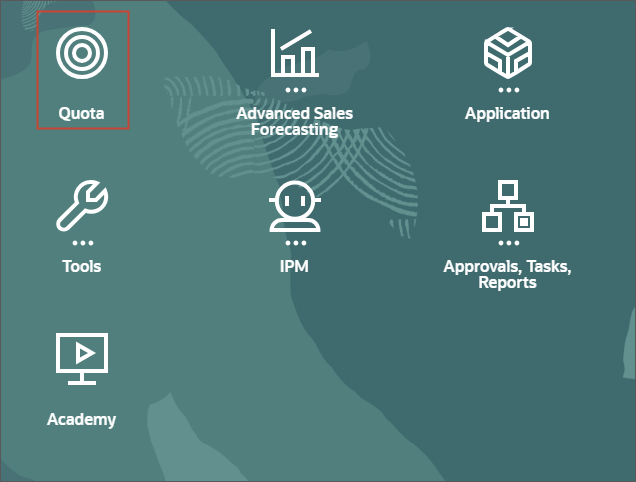
- On the home page, click Quota.
- Click the Top Down and Adjust horizontal tab.

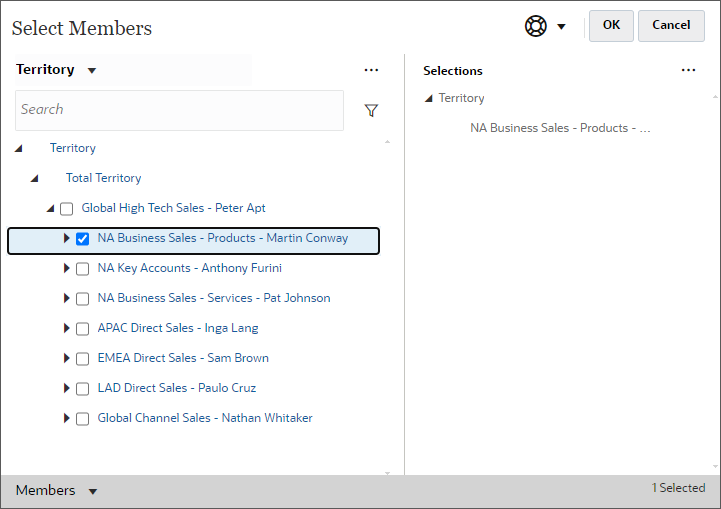
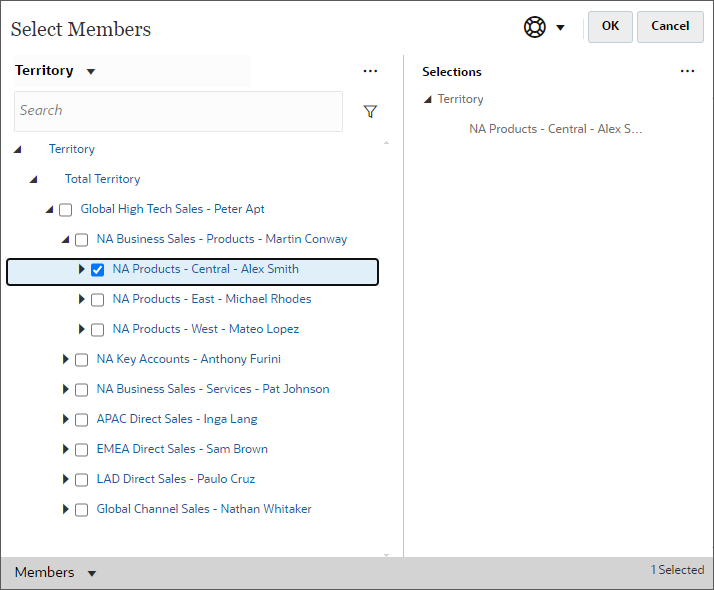
- In the Member Selector, expand Territory > Total Territory, select NA
Business Sales - Products -
Martin Conway, and click OK.
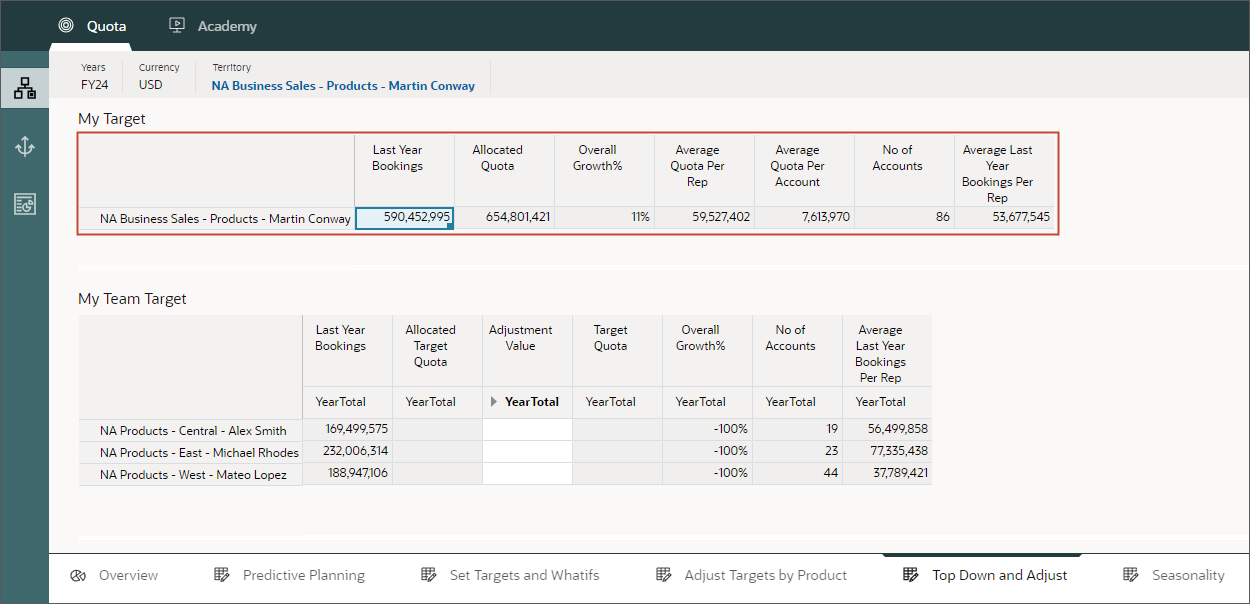
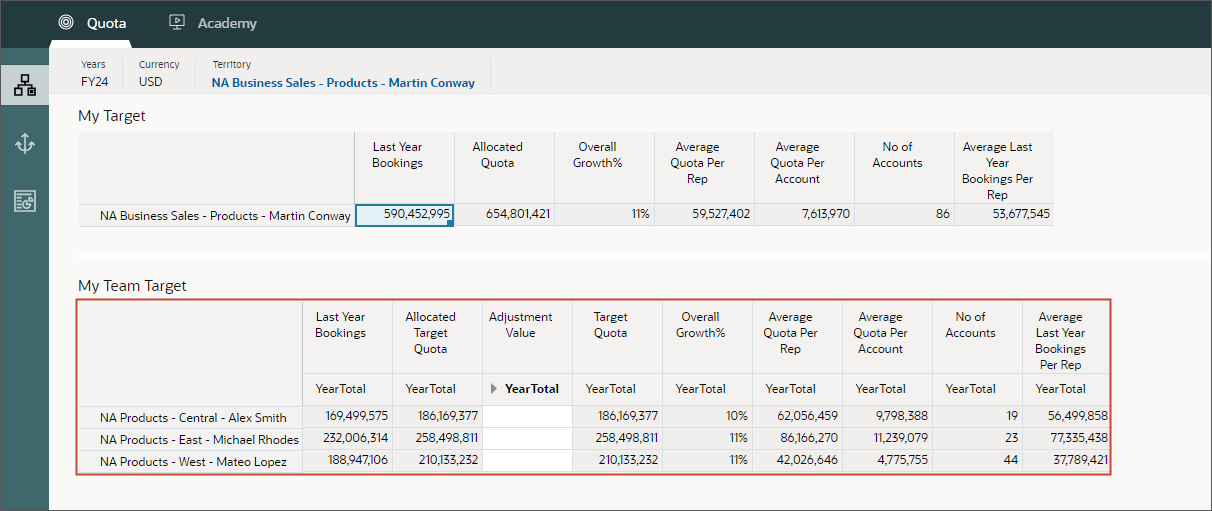
- For the Sales VP, Martin Conway, review the target quota and other key measures such as last
year's bookings,
allocated quota, the assigned overall growth, average quota per rep and account, and number of
accounts.
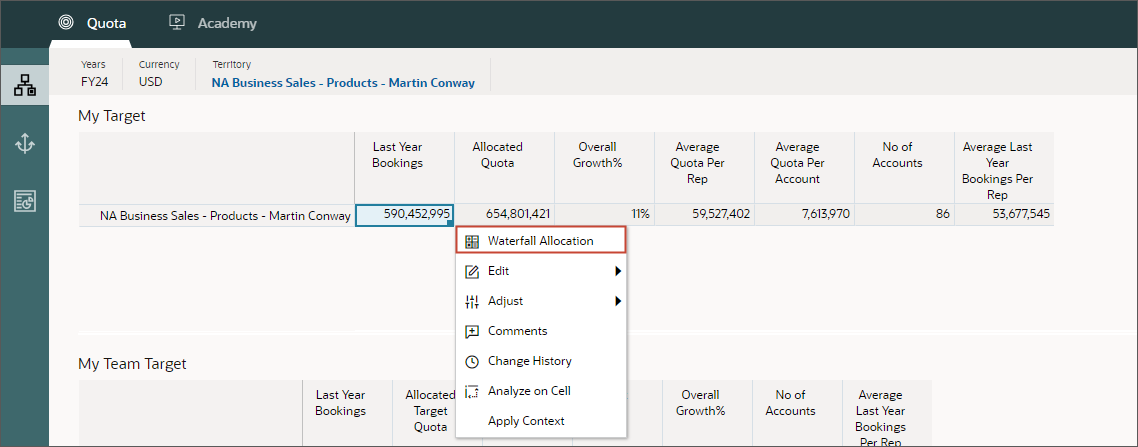
- In the My Target form, right-click and select Waterfall Allocation.
To plan for the VPs team quota, you allocate target quotas to the Regional Sales Managers. Allocate quota using the waterfall method to plan sales quota one step below in the hierarchy to the regions.
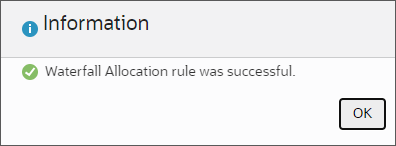
- In the Information message, click OK.
Quota is allocated to sales managers. Key measures are calculated including the overall growth percentage, the average quota per sales rep, and per account, and the number of accounts.
Activating the Sales Manager's Navigation Flow
In this section, you activate the Sales Mgr's navigation flow to help you move through the steps for allocating quota.
- Return to the home page. Click
(Home).
- In the upper right, to the left of your user name, click (Select Navigation Flow) and select
Quota Sales Manager.
- In the upper right, click
(Administrator), and select Reload Navigation Flow.
Allocating Target Quota to Territories
- On the home page, click Quota.
- Click the Top Down and Adjust tab.

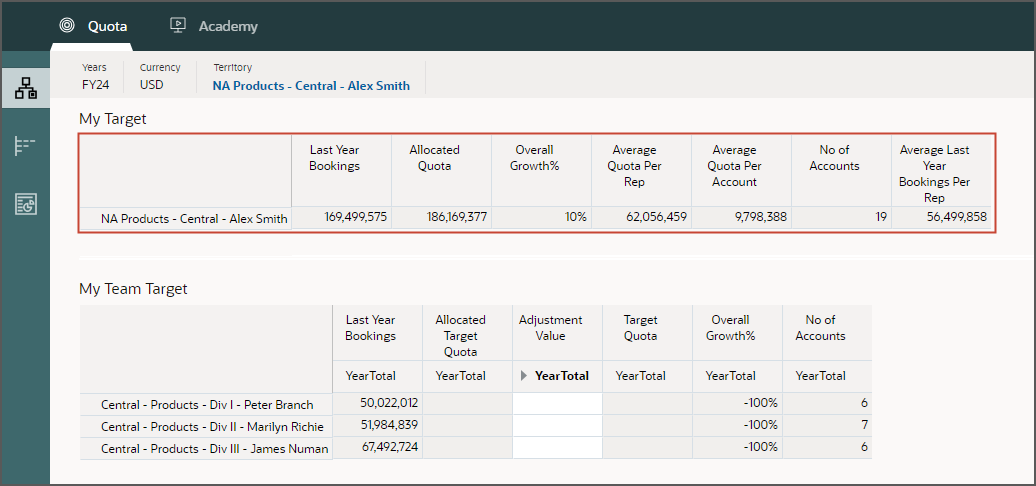
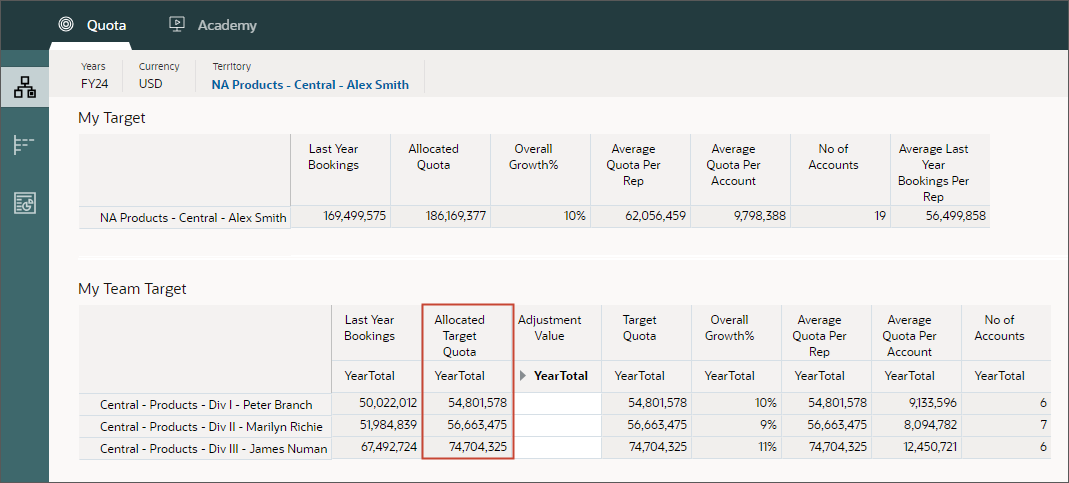
- On Top Down and Adjust, in the Member Selector, expand Territory > Total Territory > Global High Tech Sales - Peter Apt > NA Business Sales - Products - Martin Conway, and select NA Products - Central - Alex Smith.
- Click OK.
- Review the quota for Alex Smith's region.
Data for the Central region is displayed on the top of the page including the allocated quota for the Central region.
- In the My Target form, right-click and select Waterfall Allocation.
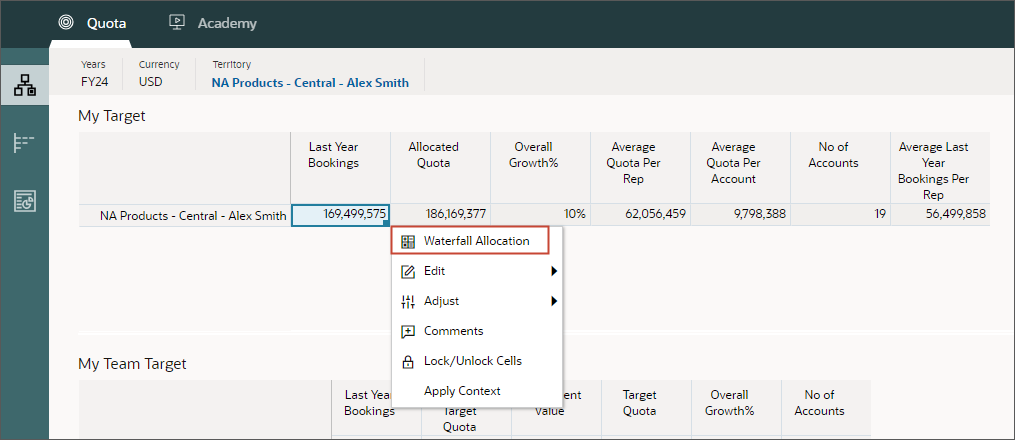
- In the Information message, click OK.
Quota is allocated to the sales reps.
Reviewing Sales Planning Quotas in Smart View
In this section, you open a form in Smart View and adjust quota by product. Then you return to the web to see the changes.
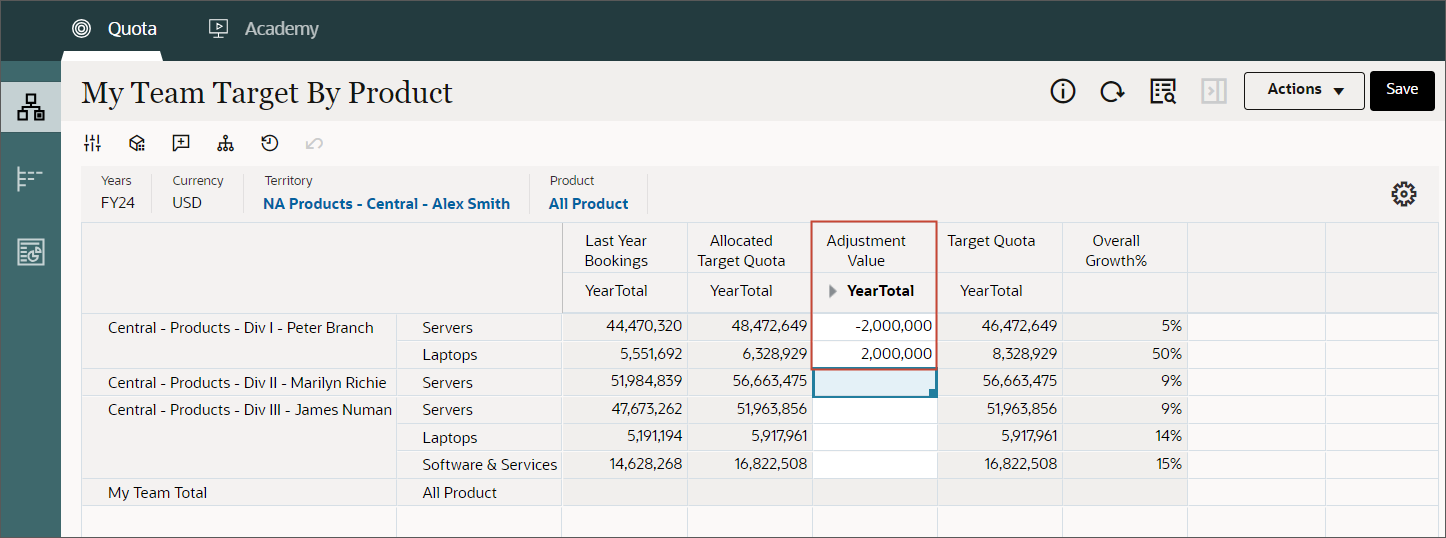
- Click the Adjust by Product horizontal tab.

- In My Team's Target by Product, move your mouse to the top right section of the form, and click
 (More).
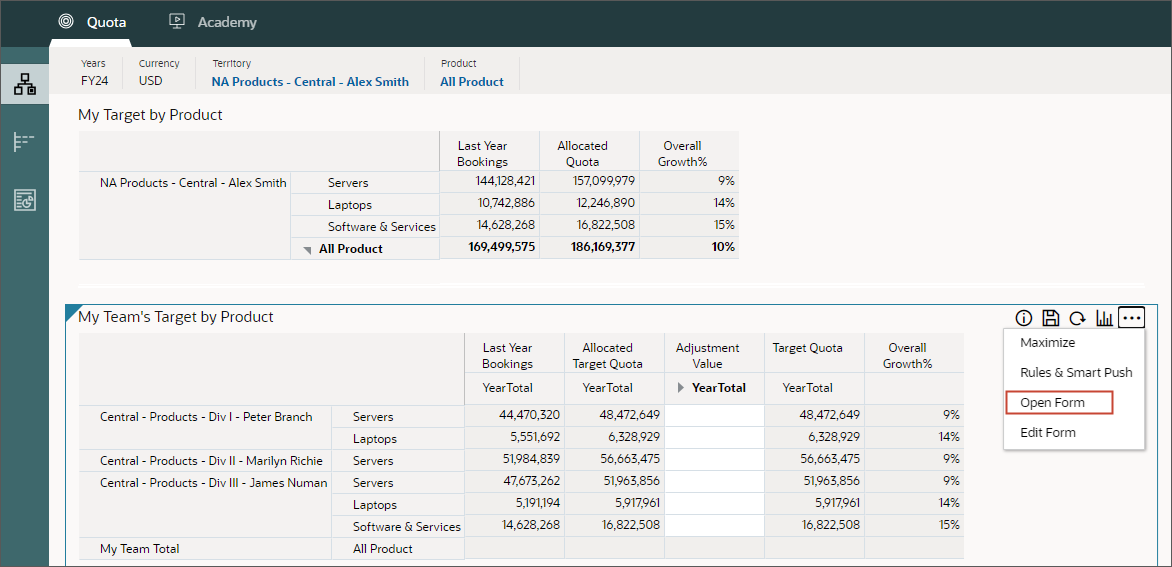
- Click Actions, and select Open in Smart View.
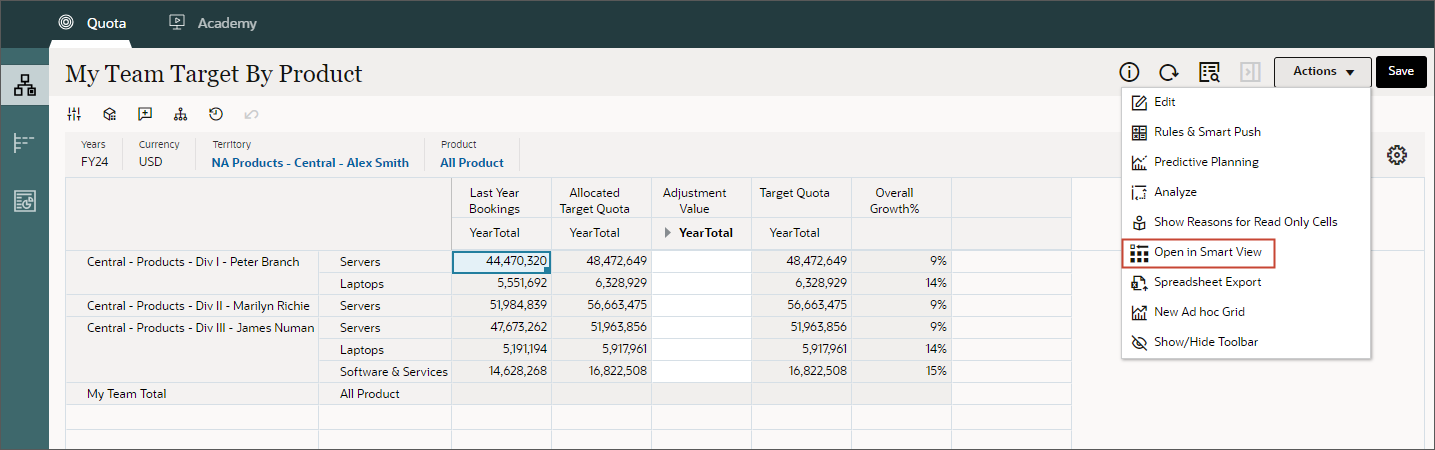
- Keep the default selection to Open the file, and click OK.
The form is displayed in Smart View.
- For Central - Products - Div I - Peter Branch, enter the following in Adjustment Value, and
click Submit
Data:
- Servers: -2000000
- Laptops: 2000000
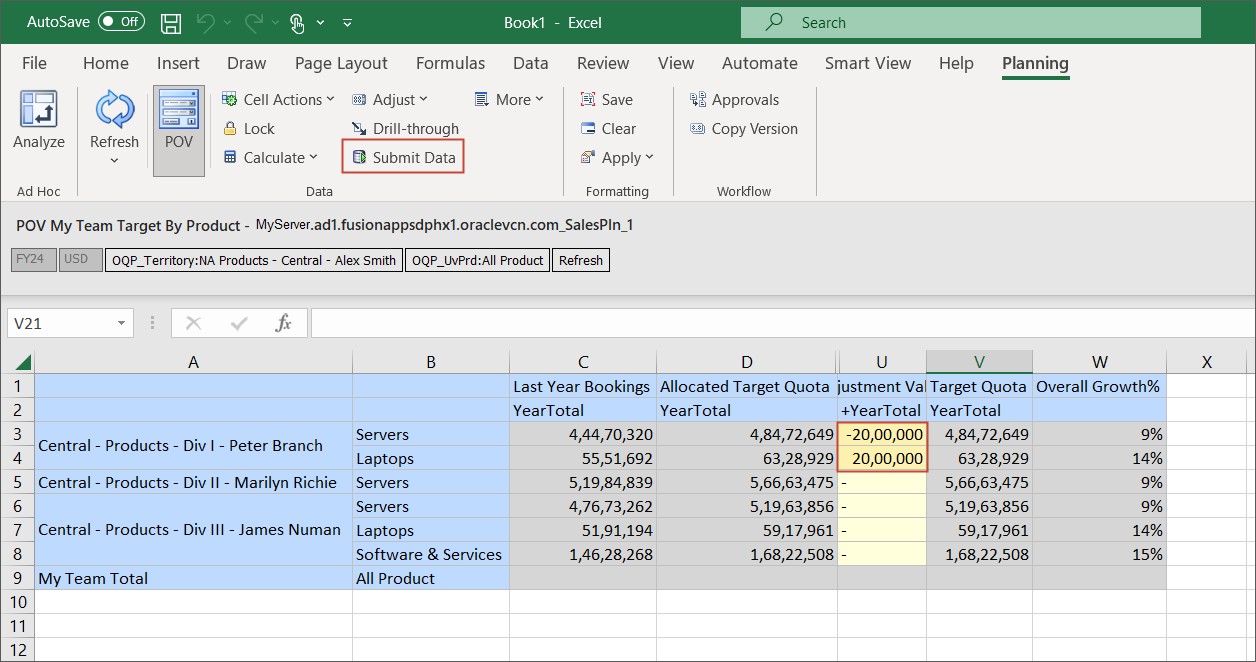
- Minimize Excel, and maximize the web browser.
- Click Refresh.
The adjustments are displayed.
- Minimize the browser.
Reviewing Sales Planning Quotas in PowerPoint
- Open the SmartView_SalesPlan.pptx (PowerPoint) file.
The file is opened and the first slide is displayed.

- Select slide 2.
There is no data displayed for Alex Smith. The data needs to be refreshed.
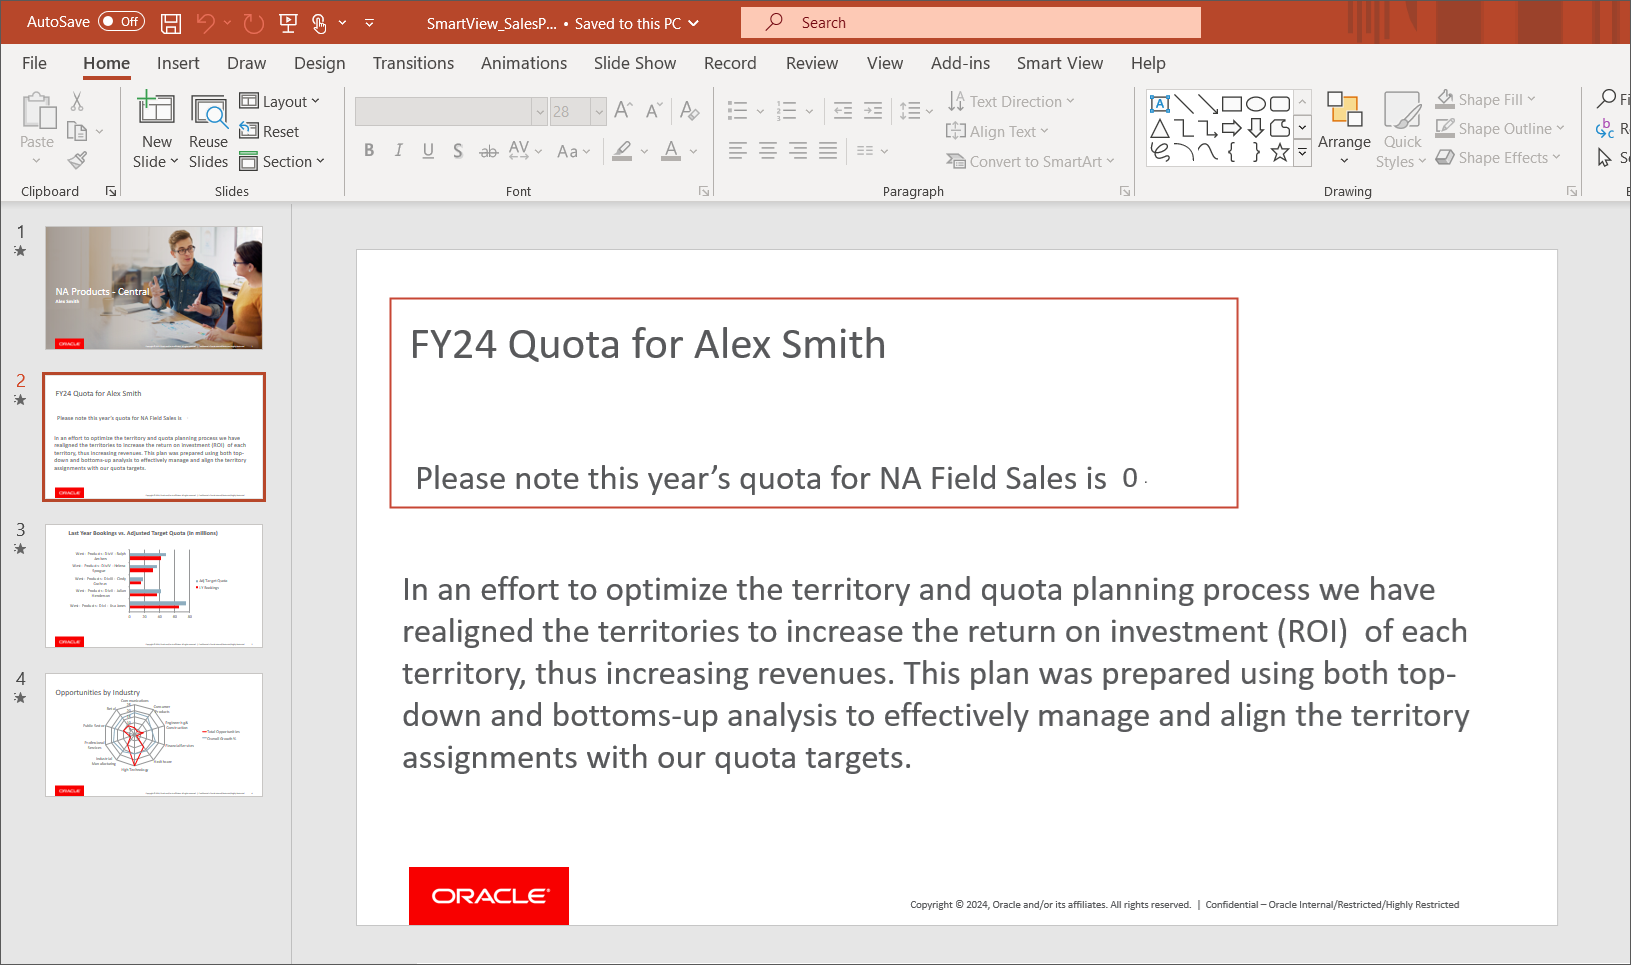
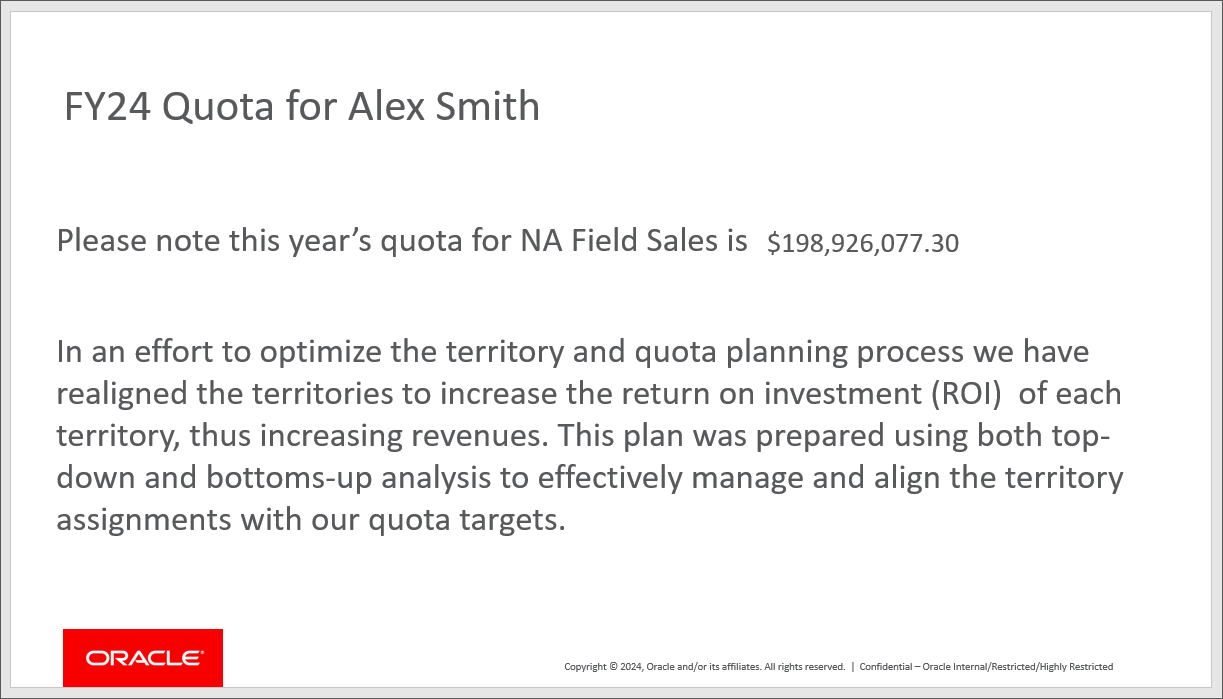
- On the Smart View ribbon, click Refresh drop-down and select Refresh All
Slides.

- Enter your login details and password, and click Go.
- Click the data value to see the data intersection.

- Select slide 3.
This slide shows how the adjusted target quota compares with last year's bookings.

- Select slide 4.
This slide shows opportunities by industry.

The quota for Alex Smith is updated.
Related Links
Setting and Analyzing Quotas in Sales Planning with Smart View
G13863-01
September 2024