Introduction
This 30-minute tutorial shows you how to enter Planning data, which consists of numeric data, Smart List data, percentage data and text data.
Background
You enter data on forms. You use form elements to navigate between different views of data and perform different actions on data.
You can enter or change data only in cells for which you have Write access (cells with a white background). Administrators set who can view and change which data. After you promote or submit data for review and approval, you cannot change the data (unless you become the owner again). If the data is approved, you cannot change the data unless the administrator who approved it restarts the approvals process.
Your administrator can set up a simple form so that when you move out of a cell, your changes are automatically saved, with no prompt or message. Cell values are totaled and the affected cells are displayed with a green background. If the structure of the simple form has not changed since you started working in it, when you save your data, your changed or new data is instantly saved.
If the form is not set to automatically save, then after you enter data, you can revert to the data on the form before you changed it, by clicking Refresh. You can also right-click in rows, columns, POV, or cells, displays the same options as the Actions menu.
Prerequisites
Cloud EPM Hands-on Tutorials may require you to import a snapshot into your Cloud EPM Enterprise Service instance. Before you can import a tutorial snapshot, you must request another Cloud EPM Enterprise Service instance or remove your current application and business process. The tutorial snapshot will not import over your existing application or business process, nor will it automatically replace or restore the application or business process you are currently working with.
Before starting this tutorial, you must:
- Have Service Administrator access to a Cloud EPM Enterprise Service instance.
- Have the Planning sample application (Vision) created in your instance.
- Set the navigation flow to Financial Flow - Admin.
Note:
If you run into migration errors importing the snapshot, re-run the migration excluding the HSS-Shared Services component, as well as the Security and User Preferences artifacts in the Core component. For more information on uploading and importing snapshots, refer to the Administering Migration for Oracle Enterprise Performance Management Cloud documentation.Navigating Forms in Planning
In this section, you learn about form sections such as the POV, pages, columns, and rows and learn about navigation keys to aid with form navigation.
Forms Sections Overview
Typically, forms include the following sections:
- Buttons to access the Actions menu, save data, refresh form data and close the form
- A Point of View, or POV, that allows you to select the member data intersection to work with
- Data cells or a grid similar to a spreadsheet
- A Data tab, Ad Hoc tab, and Format tab to make data more meaningful by adding data details, focusing your analysis with Ad Hoc Grids, and formatting data to define the font, size, and color
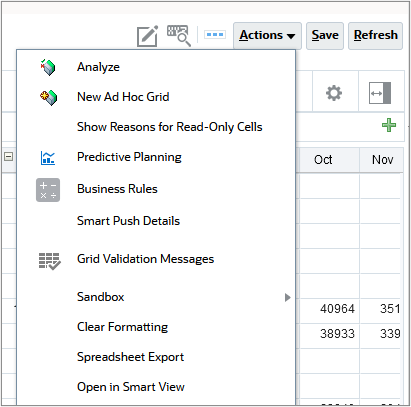
Actions Menu on Planning Forms
You can use the Actions menu to make changes to your data and provide additional detail for your data. You can also run business rules to calculate data, and run predictive planning.
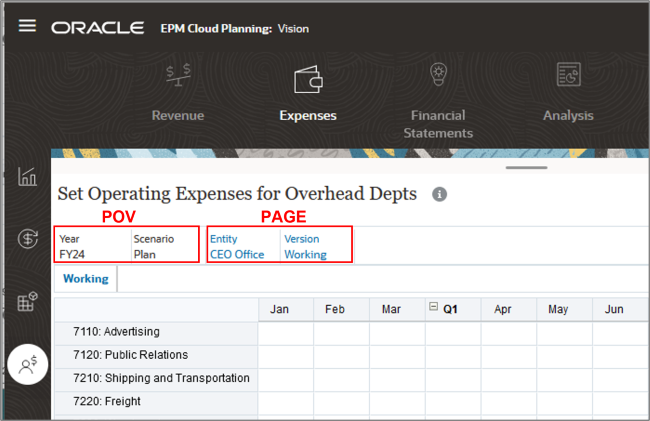
Setting the Point of View (POV) on Planning Forms
You select the POV and Page members before you enter data. The members displayed in the point of view show the context of the data in the pages, rows, and columns. You select page members from one or more dimensions for data entry. The rows and columns on the form show values for the currently selected page members. Row and column headings show the members that are available on the form.
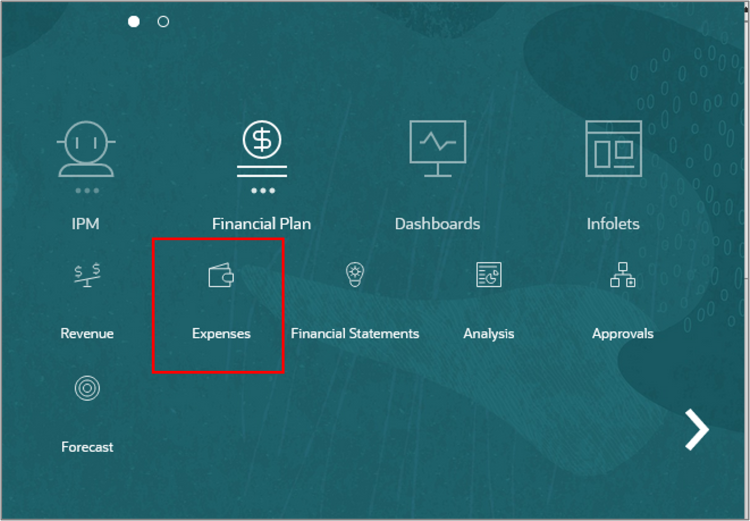
- From the Home Page, click Financial Plan, then Expenses.
- Click the fourth vertical tab (Other Expenses).
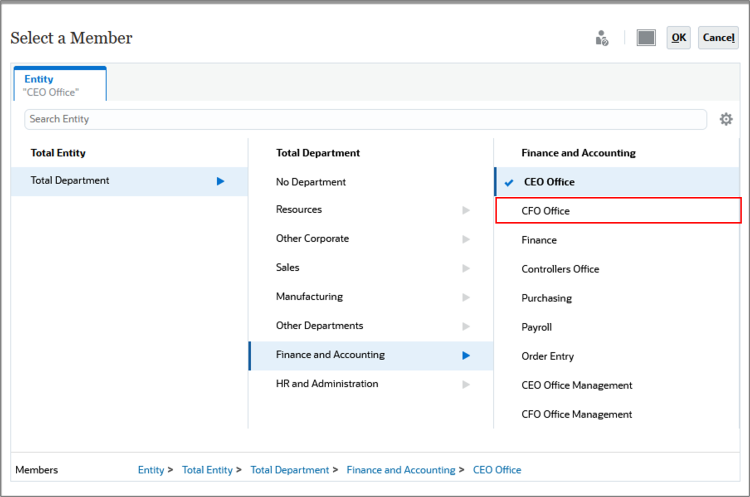
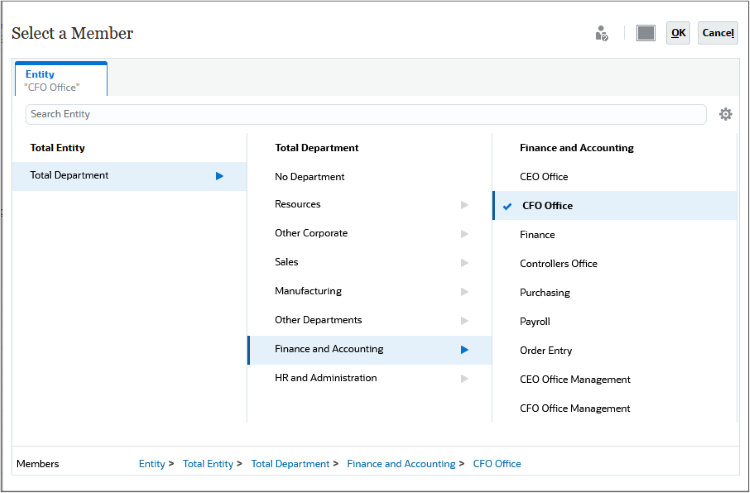
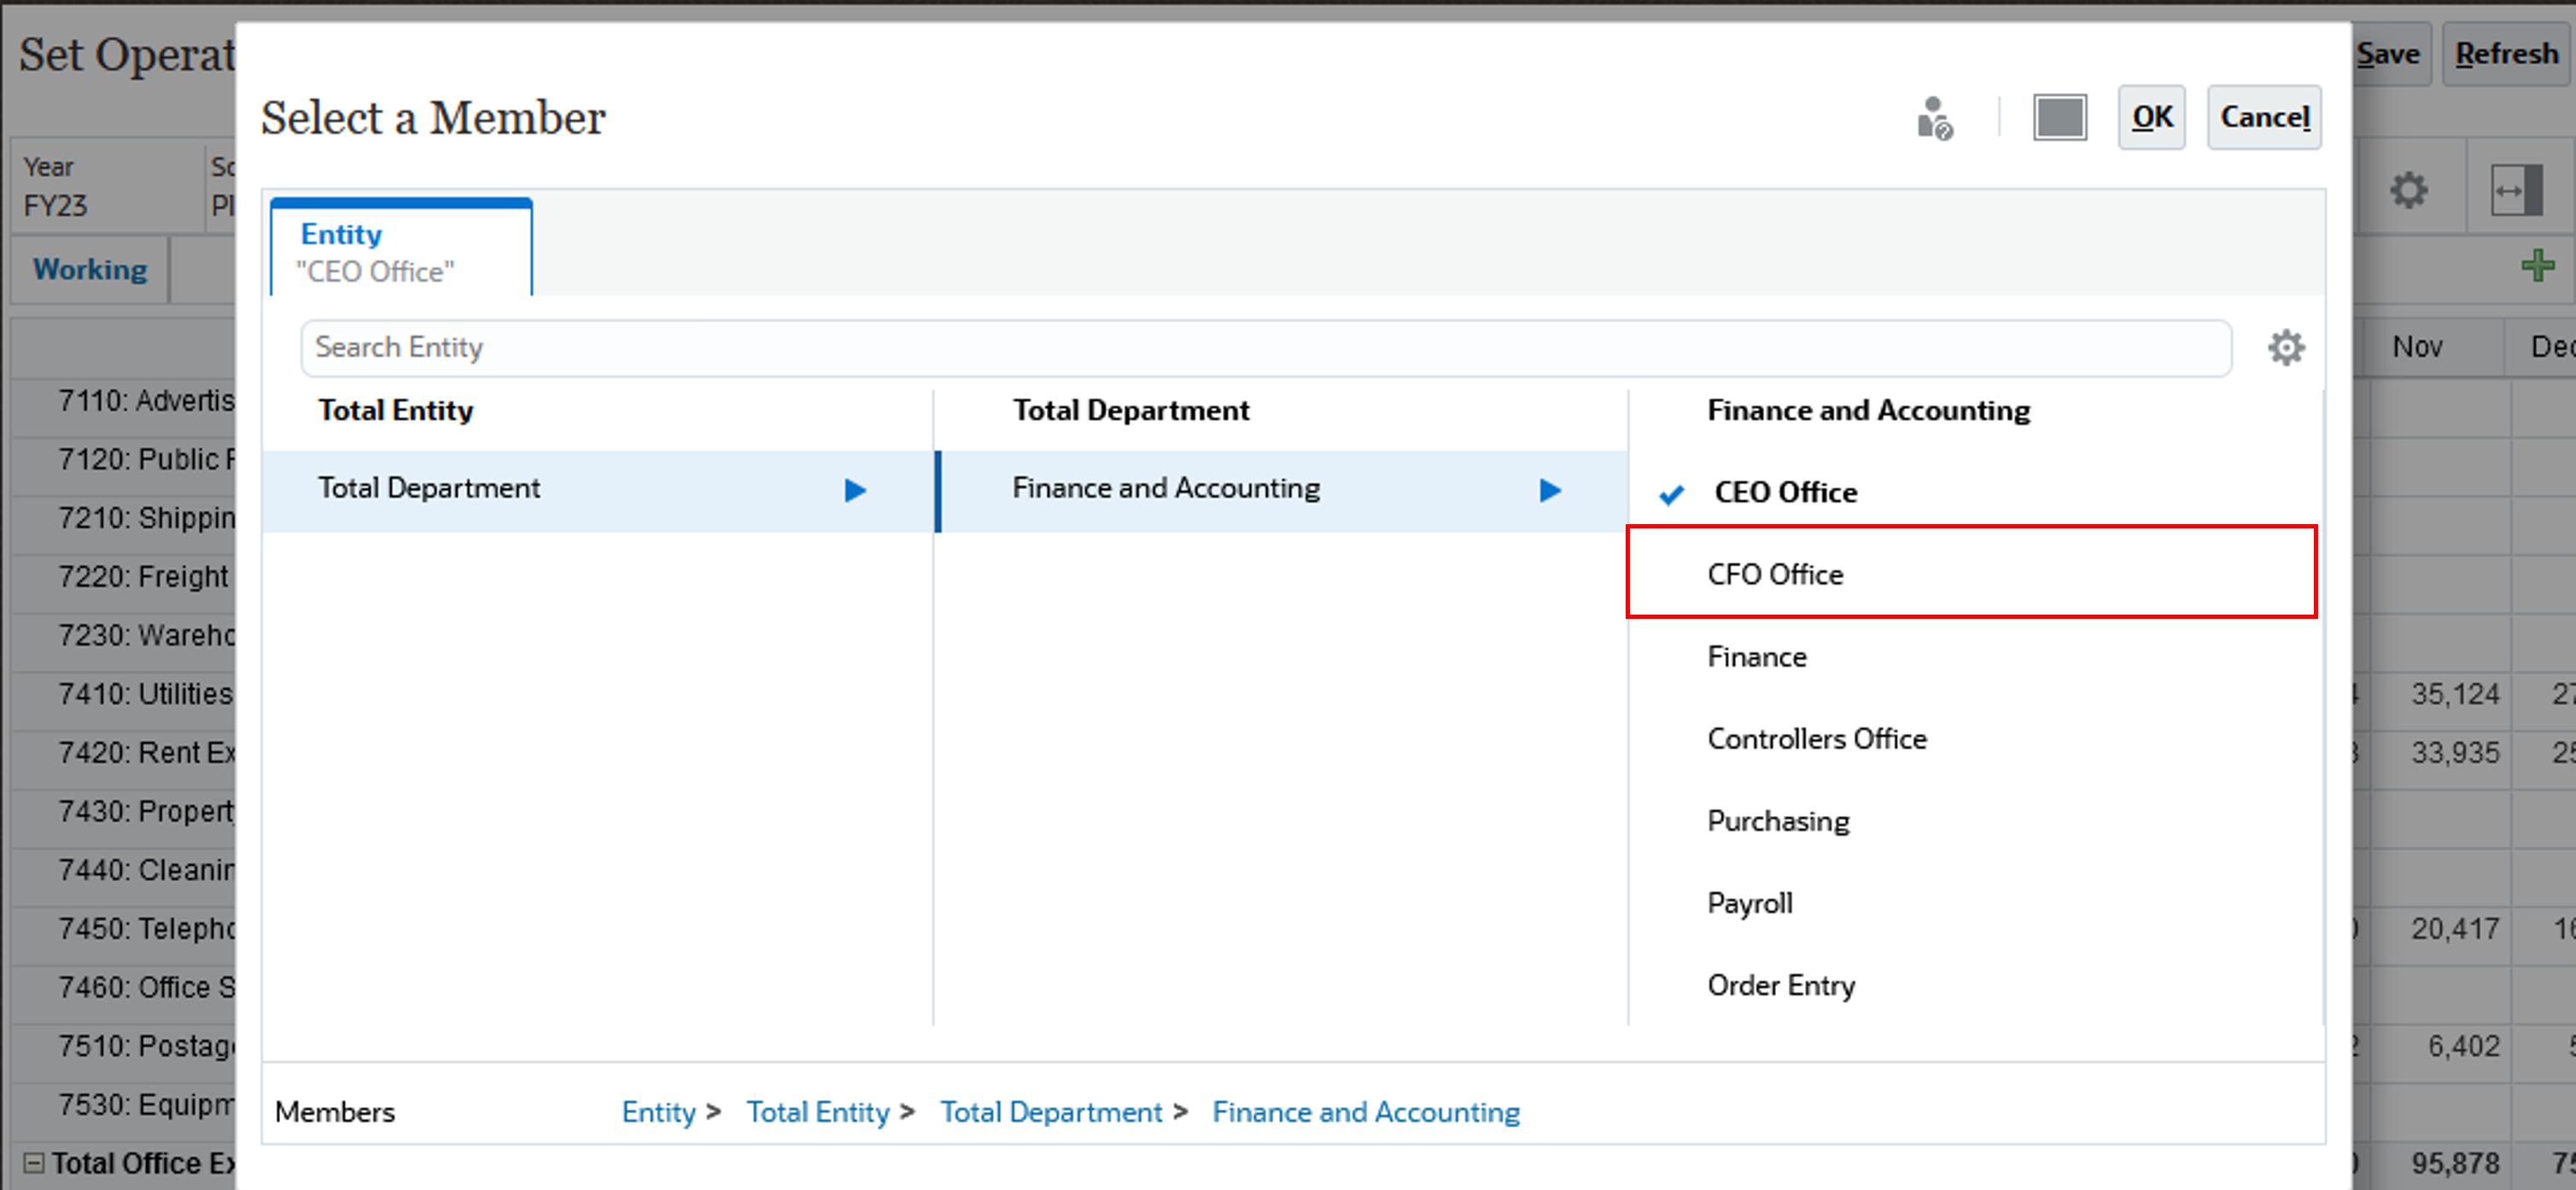
- In the POV, click Entity.
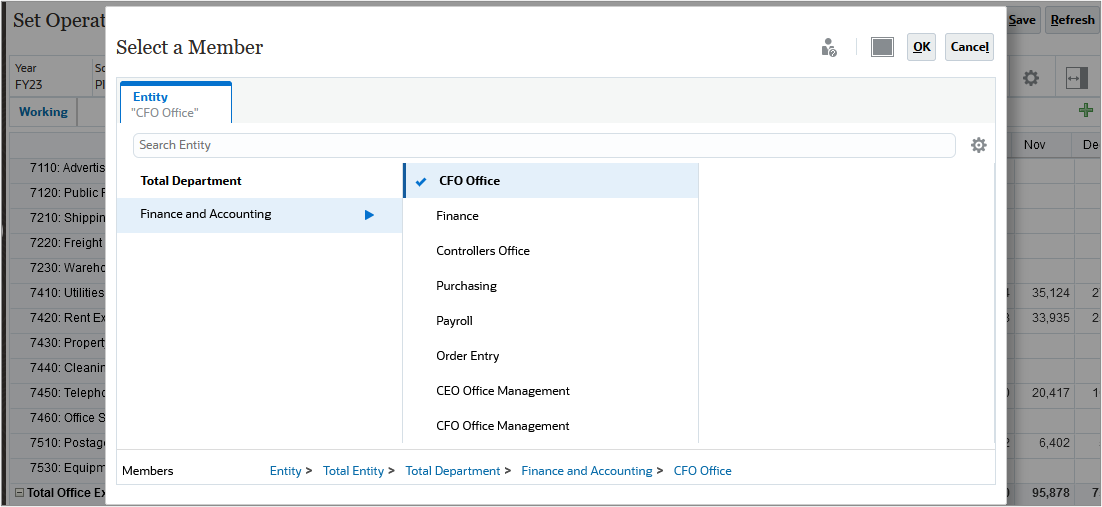
- Select CFO Office.
- Click OK.
- To the right of the POV bar, click (
 ) Go.
) Go.
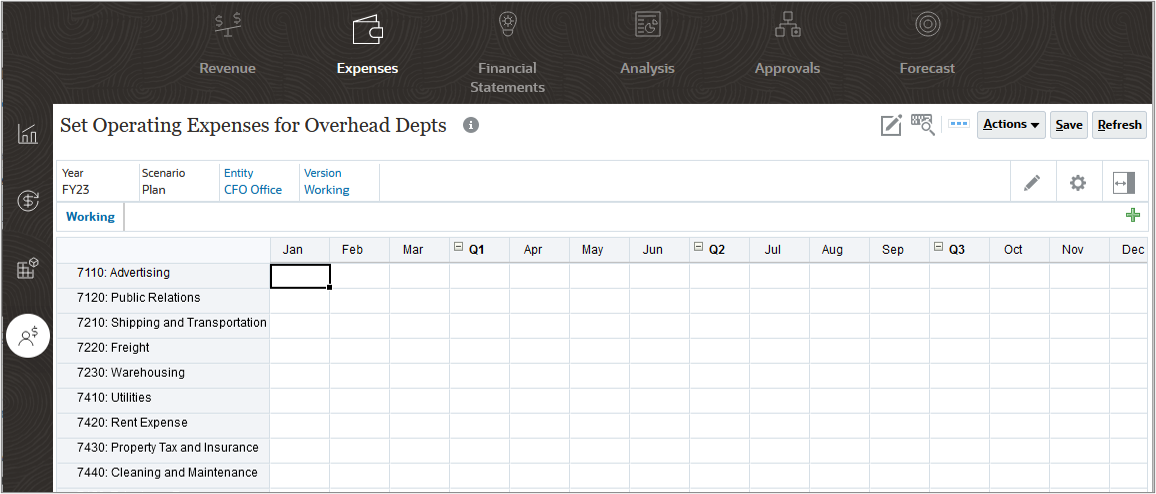
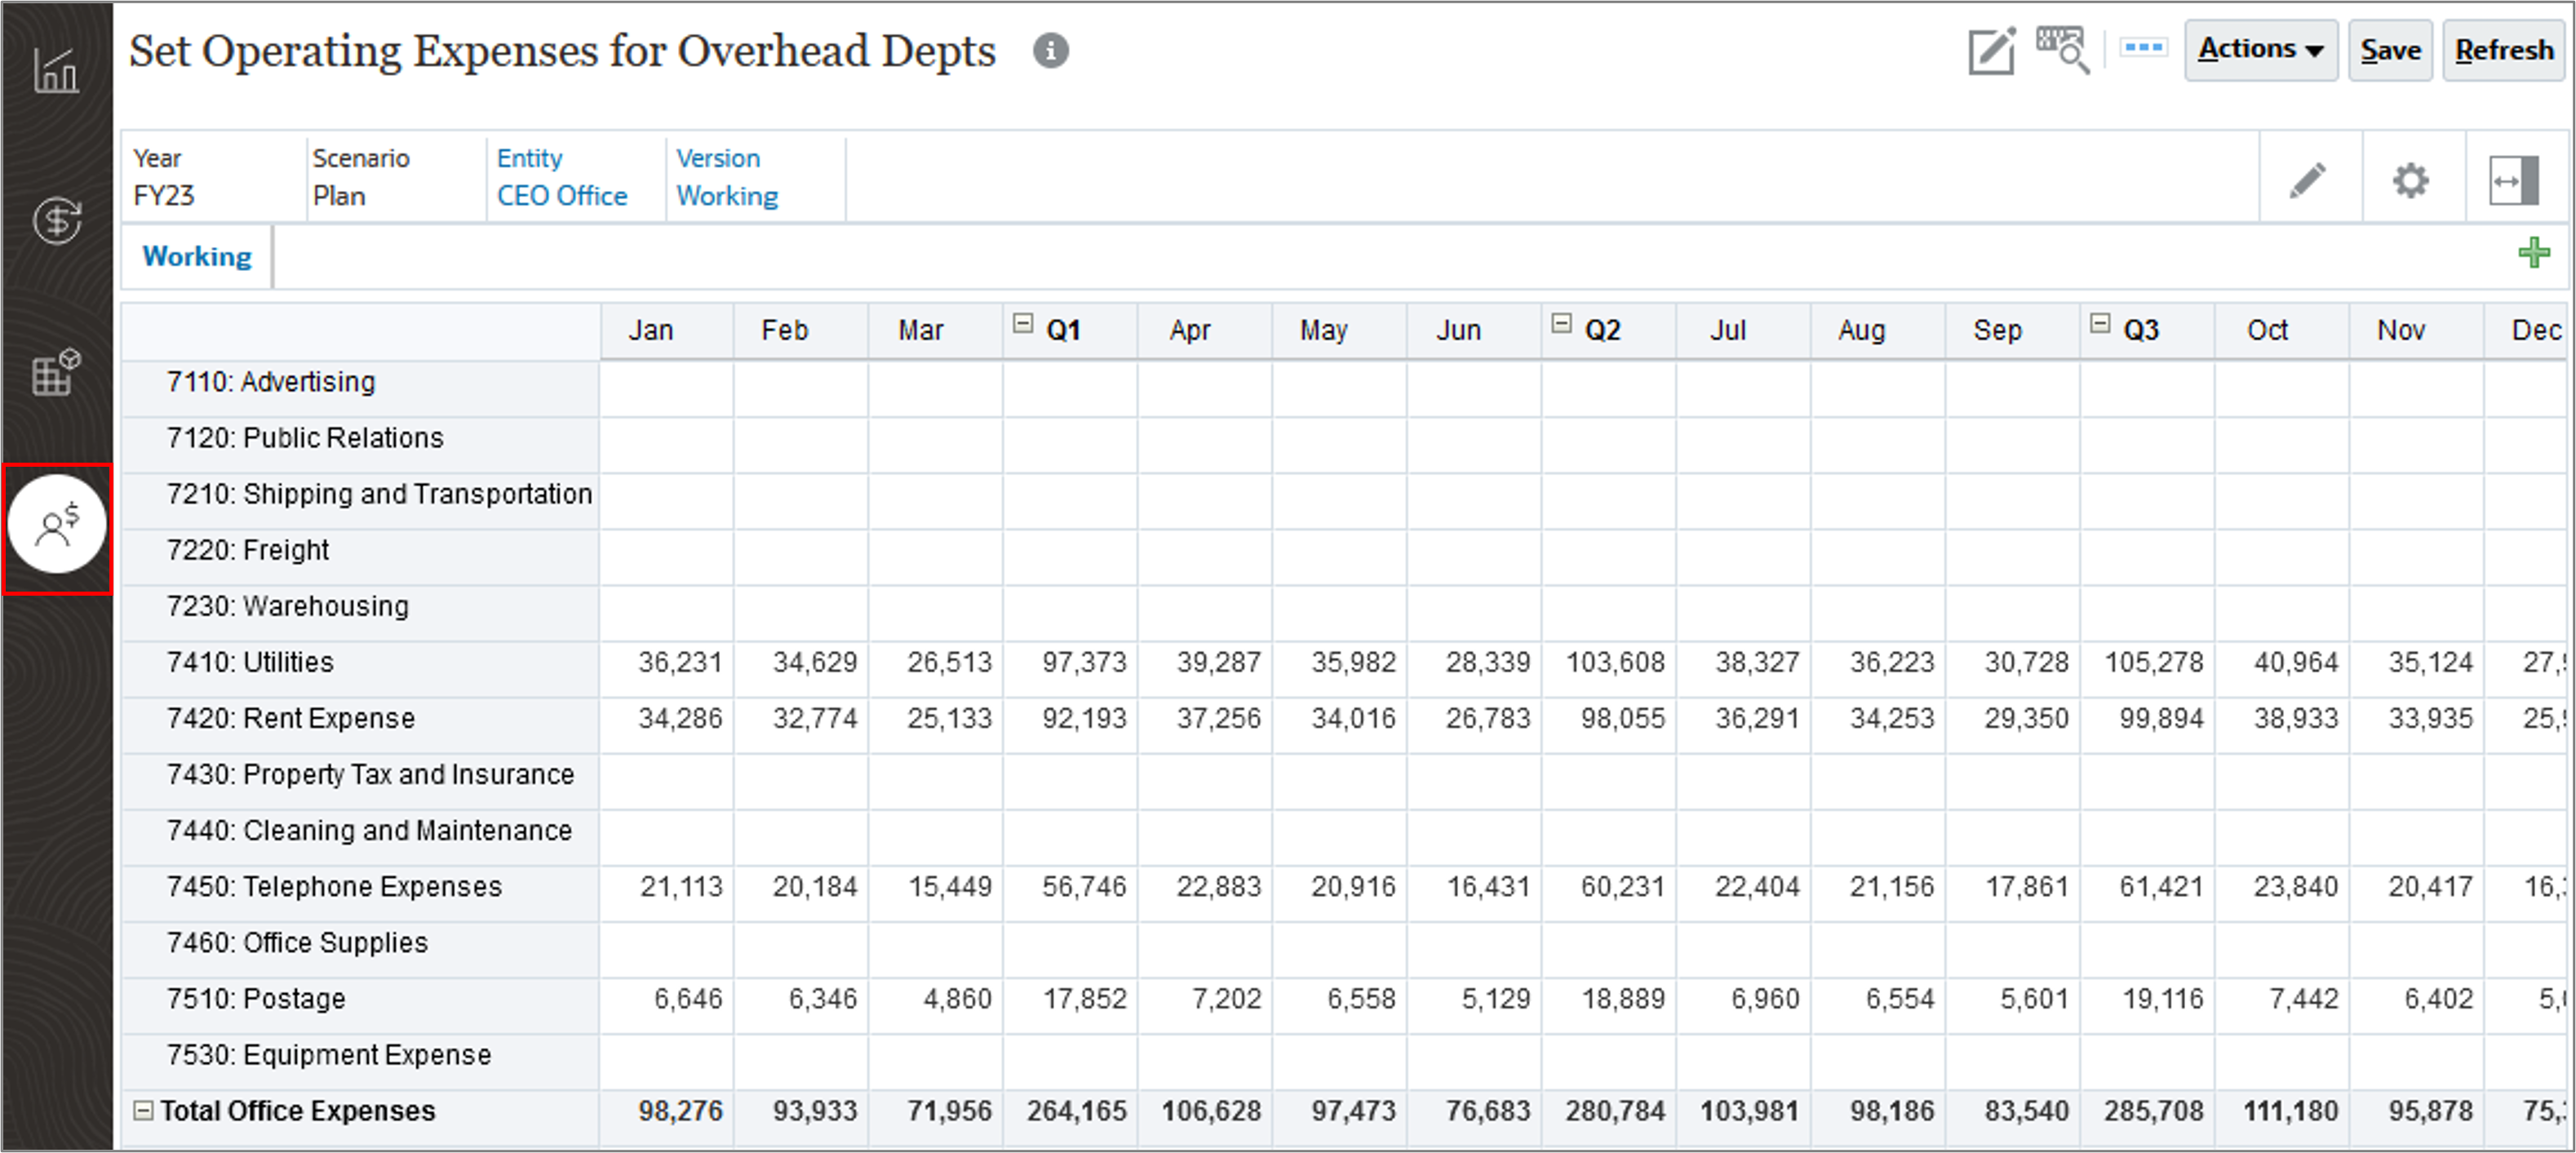
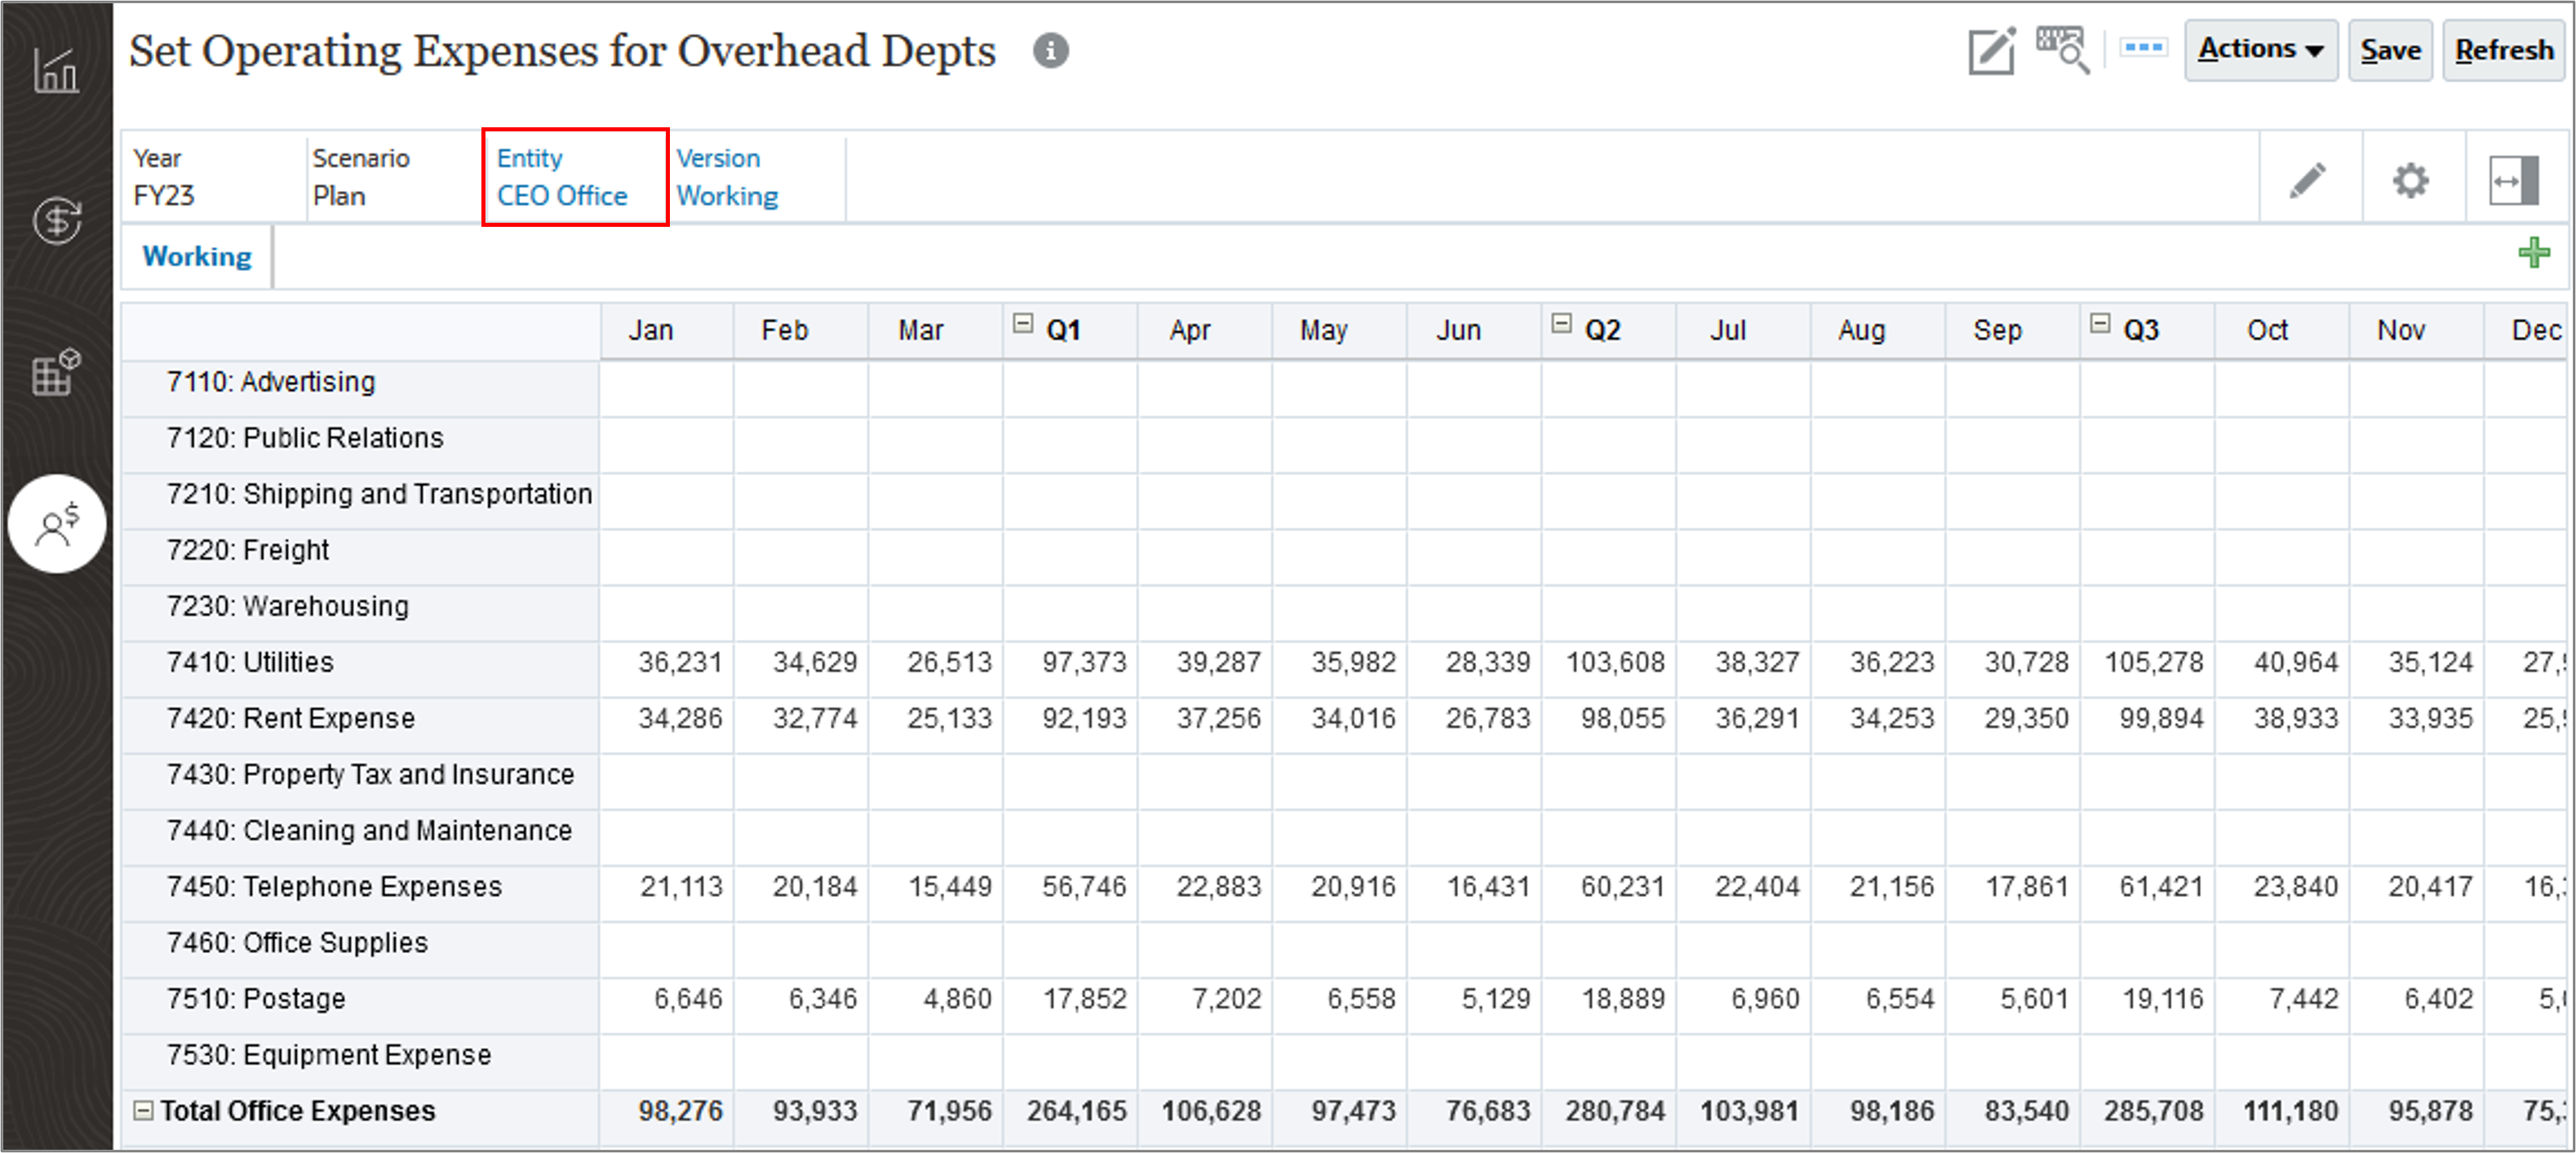
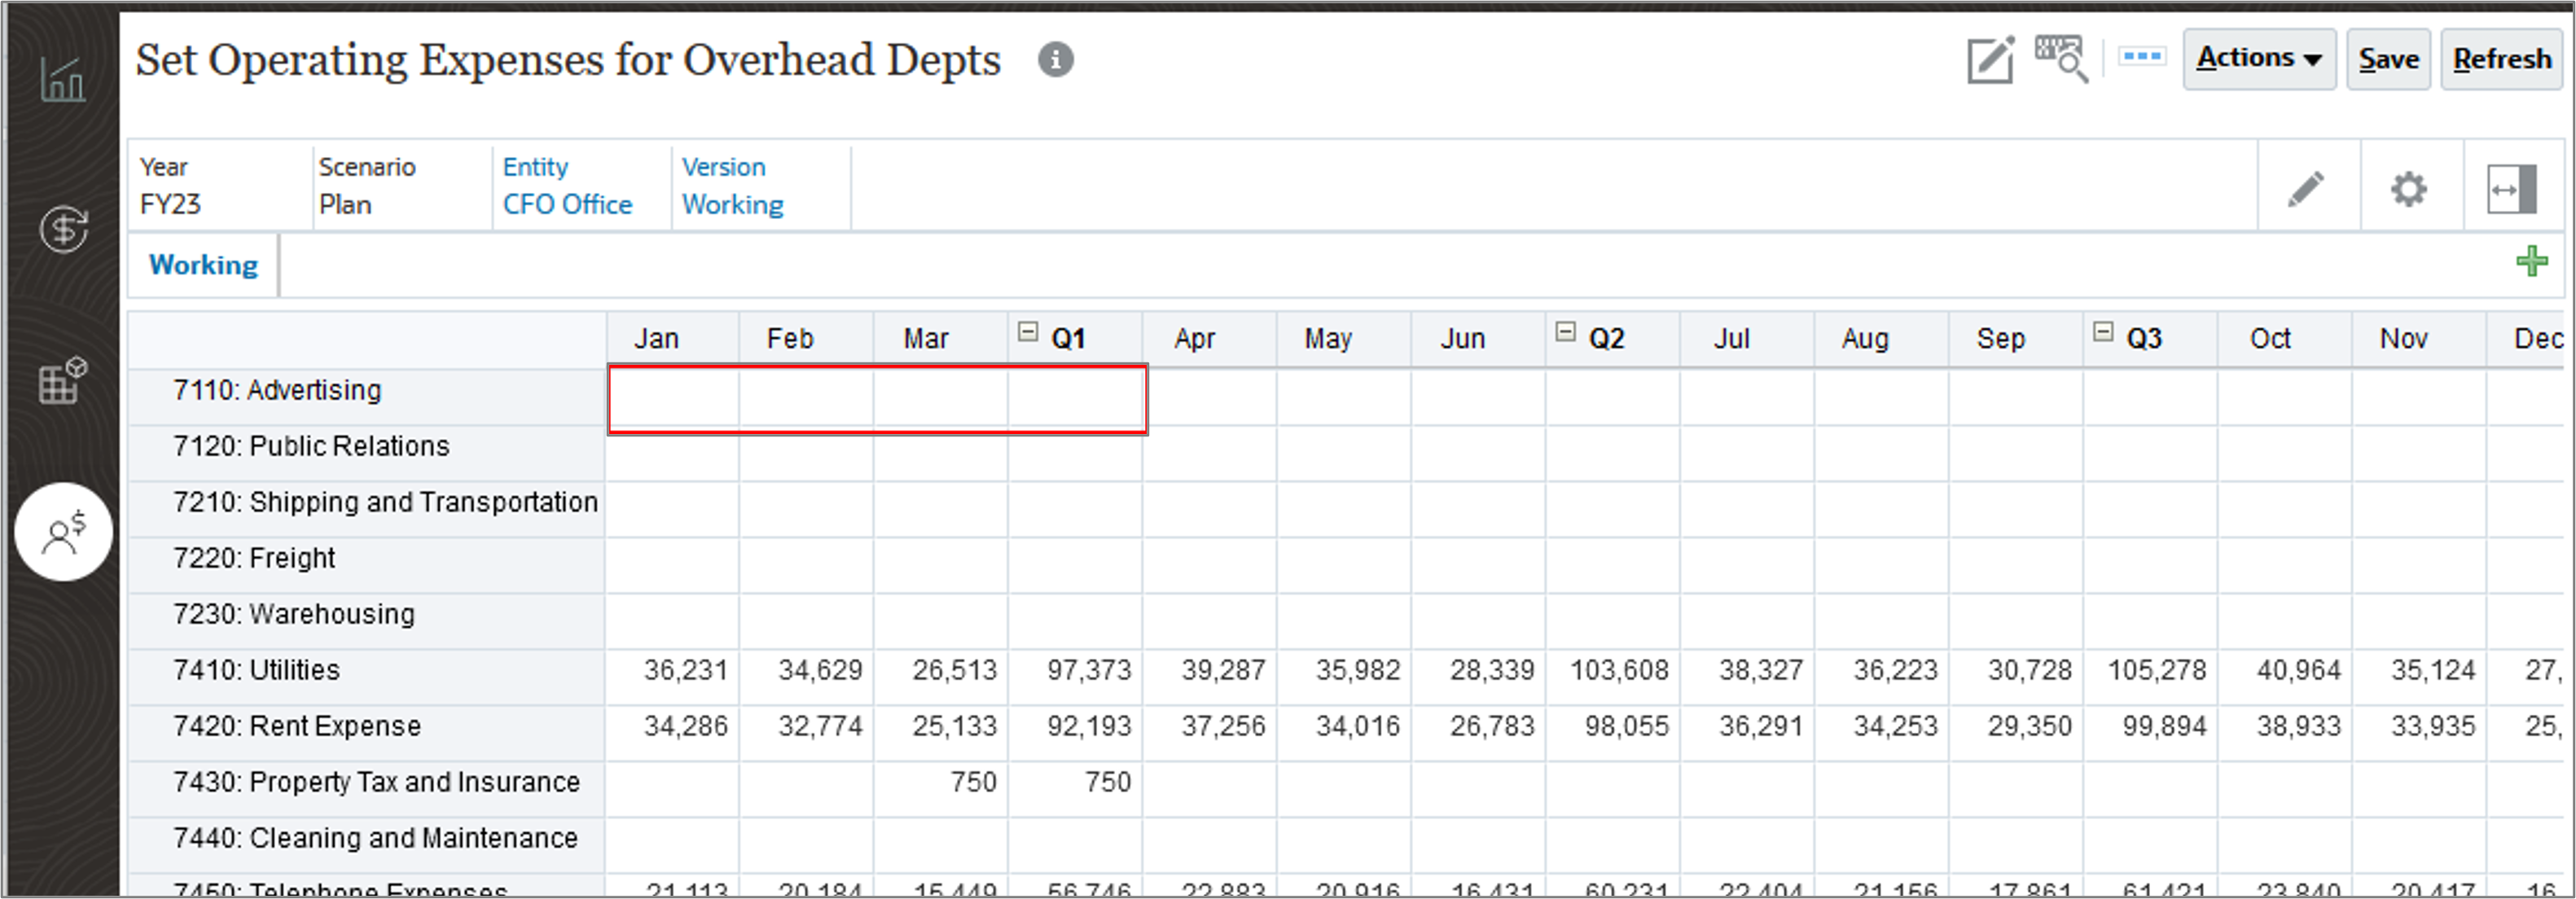
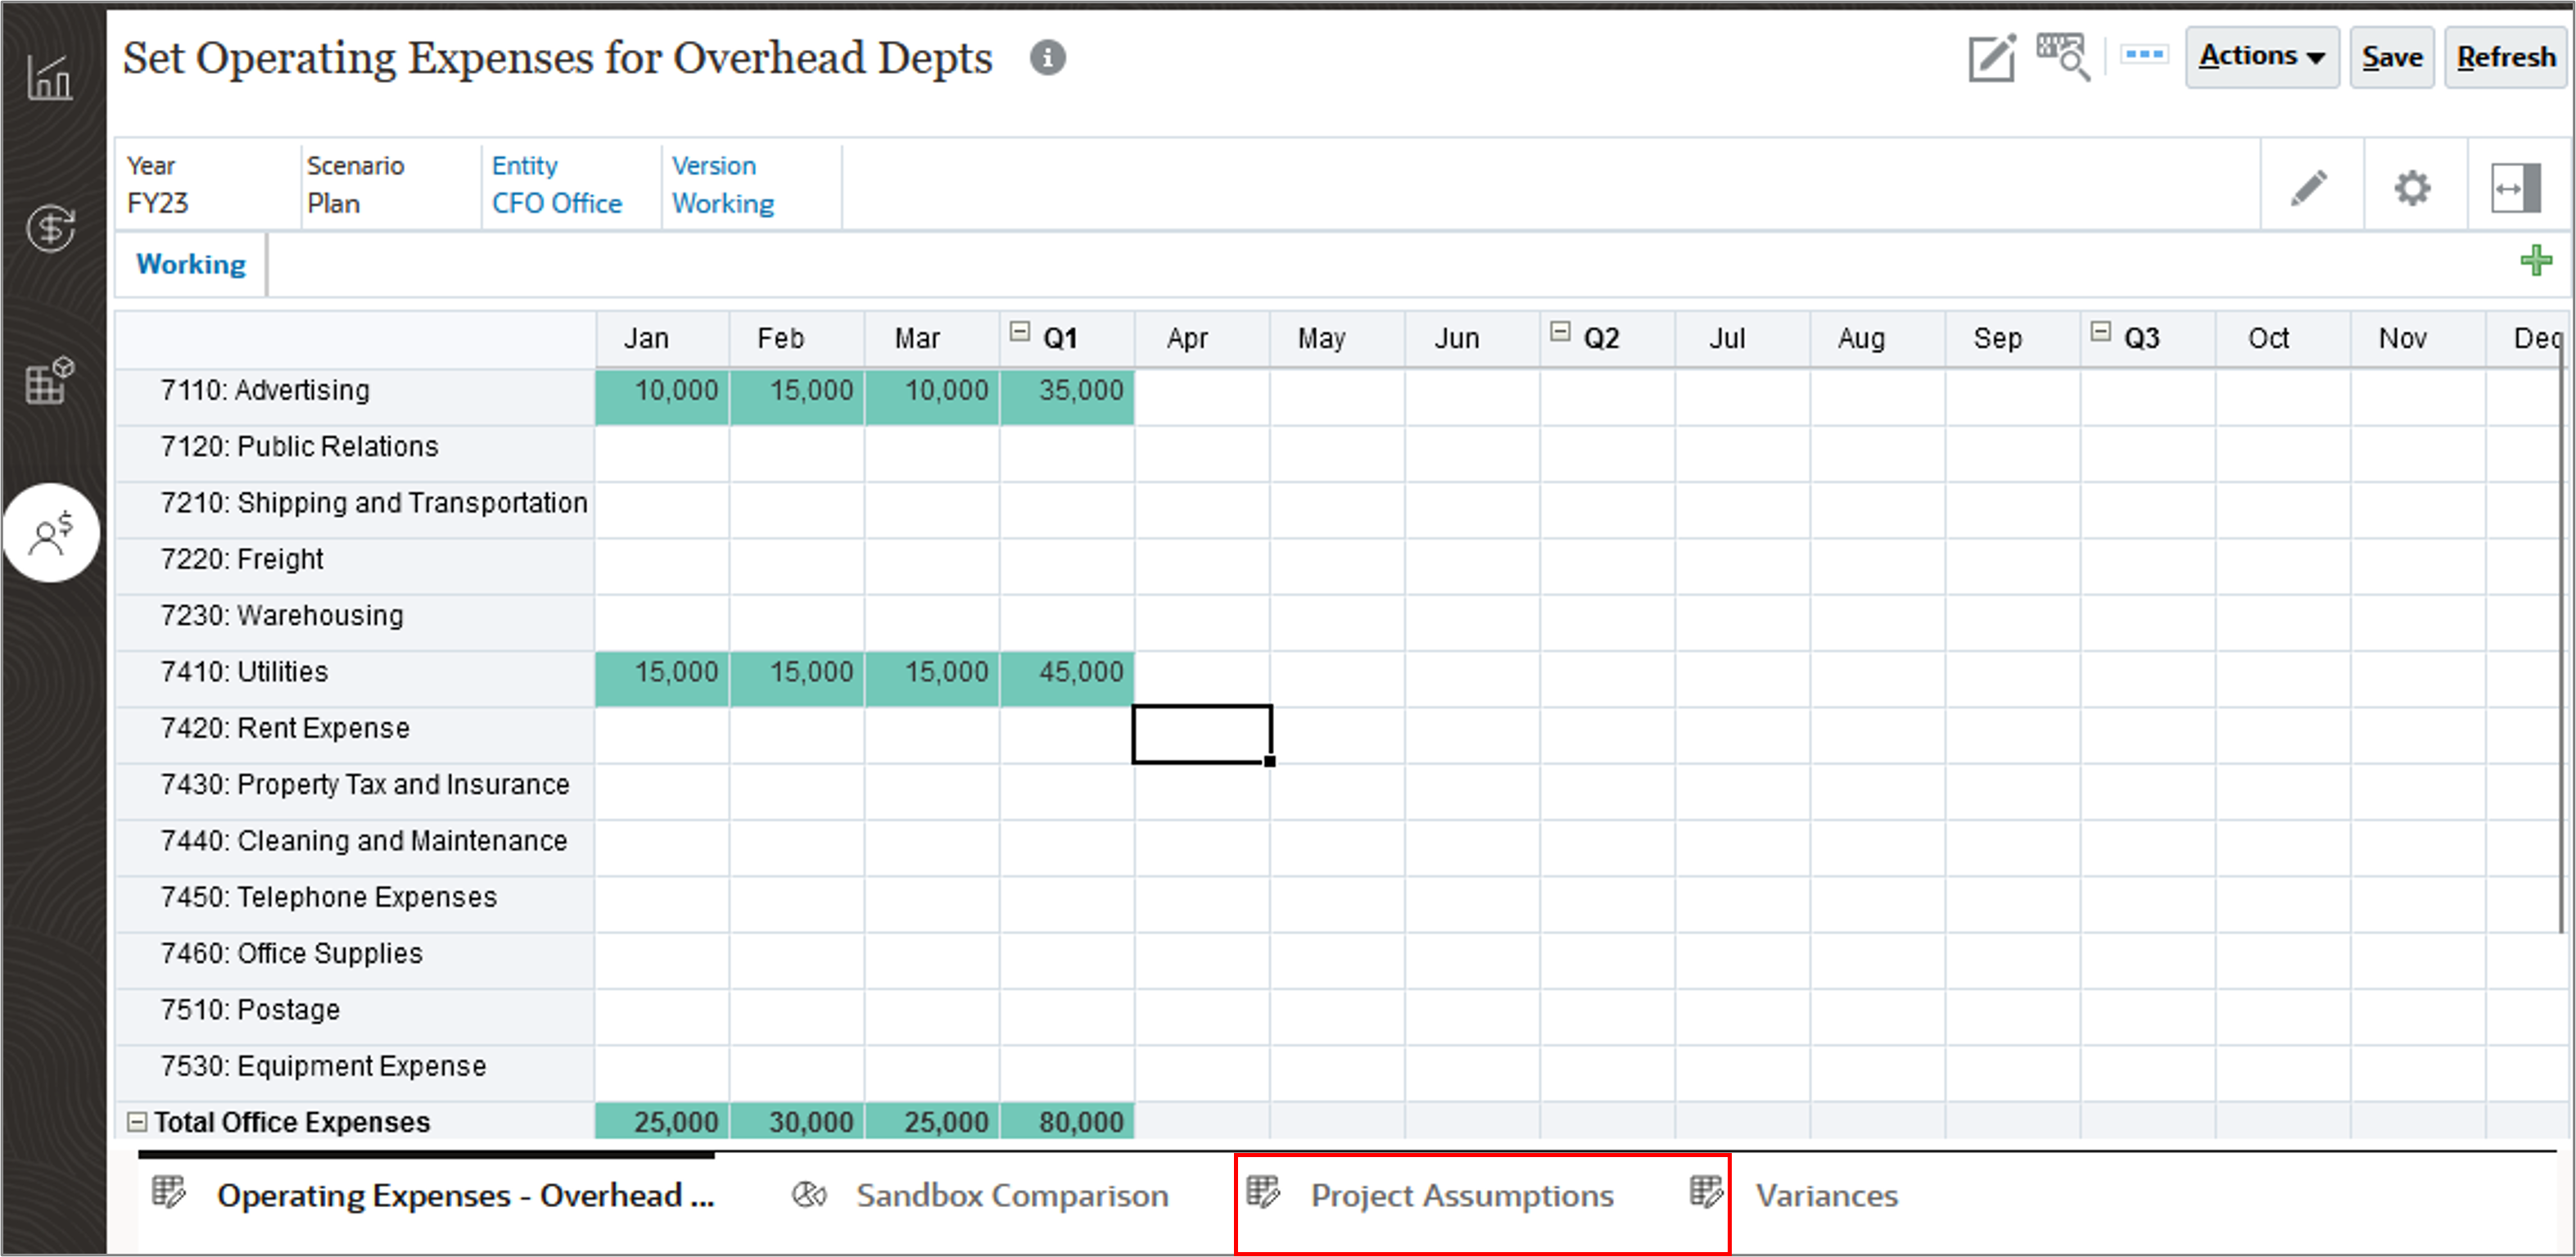
The Set Operating Expenses for Overhead Depts form is displayed.
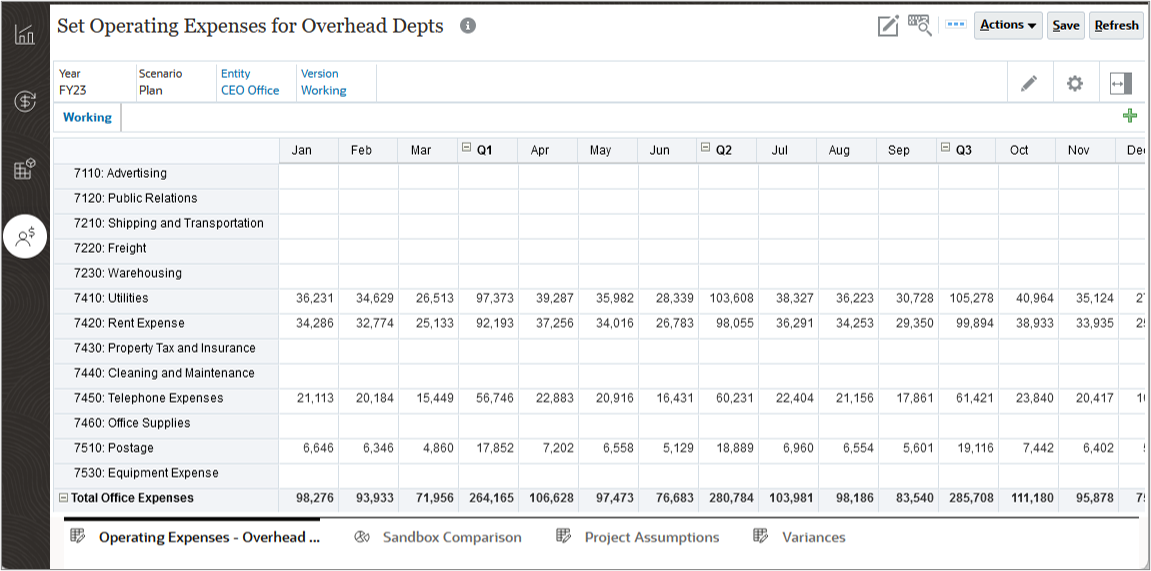
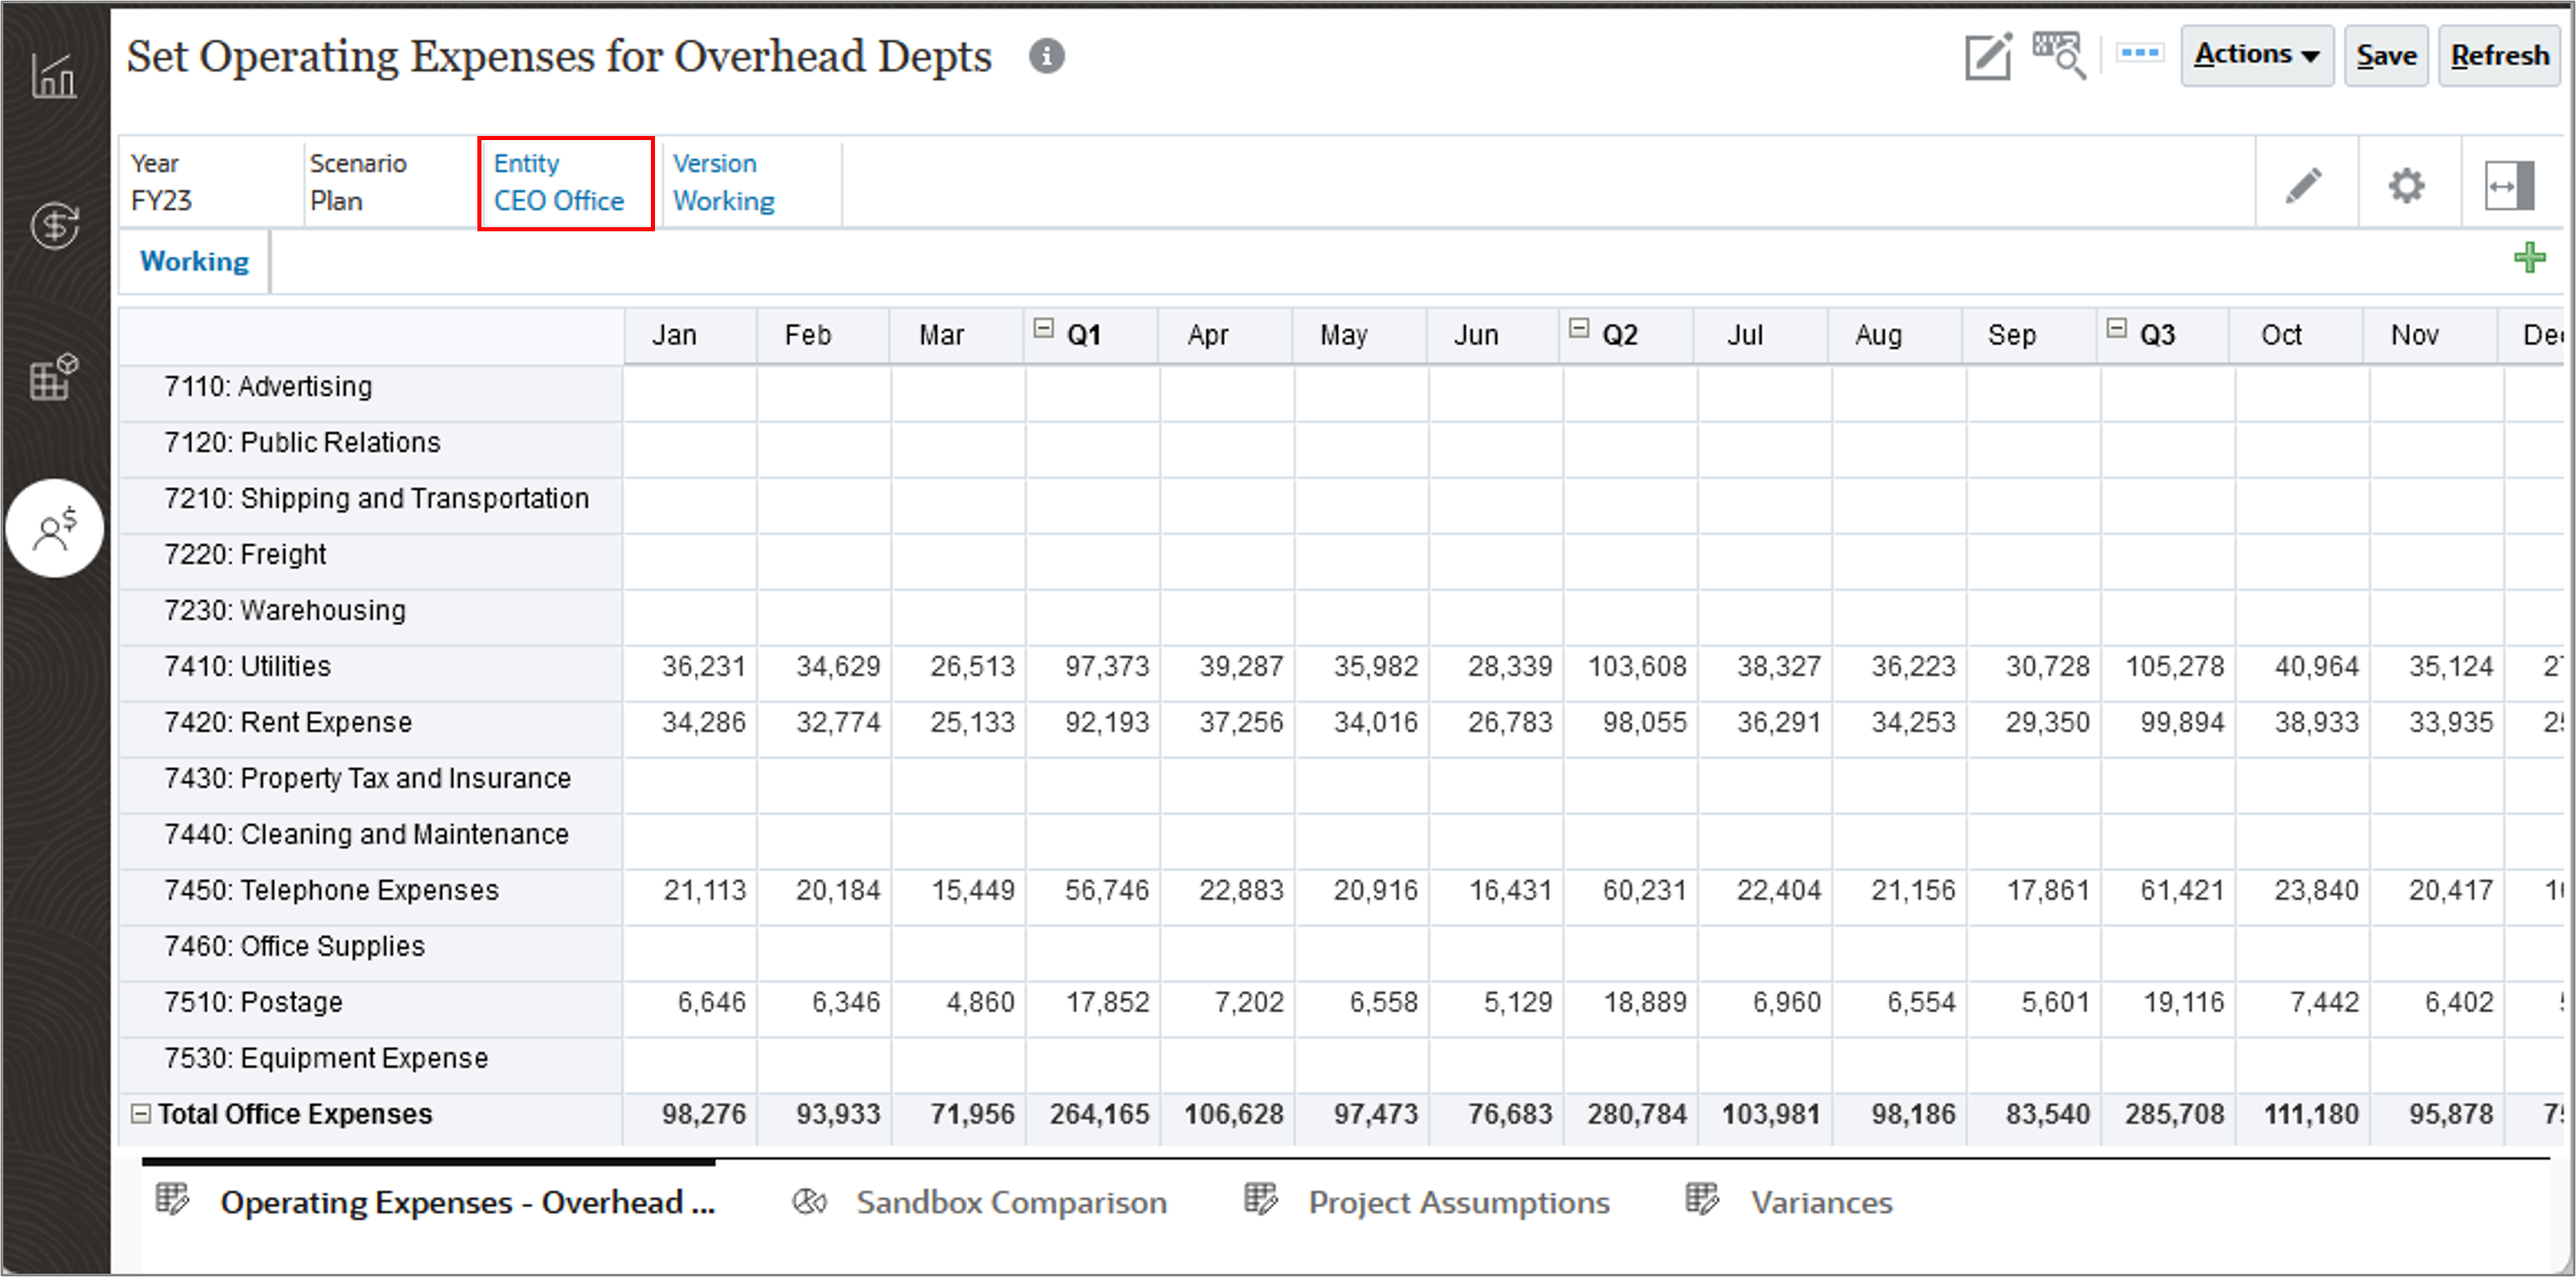
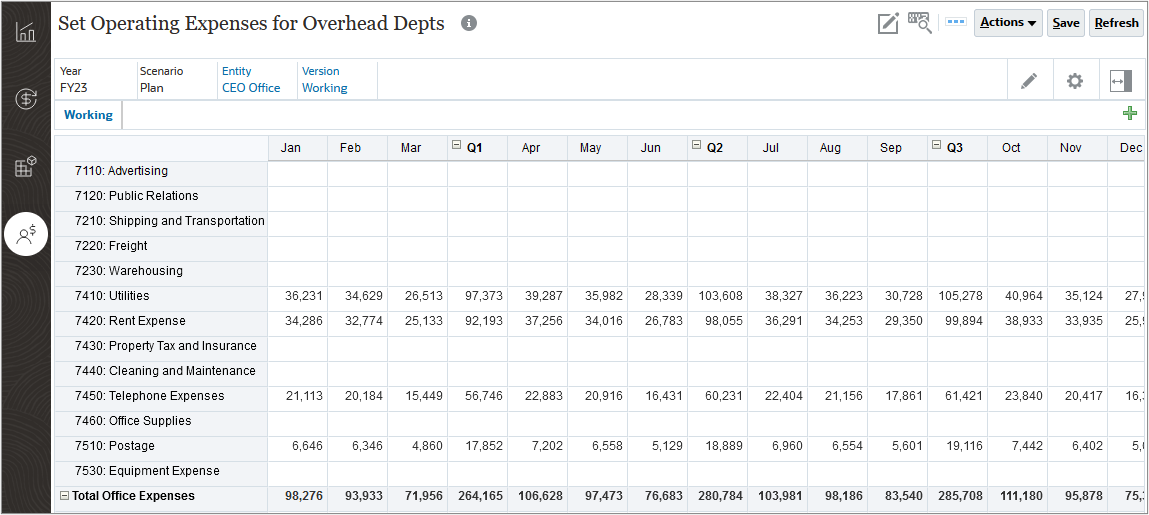
The Set Operating Expenses for Overhead Depts form is displayed with the data for CFO Office.
Expanding and Collapsing Summary Level Members on Planning Forms
You can hide the children of parent members so that you can navigate forms more easily when forms contain a large number of members in the rows and columns.
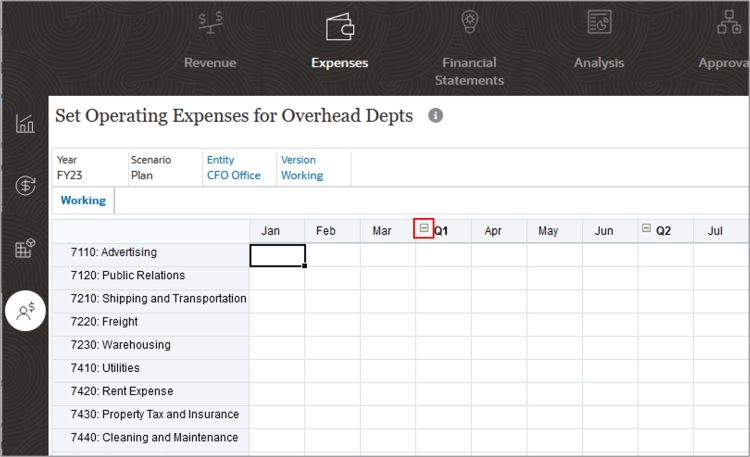
- To collapse a member such as Q1, from a form with both parent and child members displayed, click – to the left of Q1.
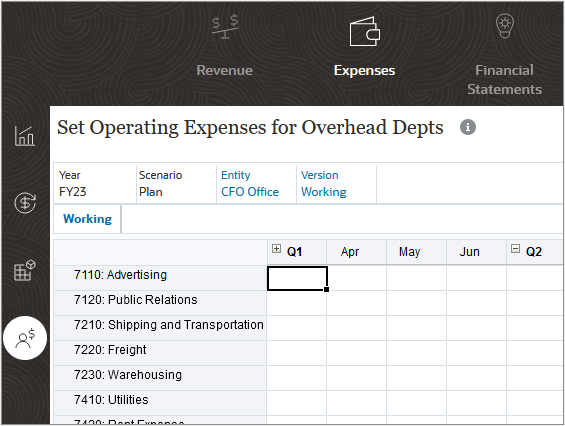
- The first quarter is collapsed and January, February, and March are no longer visible on the form.
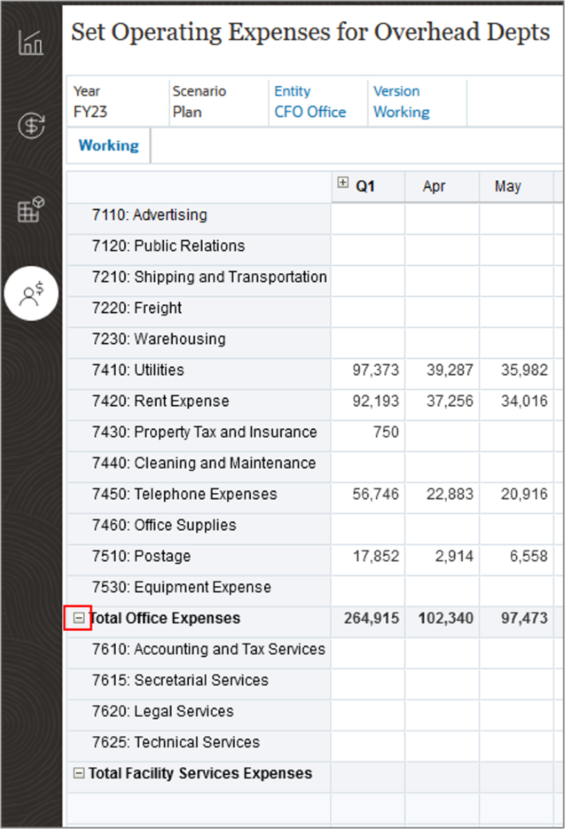
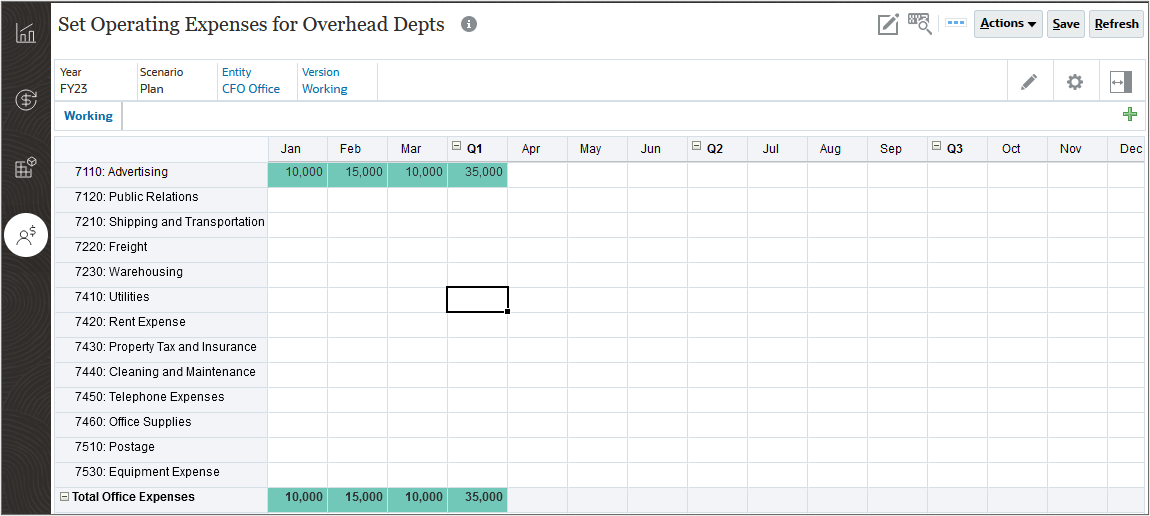
- Click - to the left of Total Office Expenses.
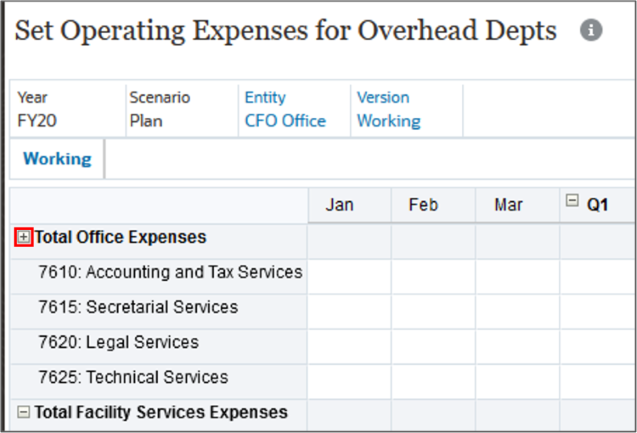
- To expand Total Office Expenses, from a form with a parent member collapsed, click + to the left of Total Office Expenses.
Navigation Keys for Planning Forms
You navigate between cells, similar to a spreadsheet. For example, press the Tab key to move the cursor to the cell on its right. Pressing Shift-Tab moves the cursor to the previous cell in the row. Pressing the Enter key moves the cursor to the cell below it. Pressing Ctrl+Home takes the cursor to the first cell in the form, while pressing Ctrl+End moves the cursor to the last cell in the form.
The following table describes navigation key options:
| Key | Result |
|---|---|
| Enter | Enters a value and moves the cursor to the cell below the current cell in the column. |
| Tab | Enters a value and moves the cursor to the next cell in the row. |
| Shift + Tab | Enters a value and moves the cursor to the previous cell in the row. |
| Shift + Enter | Moves to the previous cell in the column. |
| Up Arrow, Down Arrow | Moves up or down to the previous or next row. |
| Ctrl + Home | Moves to the first cell in the form. |
| Ctrl + End | Moves to the last cell in the form. |
| Ctrl + Left Arrow | Moves to the first cell in the current row. |
| Ctrl + Right Arrow | Moves to the last cell in the current row. |
| Shift+ End | Moves to the last cell of the first row. |
| Ctrl + A | Selects all cells. |
| Shift + Space | Selects the row. |
| Ctrl + Space | Selects the column. |
| Ctrl + Alt + E | Moves out of the form to the previously selected item. Use Tab to return to the form. |
| Esc | Discards the current changes in the cell, restoring the previous state. |
Action Menus on Planning Forms
Administrators can create right-click (or action) menus and associate them with forms, enabling users to click rows or columns in forms and select menu items to:
- Launch a business rule with or without runtime prompts
- Move to another form
- Move to Manage Approvals with a predefined scenario and version
- Copy Version
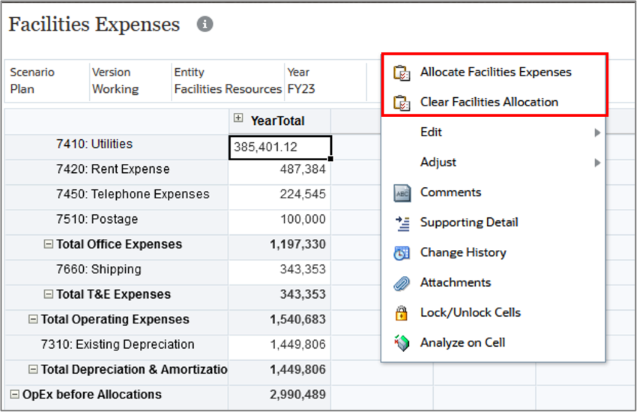
In the example, after right clicking a member on the form, the Action menu is displayed where you can select either the Allocate Facilities Expenses or Clear Facilities Allocation business rule to run it.
Distinguishing Form Data with Visual Cues in Planning
In this section, you learn about visual cues that distinguish types of data. Planning forms use colors to indicate cell conditions.
- White means that you can enter data in these cells.
- Yellow cells indicate that you have changed values but haven't yet saved them. We call these dirty cells.
- Gray cells indicate that you can see, but not change, their values. They are read-only.
- Locked cells are also grayed out with a lock icon.
- Teal cells have supporting detail.
- Cells with validation rules may also change colors depending on what color was selected when the rule was defined.
Visual Cues Overview
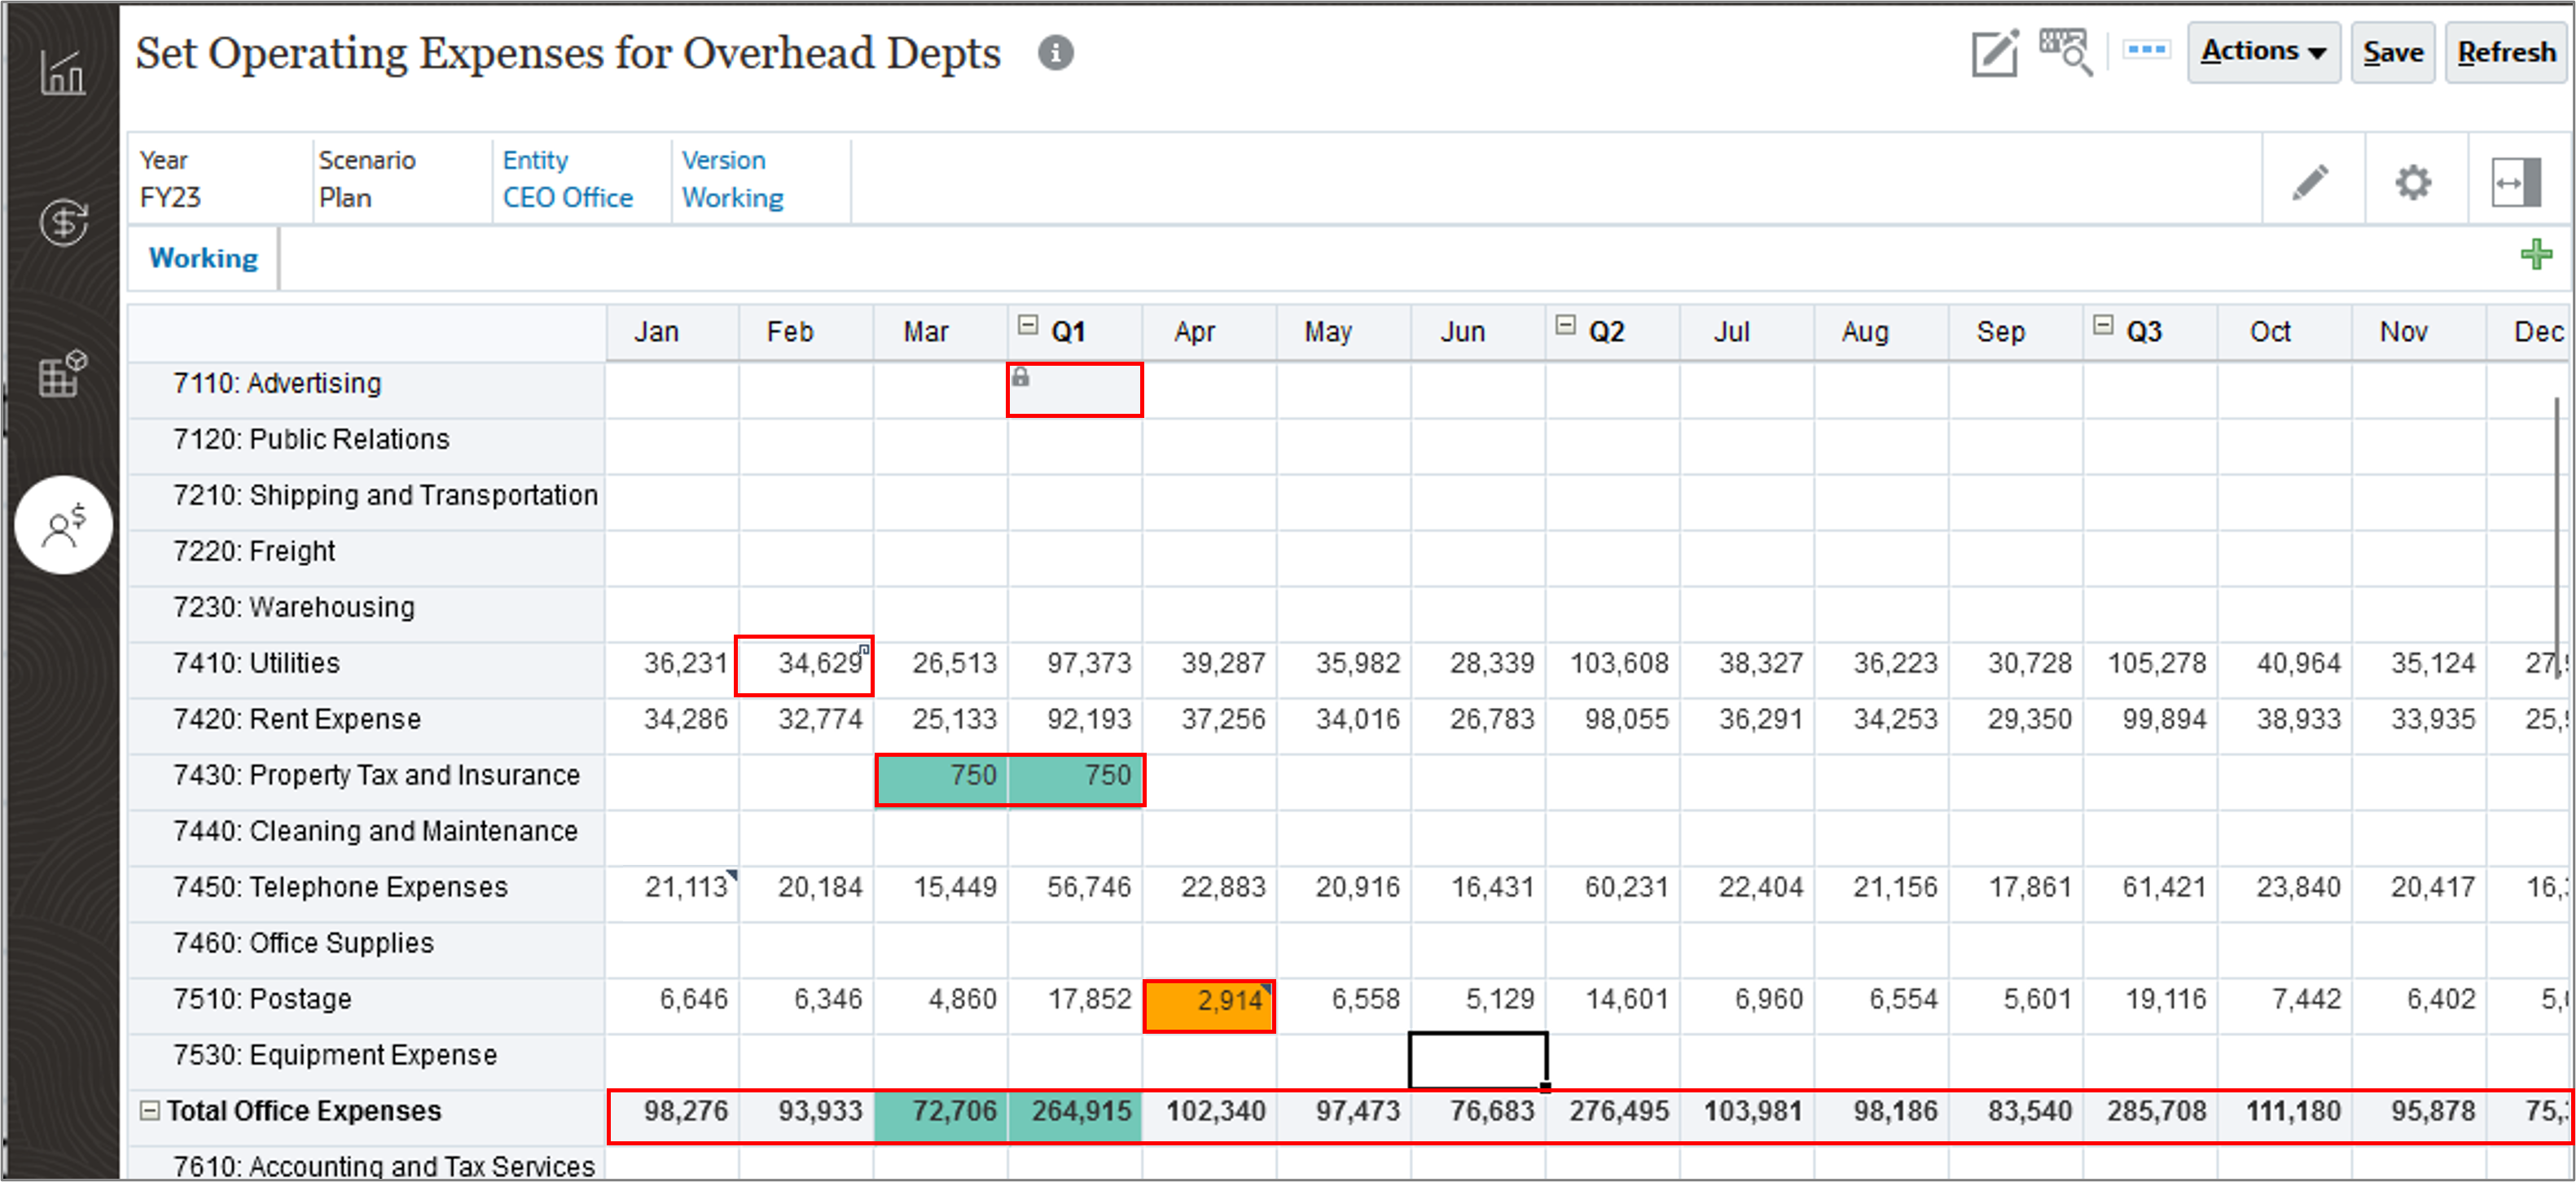
In this example, notice the following visual cues:
- Advertising for Q1 is locked. There is a padlock icon in the Q1 cell.
- Feb Utilities has an attachment and an icon representing an attachment is displayed.
- Mar Property Tax and Insurance has supporting detail which is indicated with a Teal color.
- Jan Telephone Expenses has a comment indicated by an icon in the upper right corner of the cell.
- Apr Postage has met the criteria for a data validation rule so the color was changed to orange.
- Total Office Expenses for all periods is read-only. Those cells are gray.
Viewing Member Formulas on Planning Forms
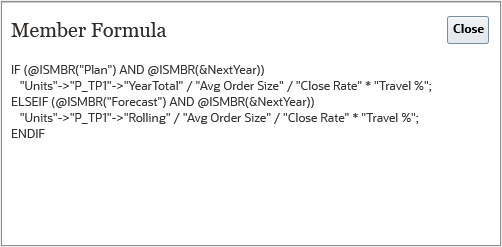
You can include a visual indicator for members that include a member formula. You can click the formula icon.
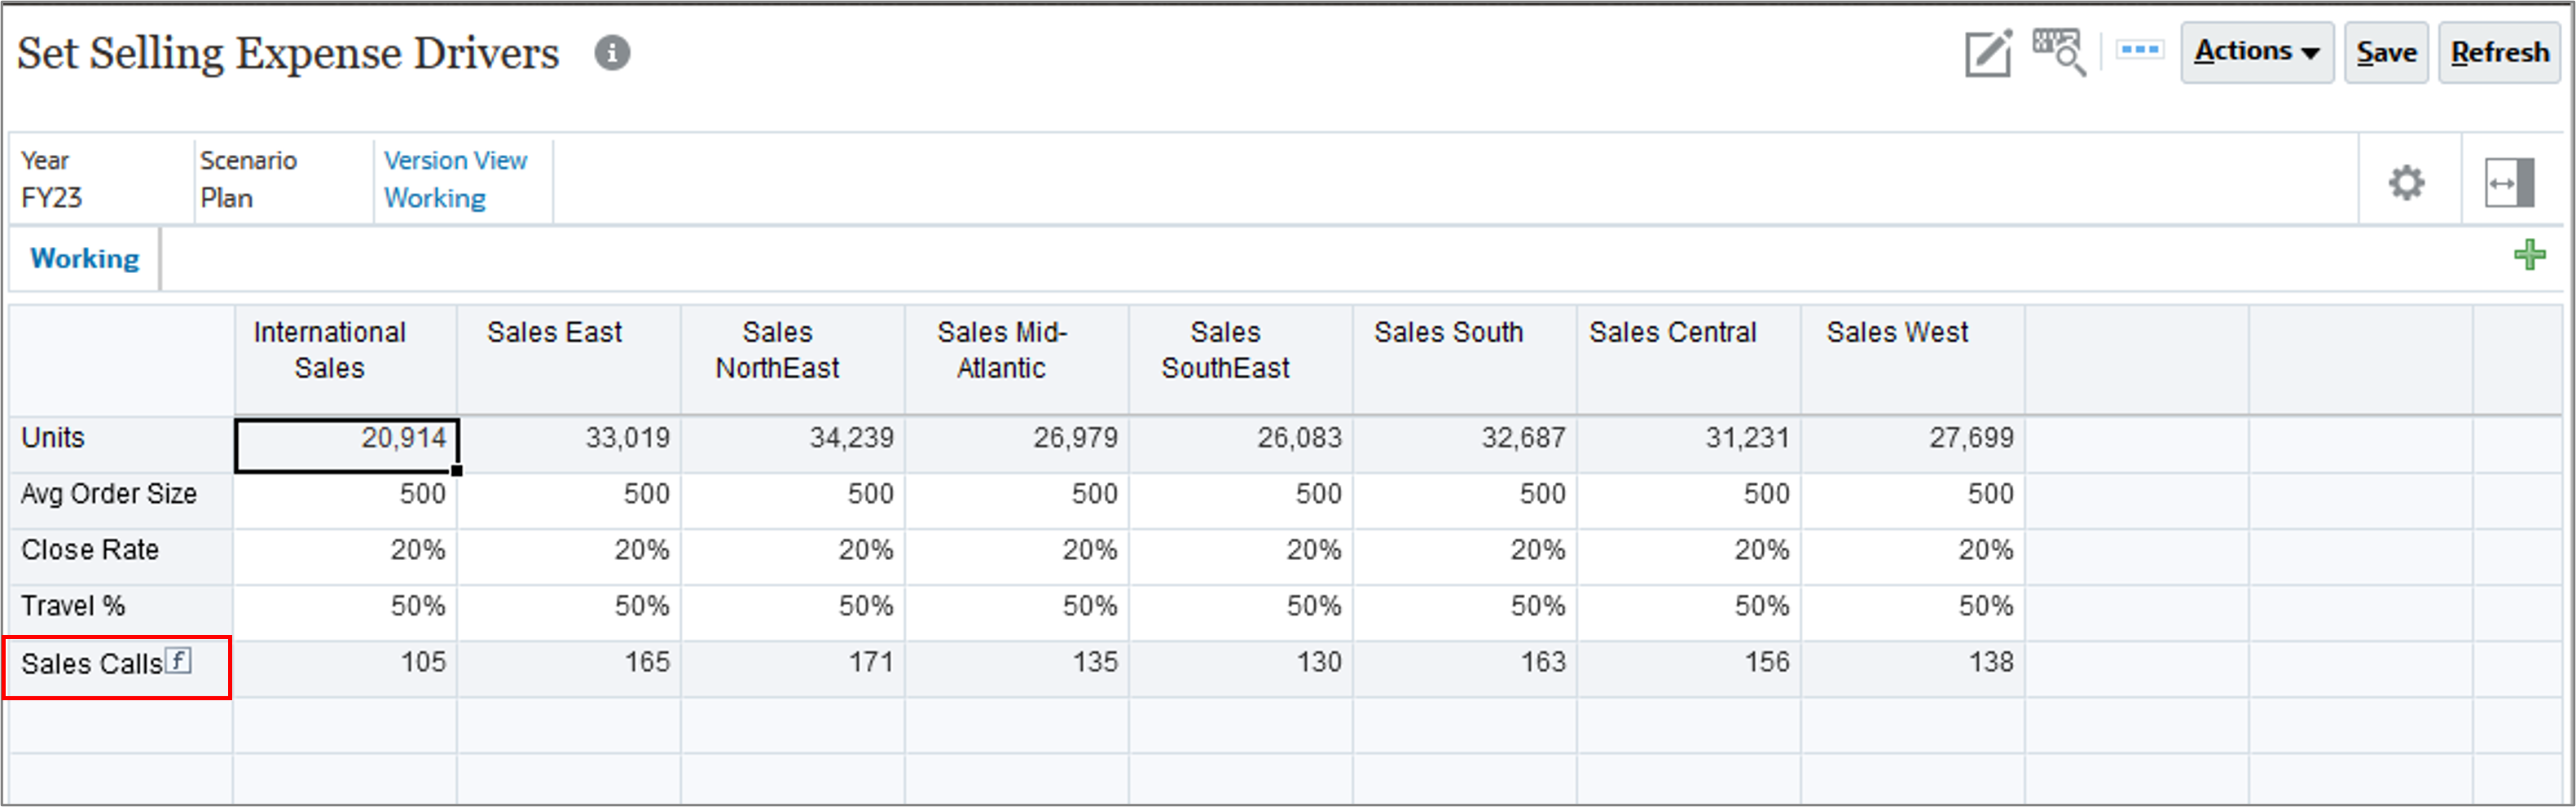
The member formula is displayed.
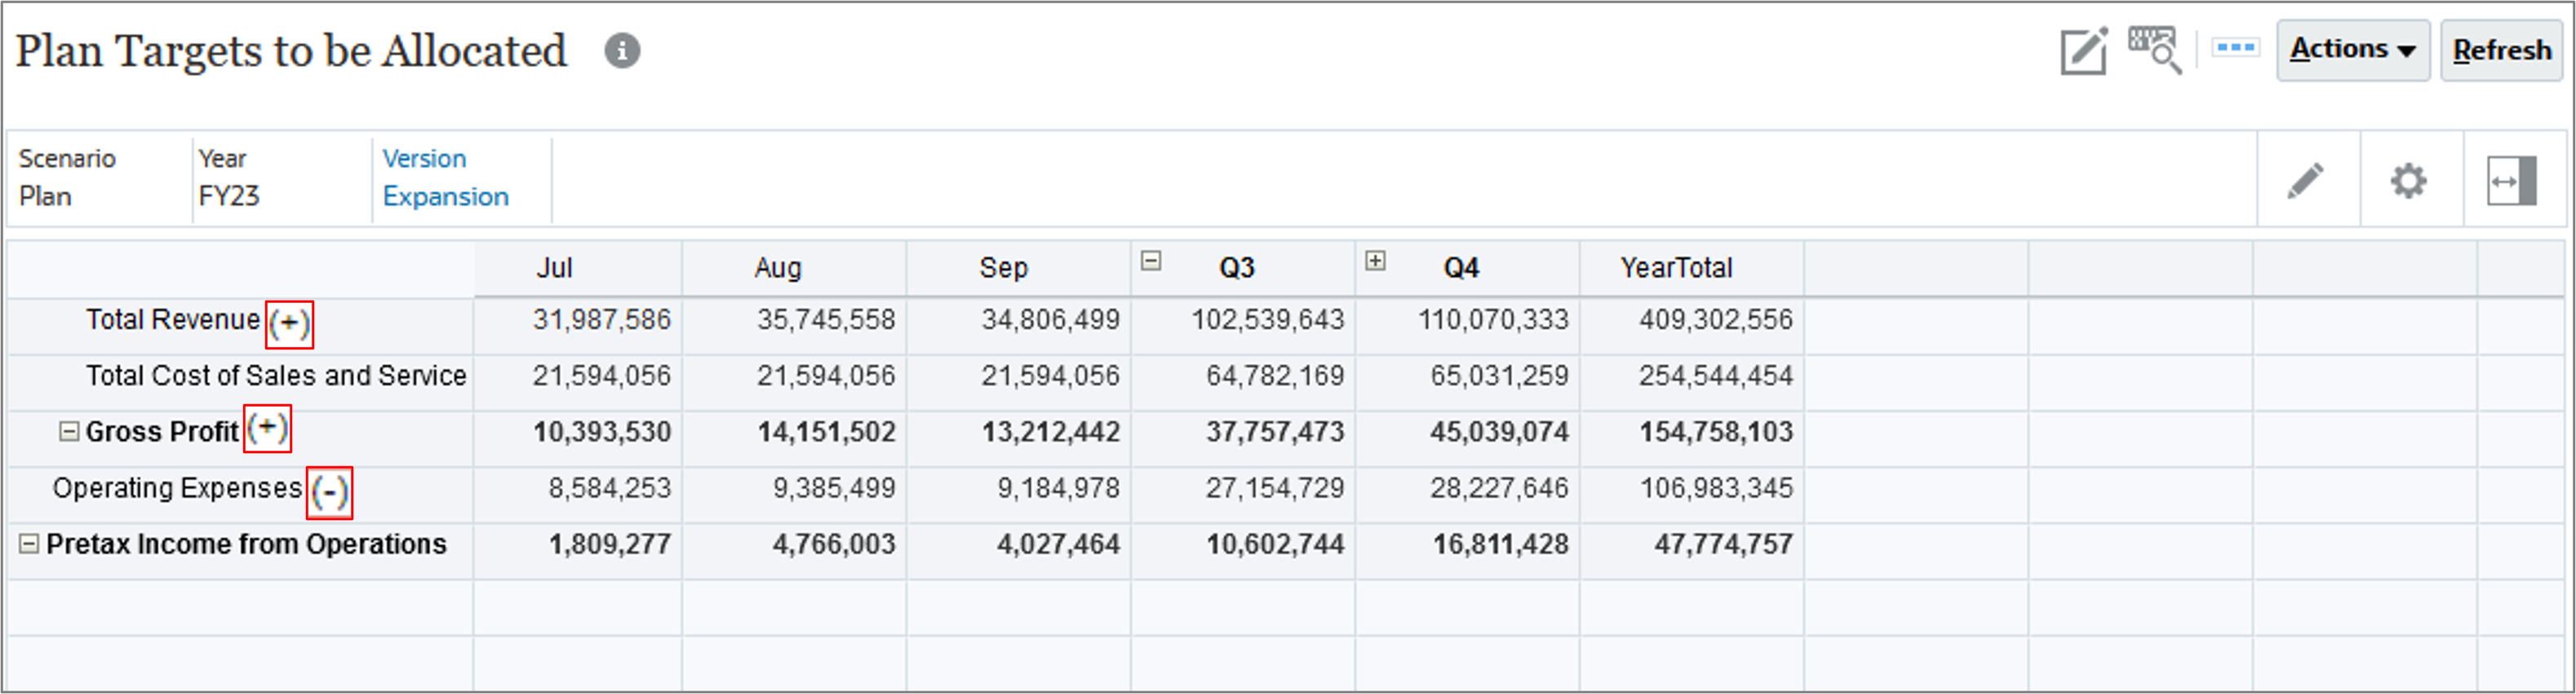
Viewing Consolidation Operators on Planning Forms
Consolidation operators are shown on forms if included in the form design.
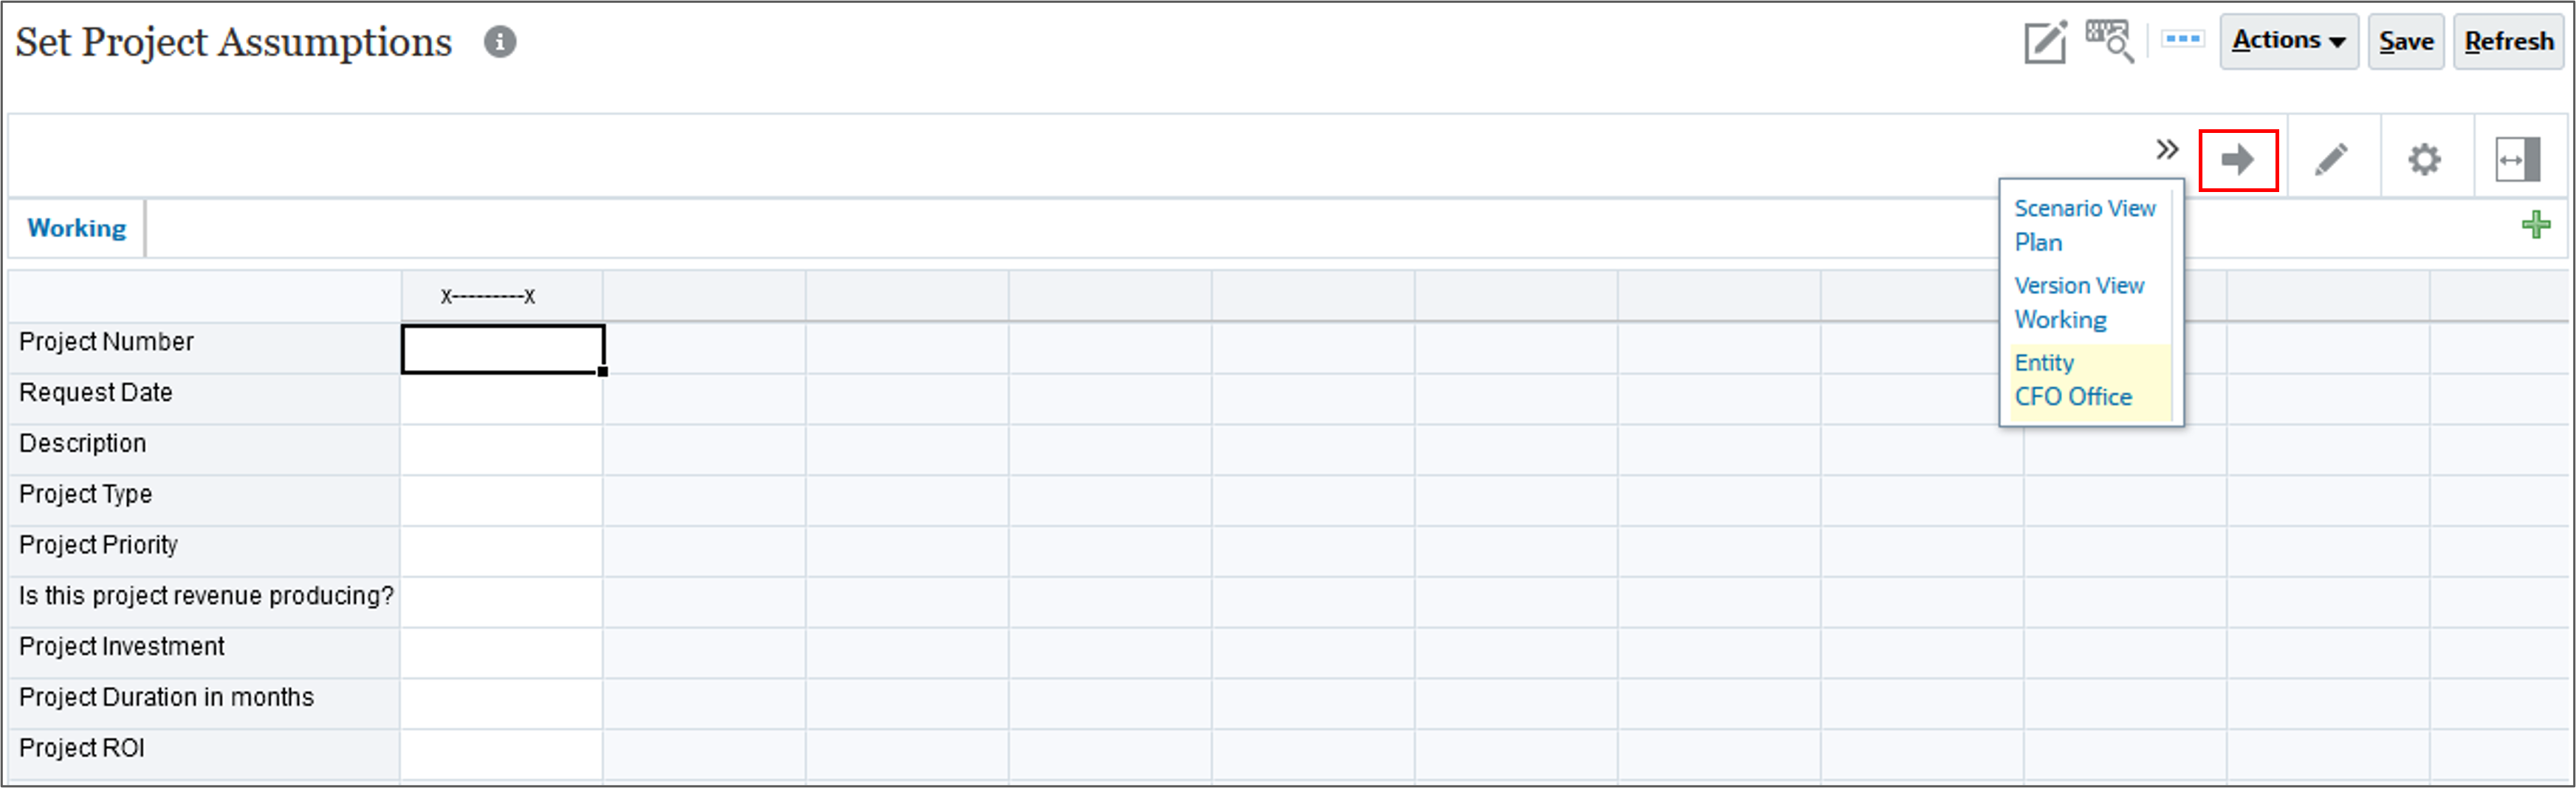
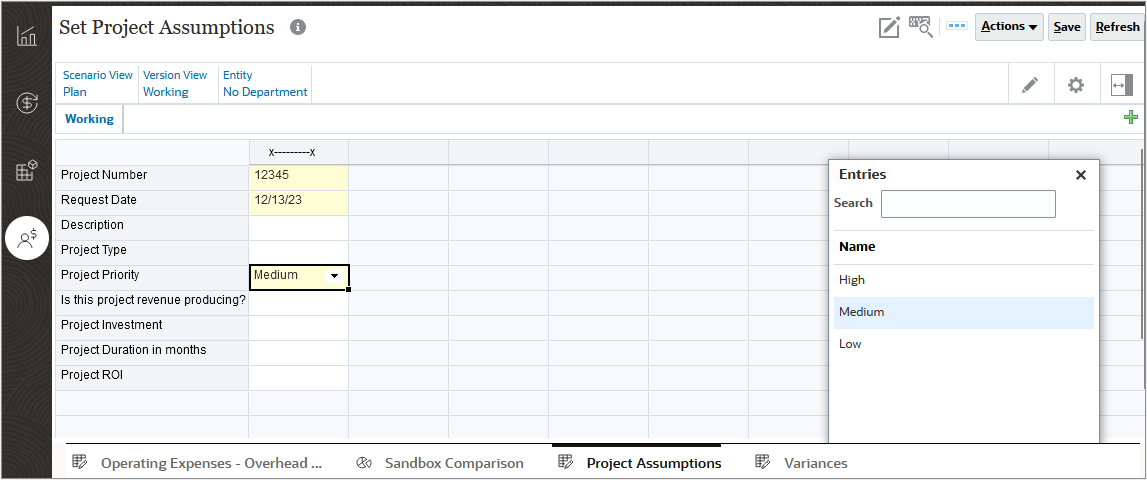
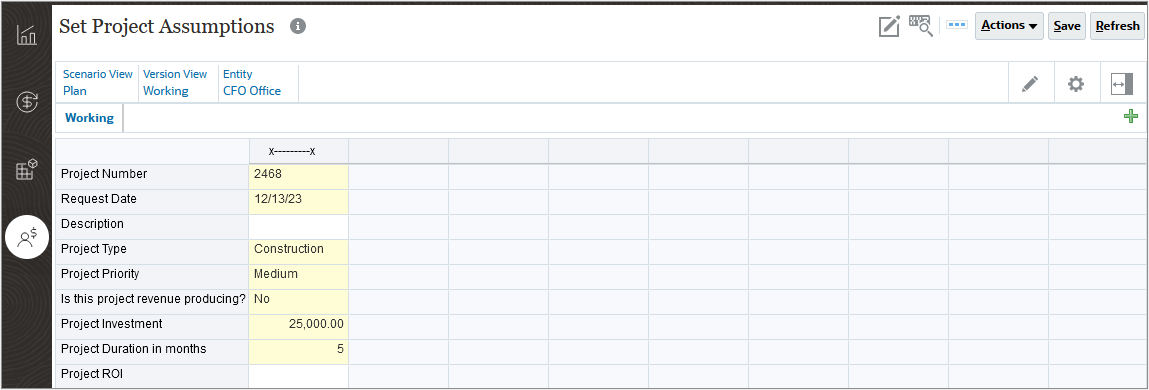
Identifying Date Fields and Smart Lists on Planning Forms
For a date field, you can either enter a date or click on the calendar and select a date. For some fields, you can select an option from a predefined Smart List.
In this example, you can enter a date in Request Date, and you can select a project priority from the choices of High, Medium, or Low.
Entering Different Types of Data in Planning
In this section, you learn about entering data in level zero and summary time periods. You enter numeric data, Smart List data, percentage data and text data. For simple forms, you can use shortcuts to enter numeric data.
Entering Numeric Data in Planning
- From the Home page, click Financial Plan and then Expenses.
- You should be on the fourth tab, Other Expenses.
- If the POV is not set to CFO Office, then perform steps 4 through 7. Otherwise, skip to step 8.
- Click Entity.
- Select CFO Office.
- Click OK.
- To the right of the POV bar, click (Go) .
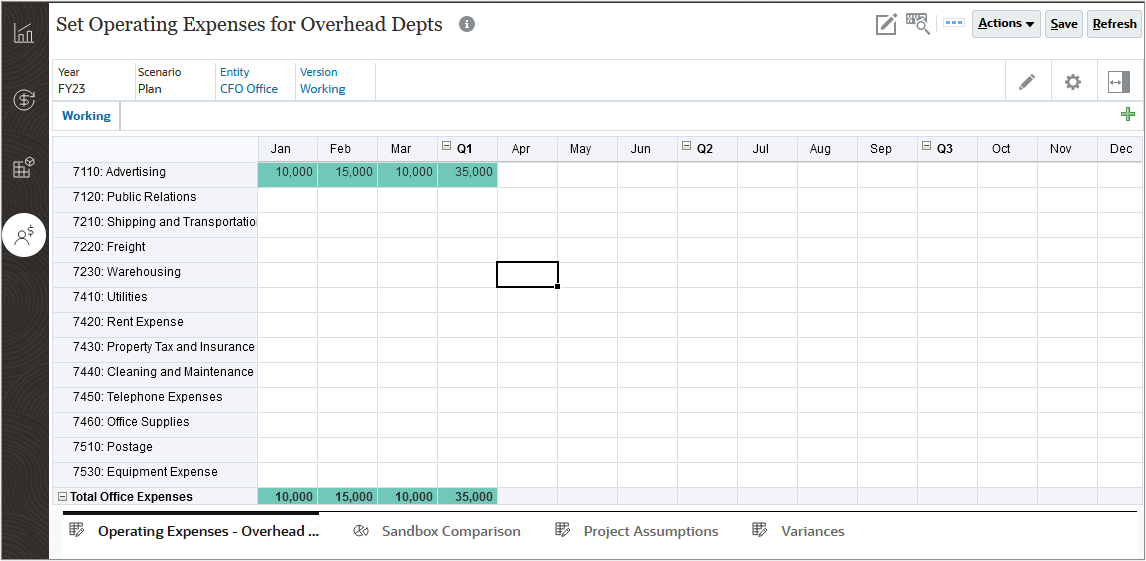
- For Advertising, in Jan, and Mar enter 10000. In Feb enter 15000.
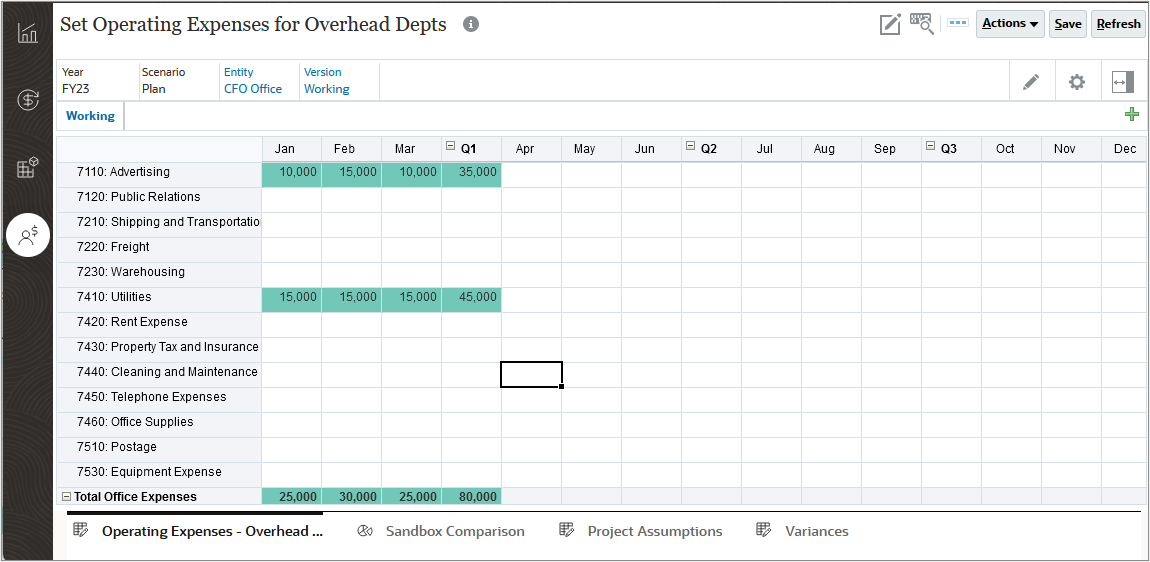
- For Utilities, in Q1, enter 45000.
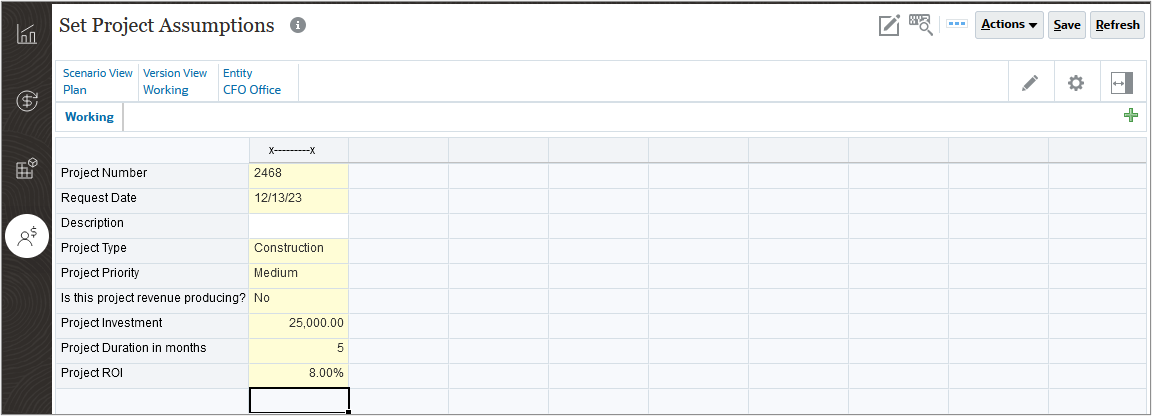
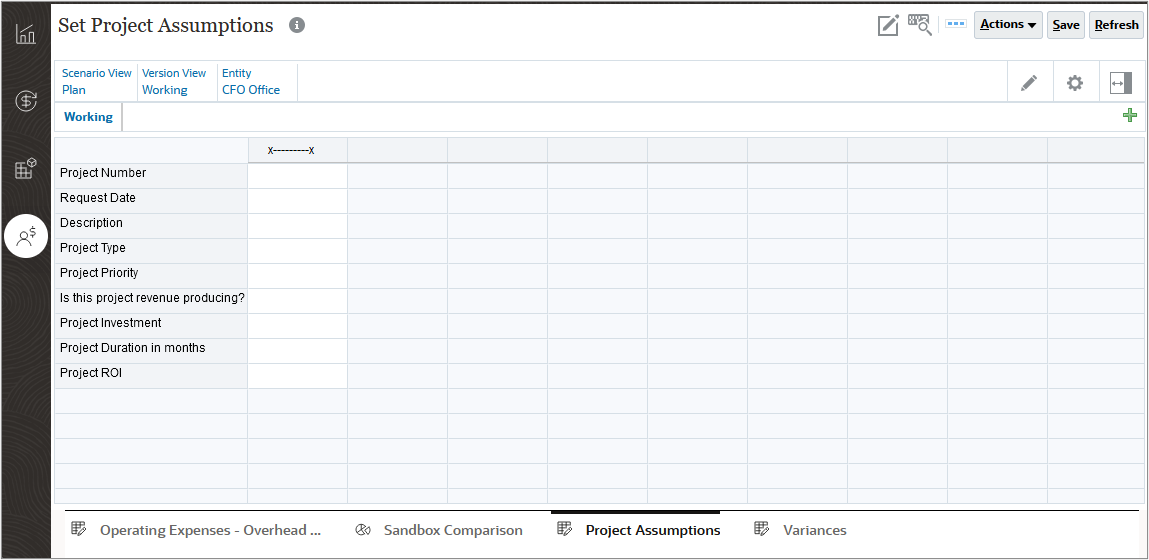
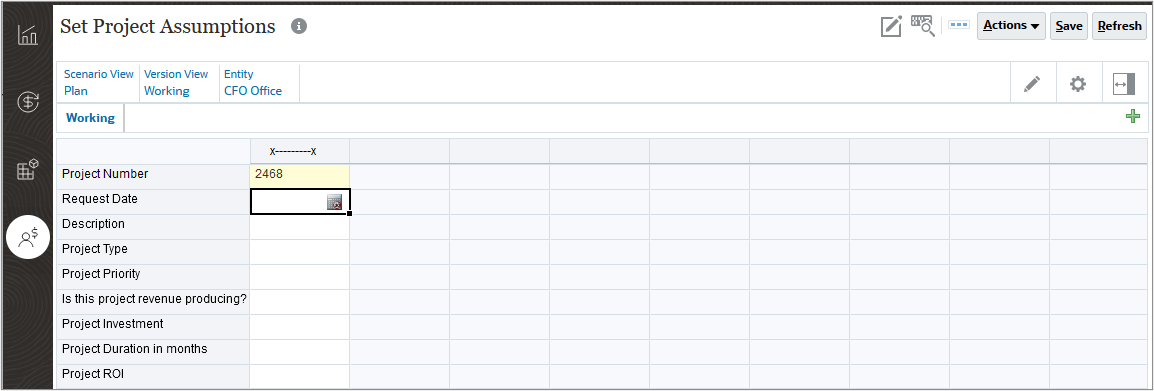
- On the Expenses card, on the Other Expenses vertical tab, select the Project Assumptions horizontal tab.
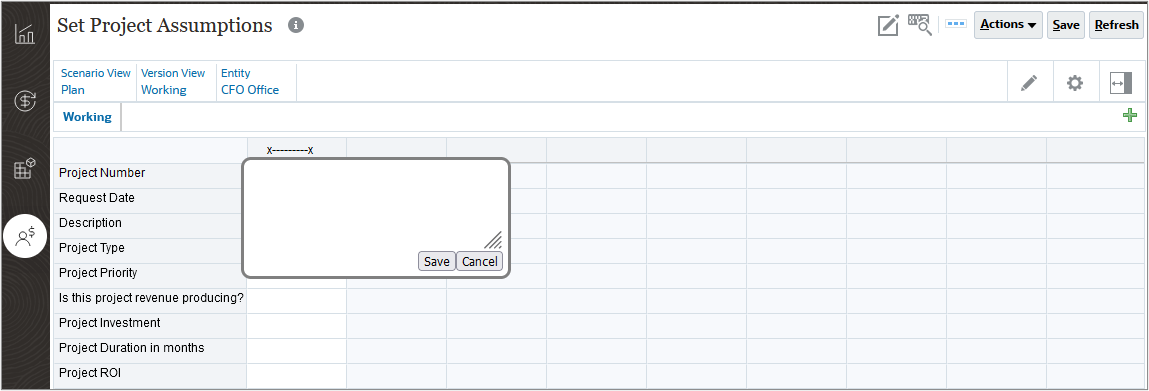
- Ensure the POV has the following members selected: Plan, Working, CFO Office, and click in Project Number.
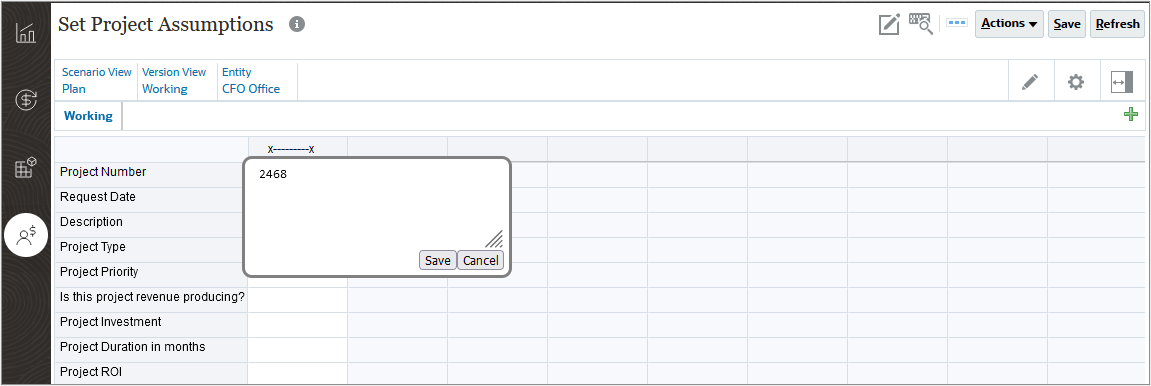
- In the Project Number dialog, enter 2468.
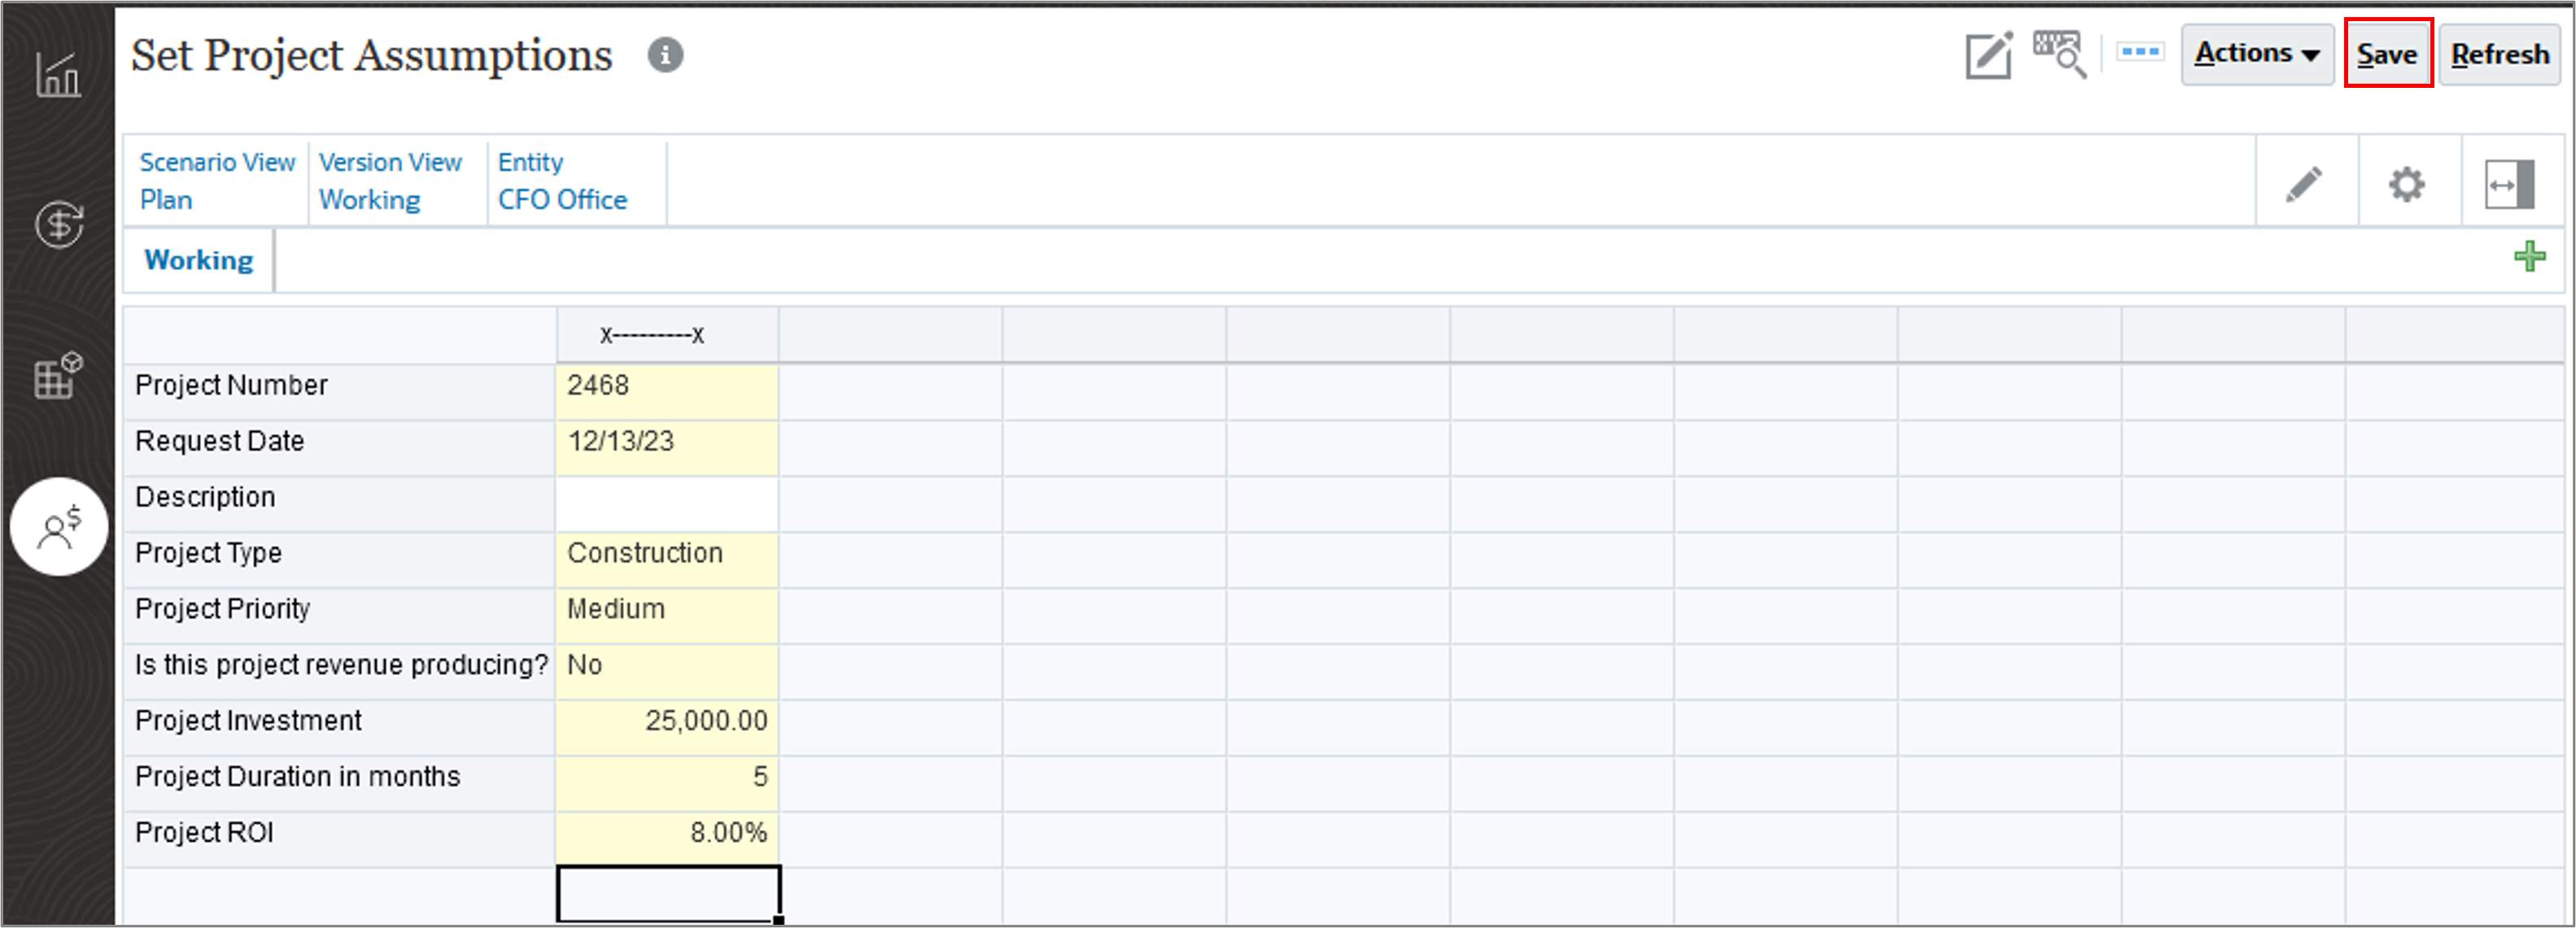
- Click Save.
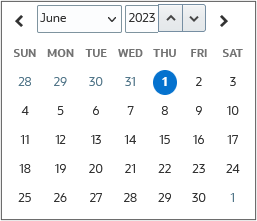
- For Request Date, click the calendar.
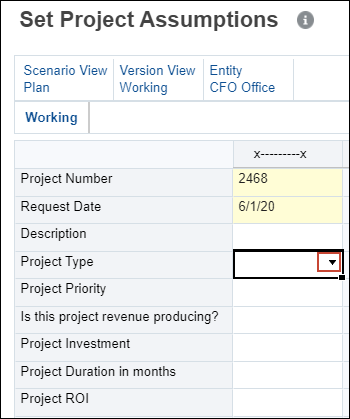
- Select June 1.
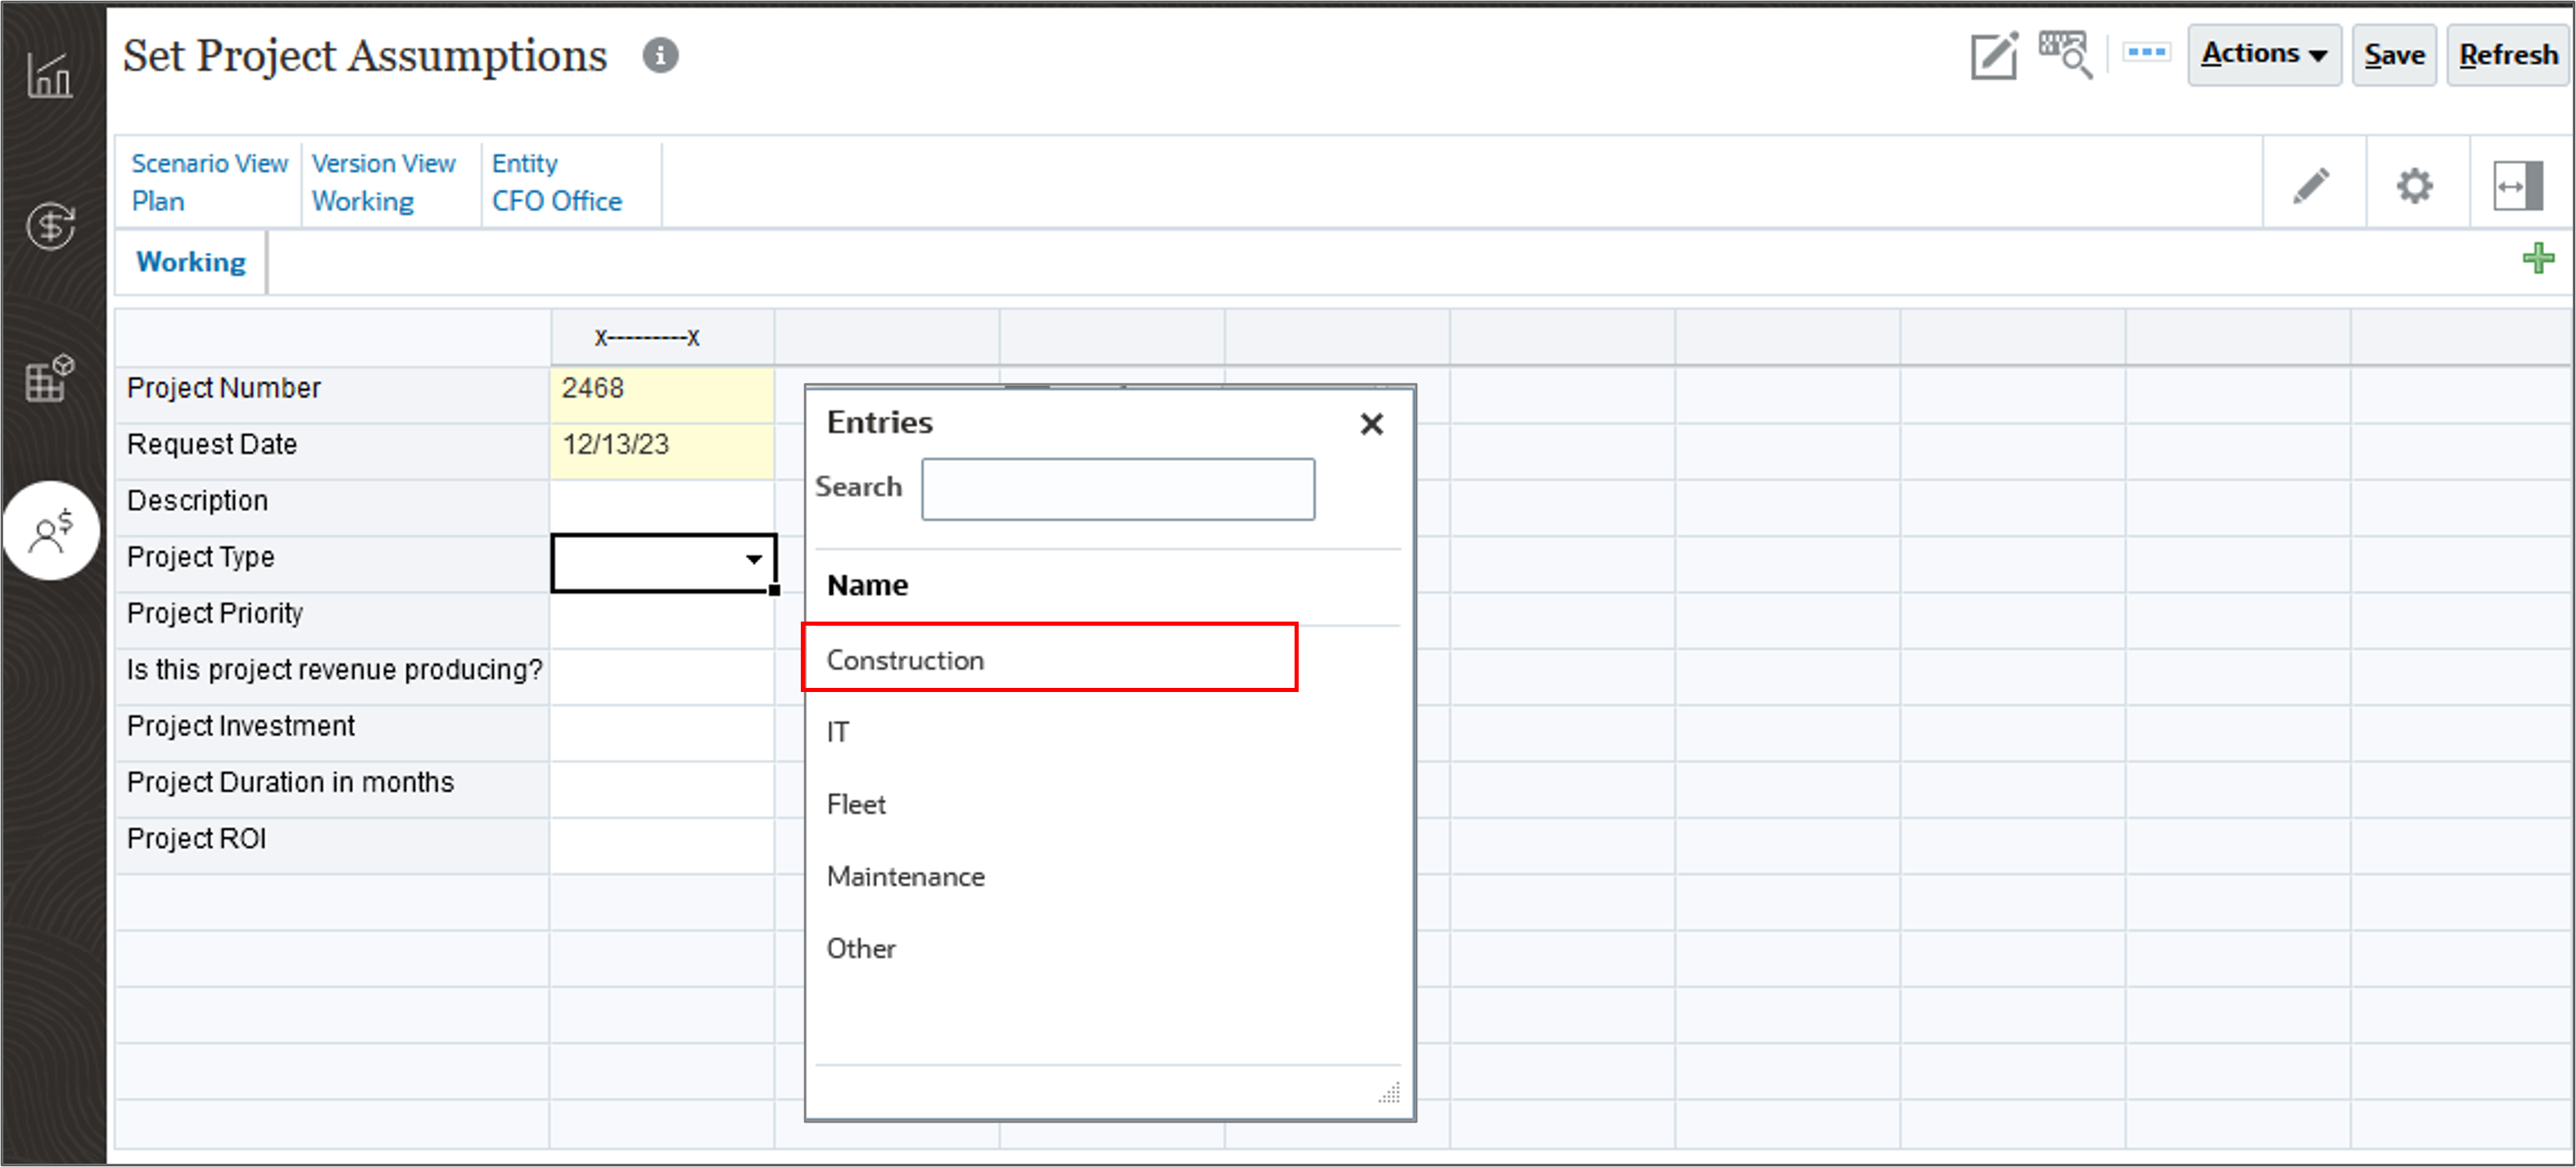
- For Project Type, click the down arrow .
- Select Construction.
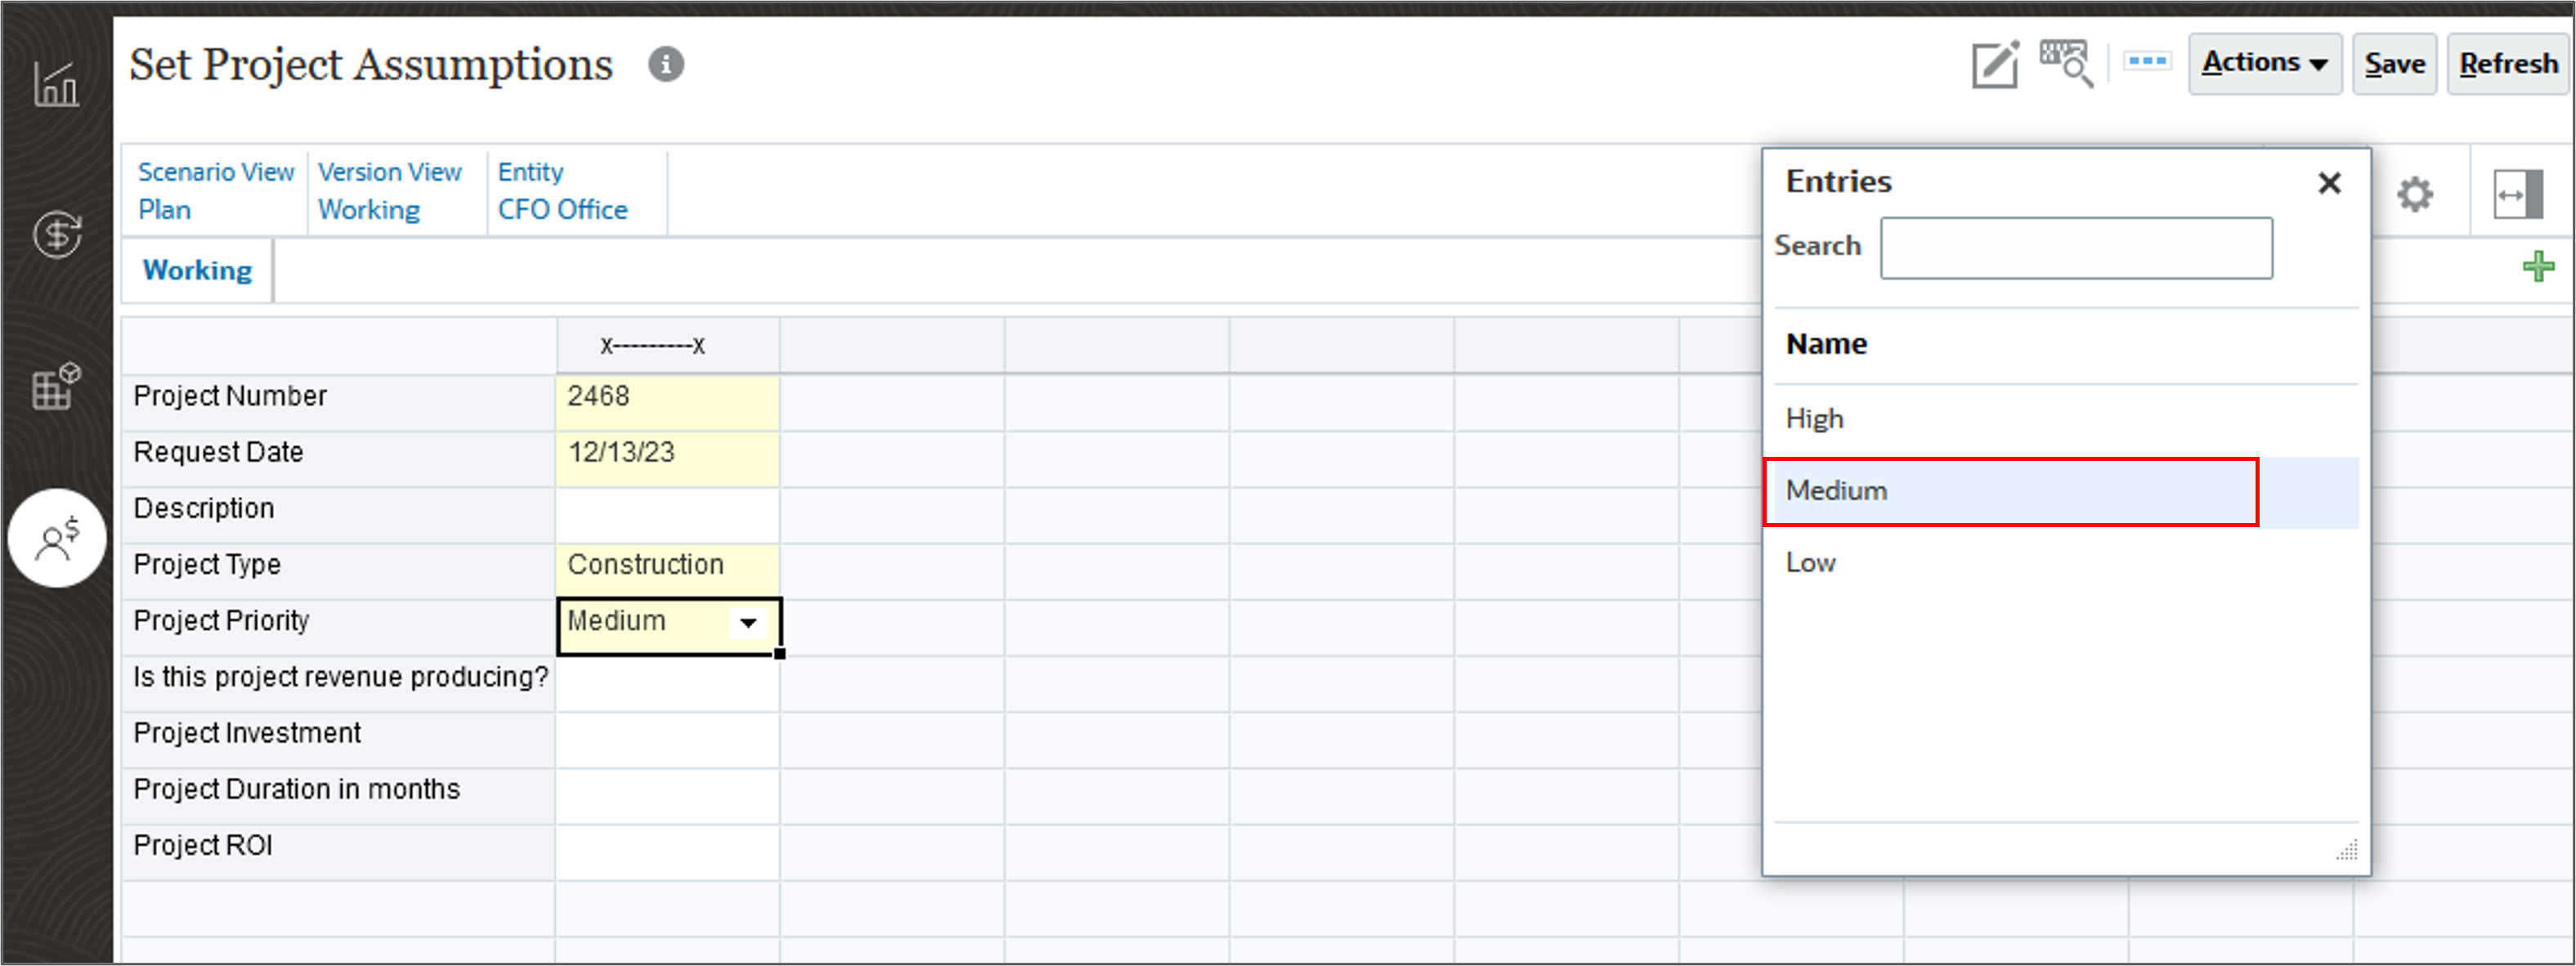
- For Project Priority, click the down arrow and select Medium.
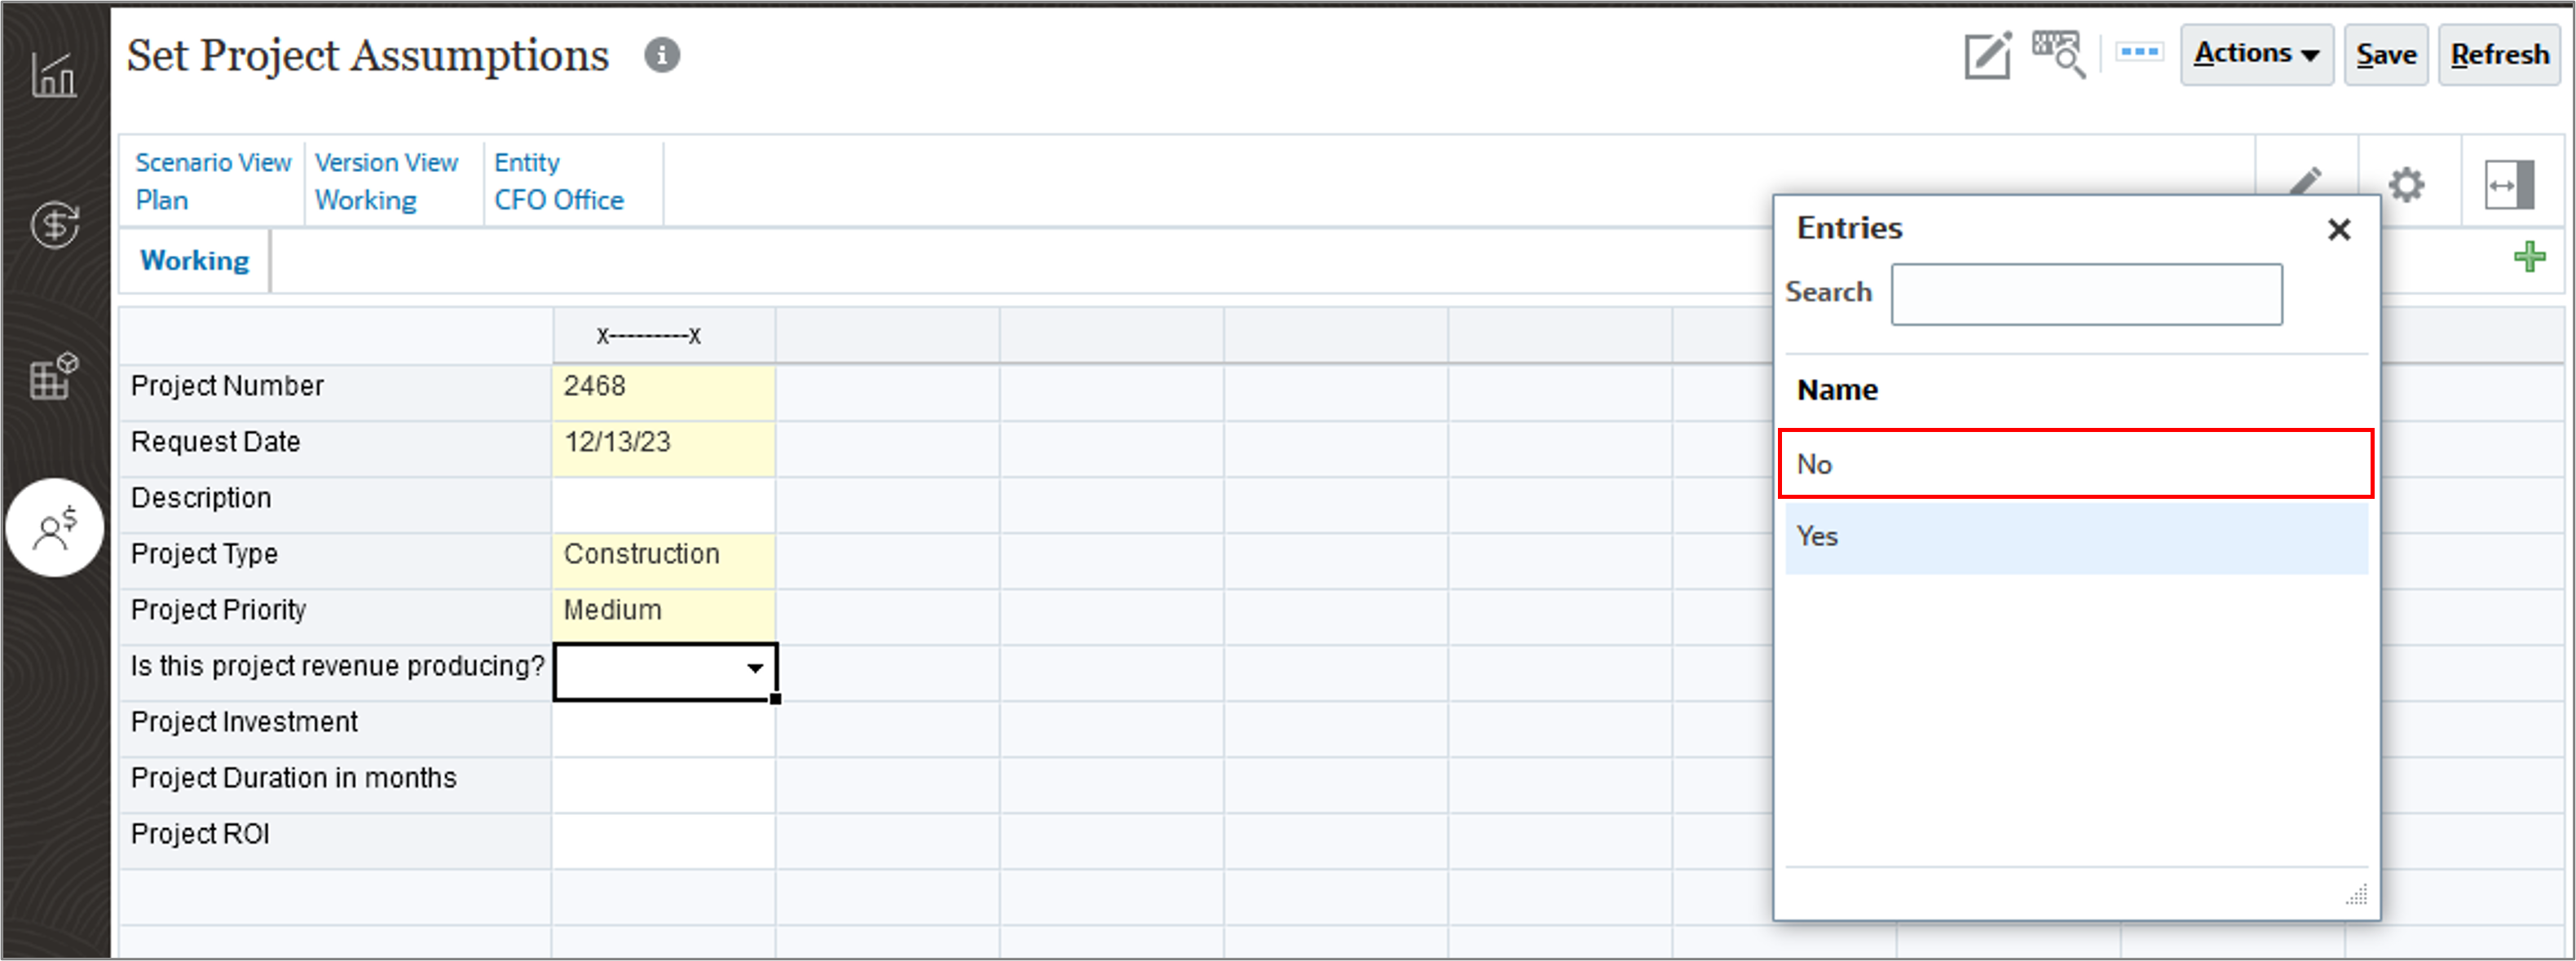
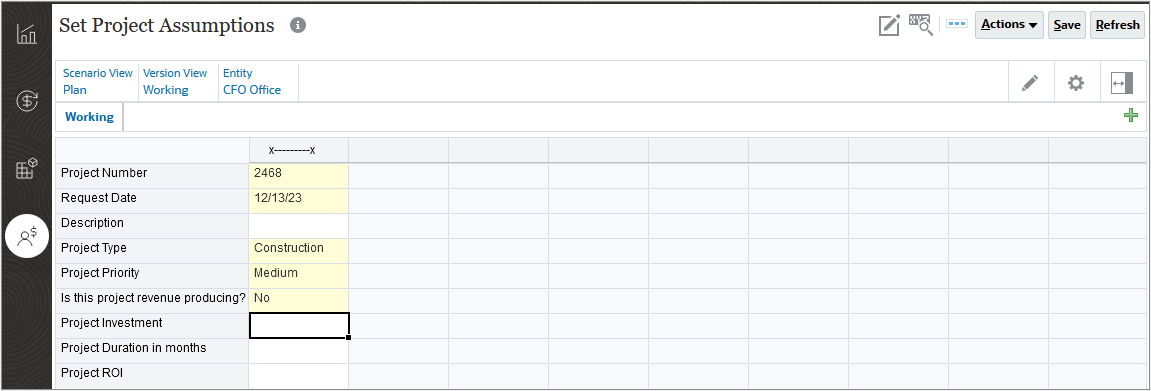
- For "Is this project revenue producing", click the down arrow and select No.
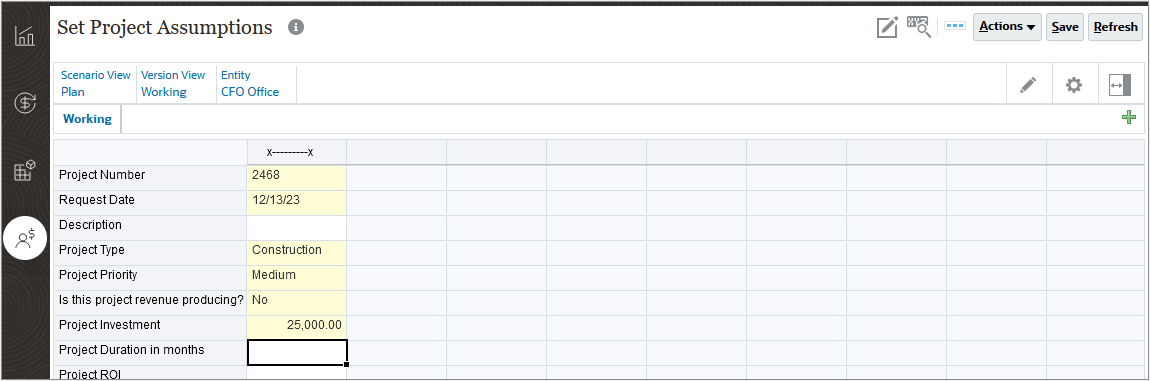
- For Project Investment, enter 25000.
- For Project Duration in months, enter 5.
- For Project ROI, enter 8%.
- Click Save.
Since this form is set up to save data automatically, values are saved after entering them and the cells are green. The form is also automatically calculated and parent members are calculated. In this example, both Q1 and Total Office Expenses are calculated.
From Q1, data is spread evenly to each of its months: Jan, Feb, and Mar. Data is automatically saved and the cells are green. Total Office Expenses is updated.
Entering Text Data, Smart List Data, and Percentage Data in Planning
In this section, you enter text data, Smart List data, and percentage data:
Changed data which has not yet been saved is yellow.