Introduction
This tutorial shows you how to report on data with attribute hierarchies. You can view and report on data organized by attribute on the web on forms, and dashboards and with MR reports or in Smart View with ad hoc analysis. The sections build on each other and should be completed sequentially.
Note:
This tutorial illustrates a Planning use case for viewing and reporting with attributes. You also can view and report on data with attributes in other business processes including FreeForm, Financial Consolidation and Close, Tax Reporting, and Enterprise Profitability and Cost Management.Background
Attributes describe characteristics of data, such as the size and color of products. You can use attributes to group and analyze members of dimensions based on their characteristics. For example, you can analyze product profitability based on size or packaging, and you can make more effective conclusions by incorporating market attributes, such as the population size of each market region, into your analysis.
Attribute dimensions can have a data type of text, numeric, Boolean, or date that enables different functions for grouping, selecting, or calculating data. The attribute type applies only to level 0 members of the attribute dimension.
Attribute values provide users with another way to select dimension members when using forms, filtering the data based on what data you want to display. Filtering can be done based on parent-level members or on children or descendant members. If there are multiple attributes assigned to a base dimension, you can filter by parent with some attributes and by an attribute member for others.
Data values for attributes are dynamically calculated but not stored. You can assign attributes to sparse dimensions only. You can't assign attributes to label-only members.
You can have a flat attribute hierarchy, or you can include levels in attribute hierarchies. For example, you can have an attribute for color and include members in that dimension for different colors such as blue, yellow, and brown. The Color dimension is a flat dimension.
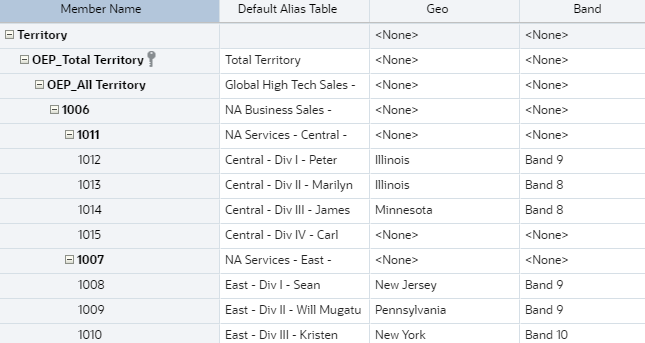
You can have an attribute dimension for Key Account Manager, KAM. The KAM dimension is an attribute dimension that is associated with the main dimension, Customer. In the attribute dimension you can specify names of the Key Account Managers. This attribute dimension includes a hierarchy. The key account managers are assigned to regions.

You can view data by the parent KAM or by one of the descendants. So, you could get a total for all key account managers, by regions (such as East) or by individual key account managers.
You can view and report on data organized by attribute on the web or in Smart View. On the web, you can view and report on data in forms, dashboards, and MR reports. In Smart View, in an ad hoc grid, you can filter by attributes in dimensions that contain attribute members.
Prerequisites
Cloud EPM Hands-on Tutorials may require you to import a snapshot into your Cloud EPM Enterprise Service instance. Before you can import a tutorial snapshot, you must request another Cloud EPM Enterprise Service instance or remove your current application and business process. The tutorial snapshot will not import over your existing application or business process, nor will it automatically replace or restore the application or business process you are currently working with.
Before starting this tutorial, you must:
- Have Service Administrator access to a Cloud EPM Enterprise Service instance.
- Microsoft Excel installed.
- Smart View installed and configured to connect to your instance.
- Import this snapshot into your instance. The examples provided in this tutorial use the snapshot.
- Download this Excel file.
- Activate the Quota Sales Mgr Navigation Flow, and select it on the home page.
Tip:
You can download Smart View via the Downloads page in your instance or here.Note:
If you run into migration errors importing the snapshot, re-run the migration excluding the HSS-Shared Services component, as well as the Security and User Preferences artifacts in the Core component. For more information on uploading and importing snapshots, refer to the Administering Migration for Oracle Enterprise Performance Management Cloud documentation.About Attributes
You associate an attribute dimension with a main dimension. For example, you can associate the attribute dimension Market Size with the main dimension Entity.
In this example, revenue for computer equipment is displayed by entity. The data is categorized by market size.
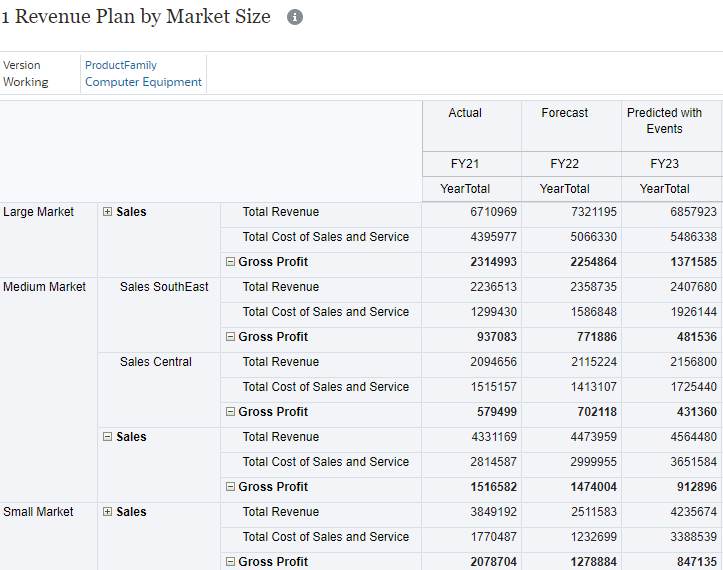
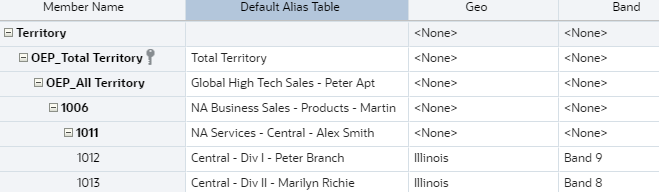
Attributes can have a flat structure or they can include a hierarchy. Within the provided application for this tutorial, the attributes include a hierarchy. The main dimension Territory includes Geo and Band attributes.
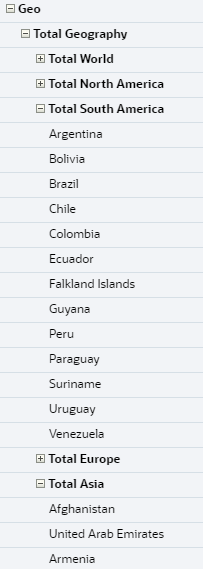
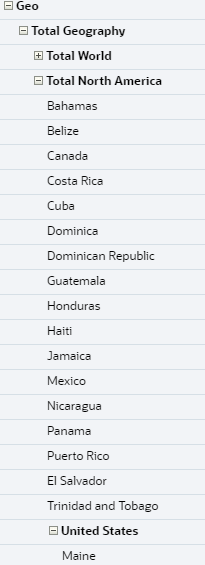
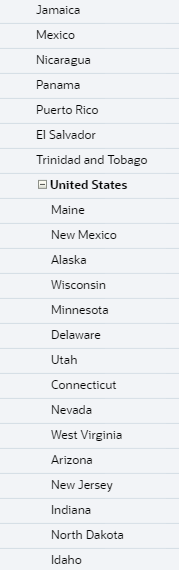
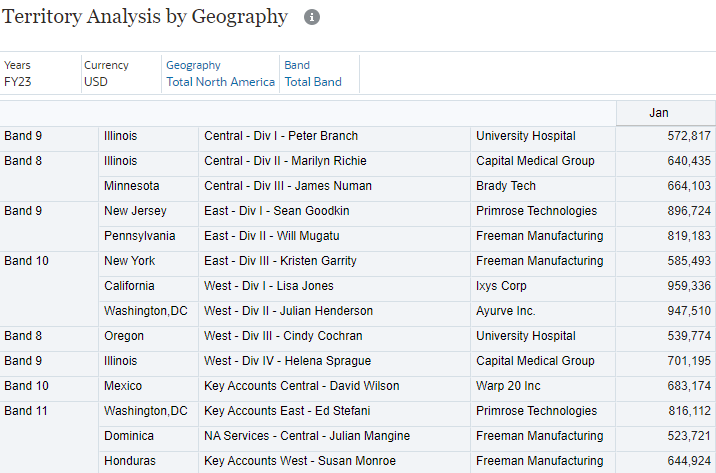
Within Geo, there is Total Geography which includes Total World, Total North America, Total South America and so on. Those attributes include additional members. For example, Total North America includes Bahamas, Belize, Canada and Costa Rica to name a few. Within Total North America is the United States which includes another level of detail.
 |
 |
 |
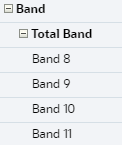
Within Band, there are four bands: Band 8, Band 9, Band 10, and Band 11. The bands categorize compensation levels of the sales representative for that territory.
When you assign the Geo attribute to a territory, you assign a level 0 attribute. For example, if a territory is type United States, you assign one of the level 0 United States members such as Minnesota.
Reporting with Attribute Data on the Web
In this section, you review attribute data in forms, dashboards, and in MR reports.
Setting up User Variables
In this section, you set up user variables so that you can review attribute data on the web.
- Log onto the application as the Service Administrator.
- Click
 (Navigator), and under Tools, select User Preferences.
 - Under Preferences select User Variables.
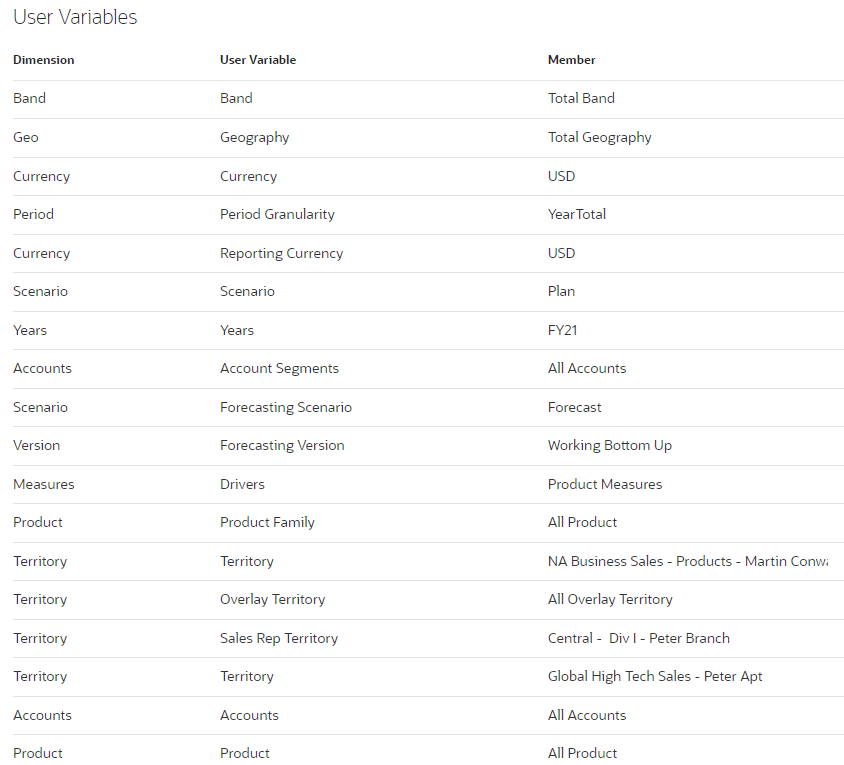
- For Band in Member enter or select Total Band.
- For Geography in Member enter or select Total Geography.
- Ensure you have the following user variables defined:
- Click Save, and then click OK.
- Click
 (Home).
Reviewing Form Setup
In this section, you review how forms are set up on the web.
- Ensure you have the Quota Sales Mgr Navigation Flow selected.
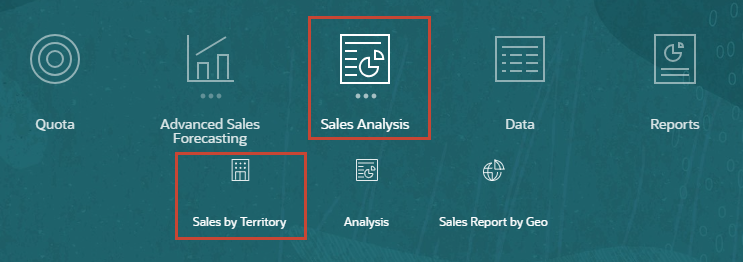
- On the home page, click Sales Analysis, then Sales by Territory.
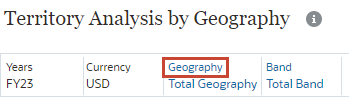
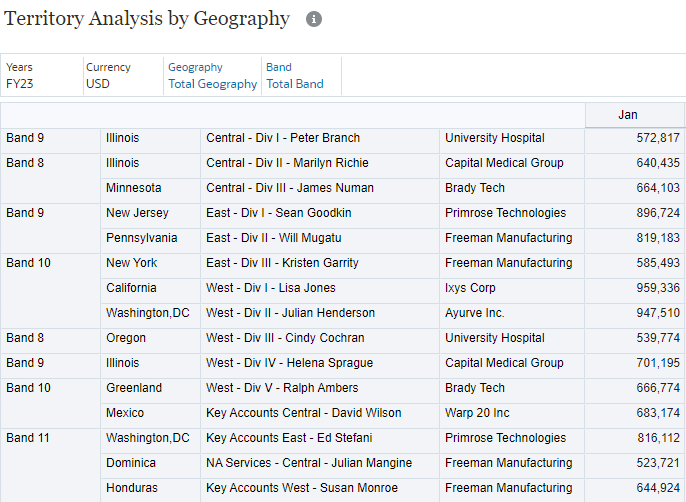
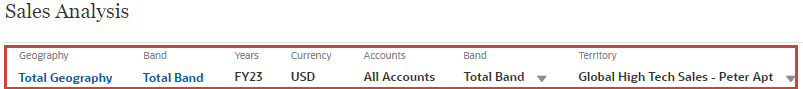
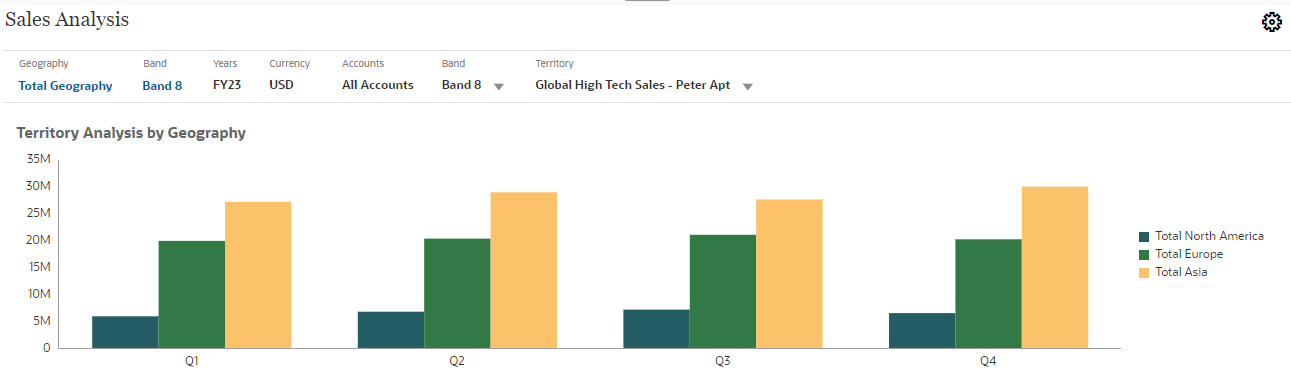
Territory Analysis by Geography is displayed. There are attributes for Geography and Band displayed in the POV.
Tip:
You can decide to set the POV as per the example and following steps.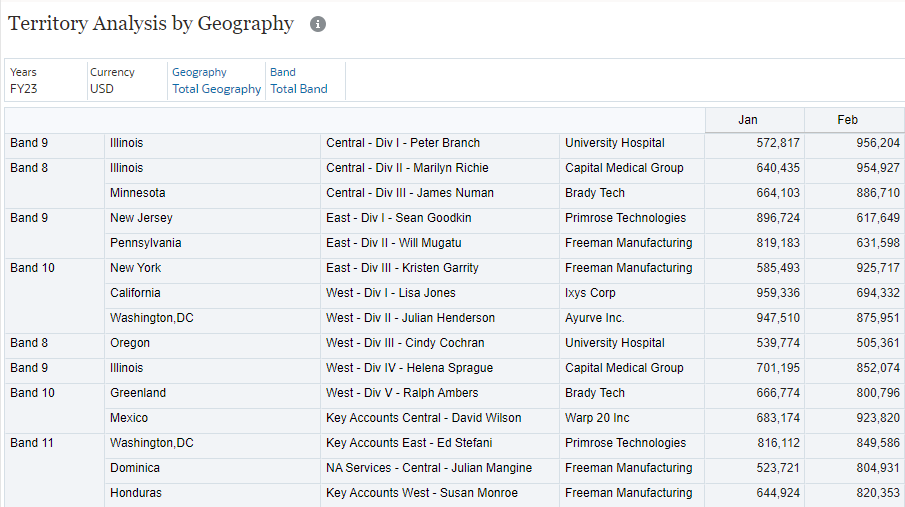
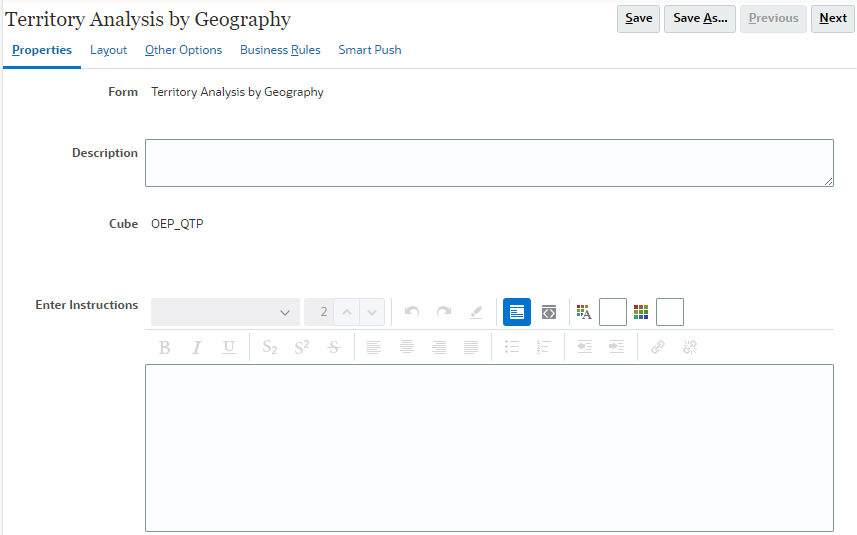
- On the right, click Actions, then click Edit.
You can review and make changes to the form design.
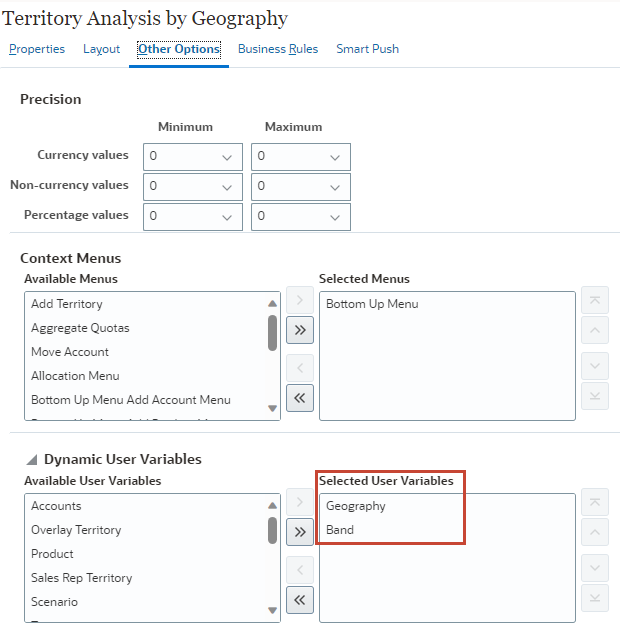
- Towards the top, select the Other Options tab.
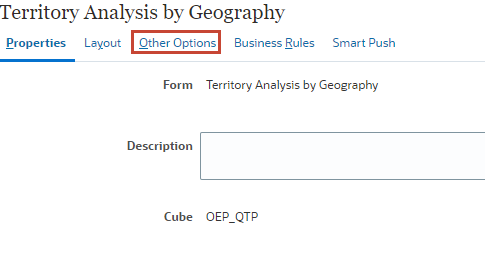
Geography and Band are set up as dynamic user variables.
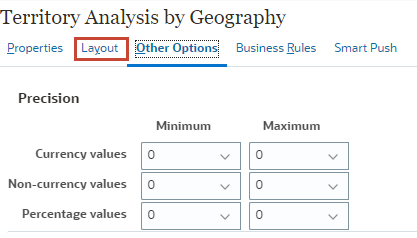
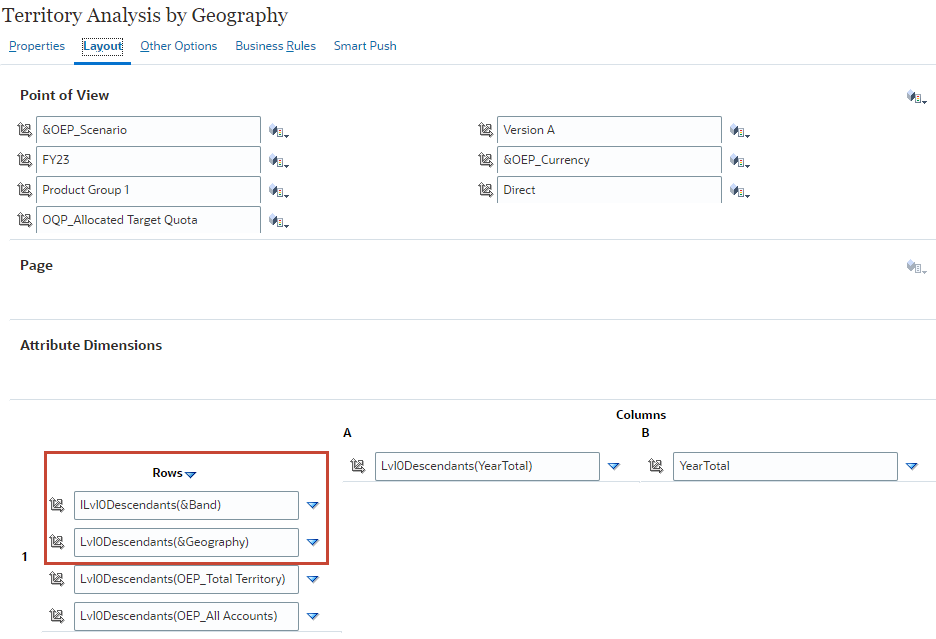
- Towards the top, select the Layout tab.
The rows include the level 0 descendants of Band and Geography.
- Close the form layout by closing the Edit tab.
Reviewing Data by Attribute in Forms
In this section, you review attribute data in forms on the web.
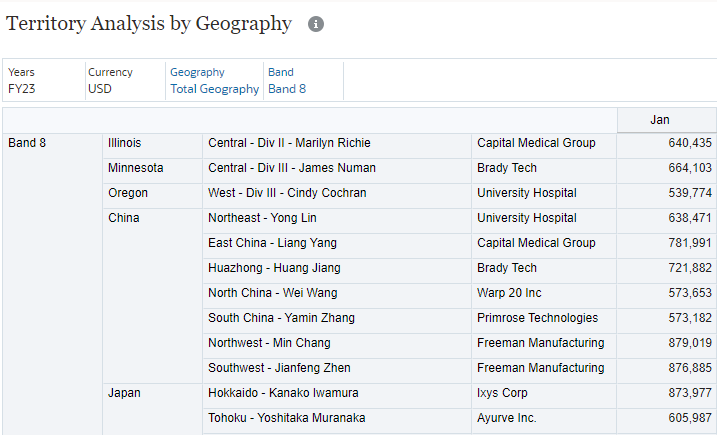
- With the Territory Analysis by Geography form open from the previous section, scroll down and notice that data for the descendants of Total Geography and for all bands is displayed.
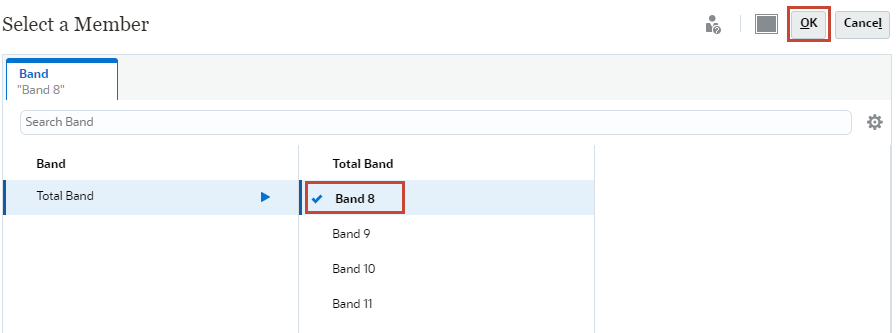
- In the POV, click Total Geography.
- Under Total Geography, select Total North America, and click OK.
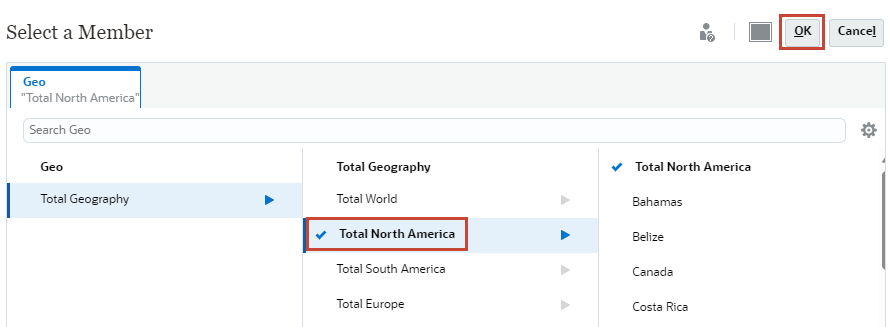
Data for the descendants Total North America and for the descendants of Total Band is displayed.
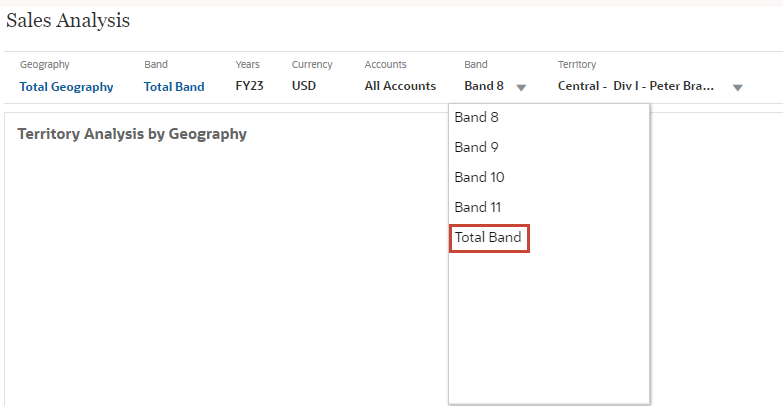
- In the POV, click Total Band.
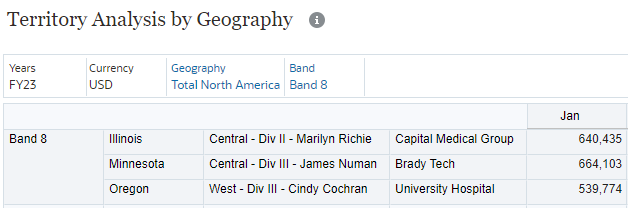
- Under Total Band, select Band 8, and click OK.
Data for the descendants of Total North America and for Band 8 is displayed.
- In the POV, click Total North America.
- Select Total Geography, and click OK.
Data for the descendants of Total Geography and for Band 8 is displayed.
- In the POV, click Band 8.
- Under Total Band, select Band 9, and click OK.
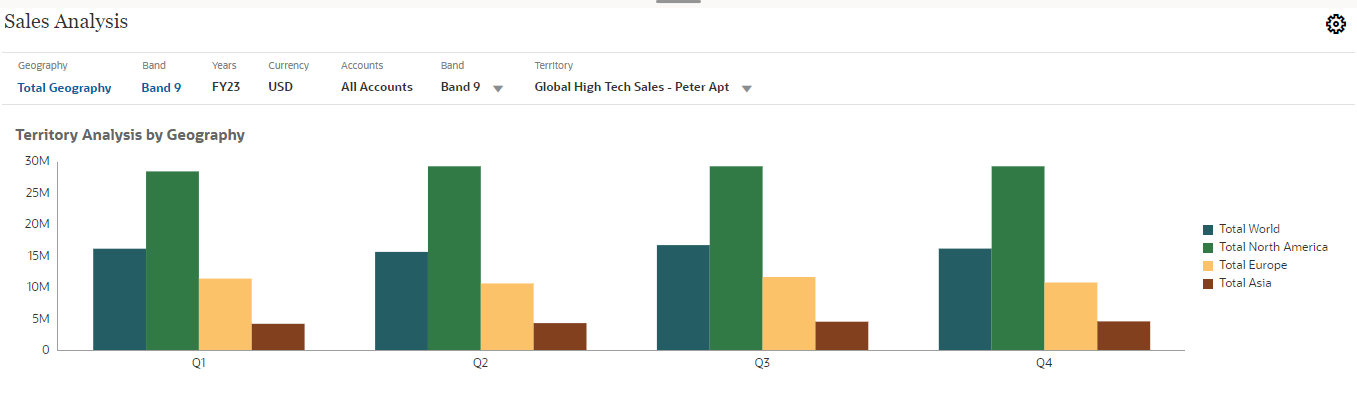
Data for the descendants of Total Geography and for Band 9 is displayed.
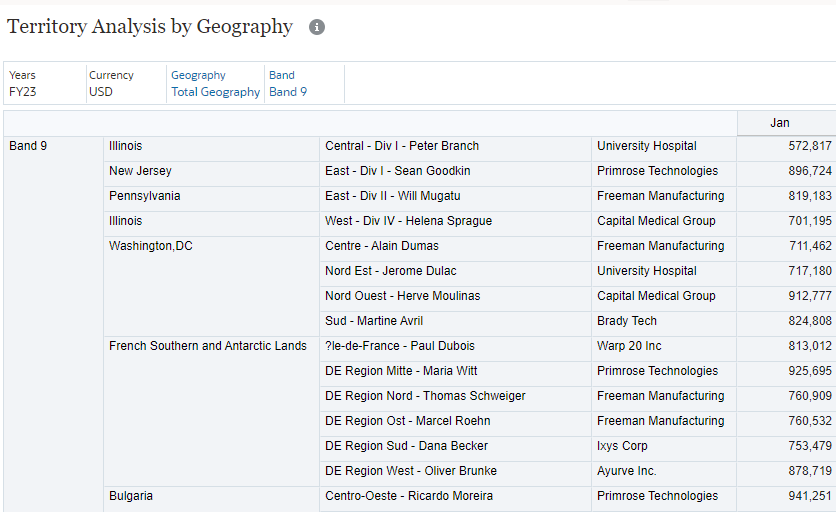
- In the POV, click Total Geography.
- Under Total Geography, select Total Europe, and click OK.
Data for the descendants of Total Europe and for Band 9 is displayed.
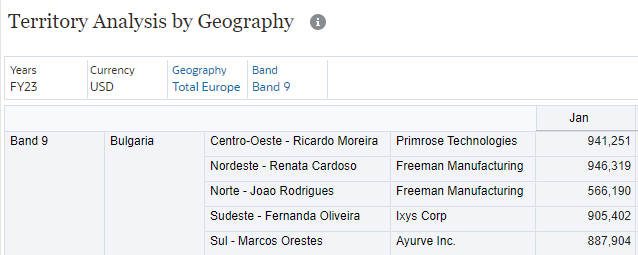
- In the POV, click Total Europe.
- Select Total Geography, and click OK.
Data for the descendants of Total Geography and for Band 9 is displayed.
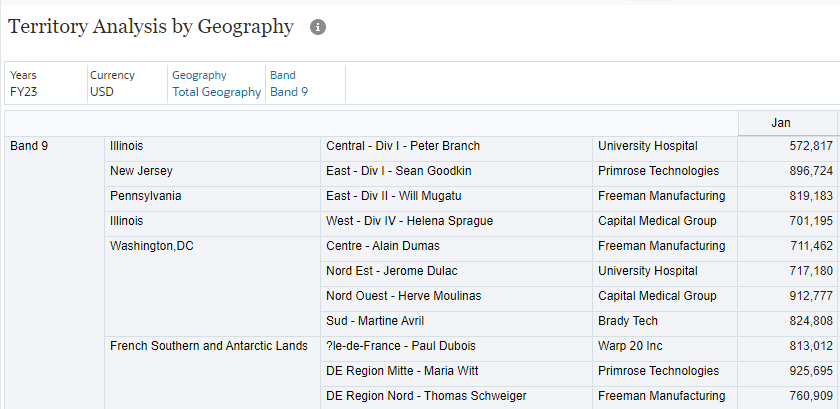
- In the POV, click Band 9.
- Select Total Band, and click OK.
Data for the descendants of Total Geography and the descendants of Total Band is displayed.
Reporting with Attribute Data in MR Reports
In this section, you review attribute data in MR reports. Before running the report, we set the POV for the territory, geography, and band in a dashboard.
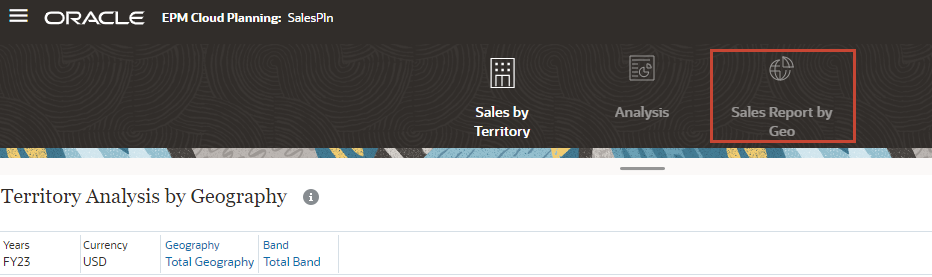
- Above Territory Analysis by Geography, click Analysis.

- For Band, select Total Band.
- Ensure that your selections match the example.
The Sales Analysis dashboard is updated based on the POV selections.
- Above Territory Analysis by Geography, click Sales Report by Geo.
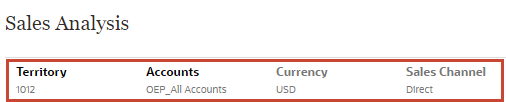
- Ensure that the POV matches the following:
A report is displayed.
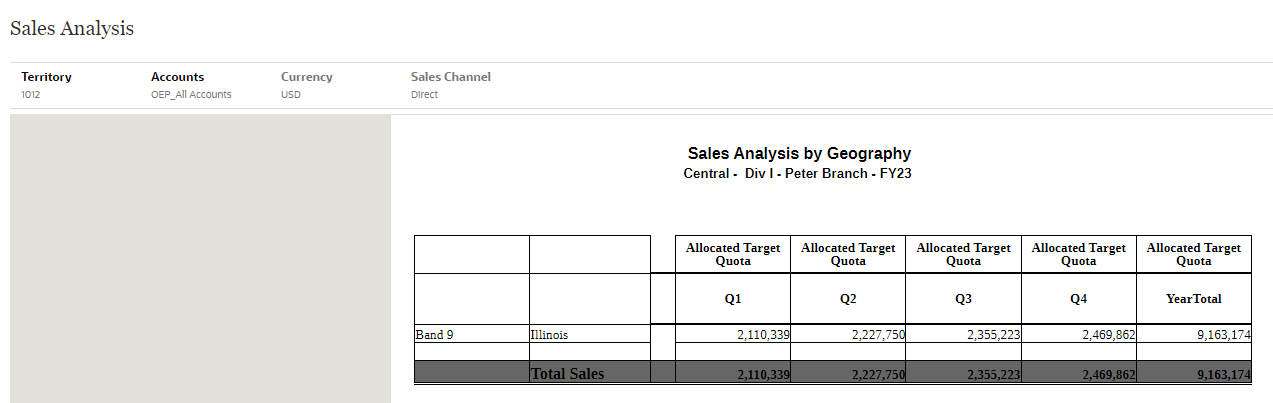
- In the POV, click Territory.
- For Territory, select 1006.
Allocated target quota is displayed for Martin Conway.
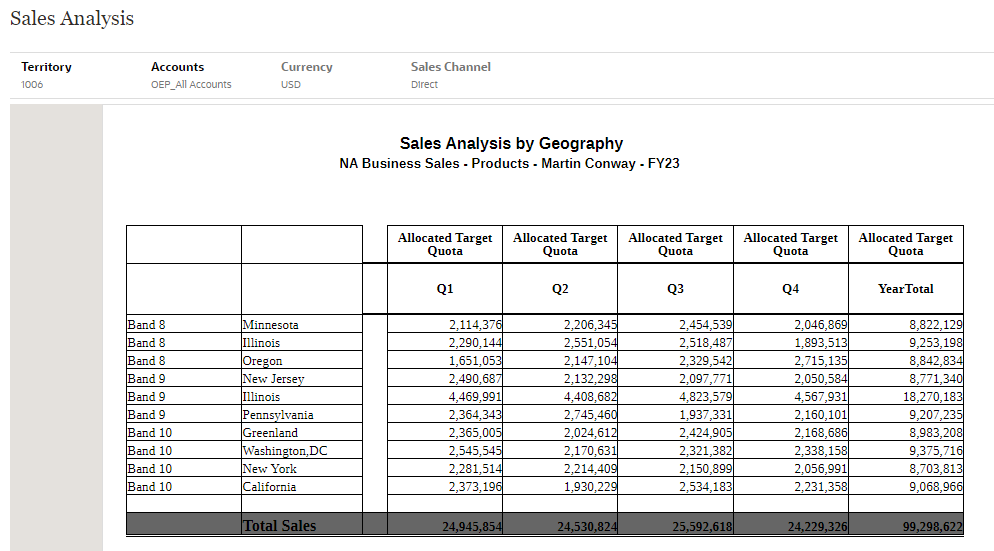
- In the POV, click Territory, and select OEP_All Territory.
Allocated target quota is displayed for Peter Apt.
Reviewing Data by Attribute in Dashboards
In this section, you review attribute data in dashboards. You drill down on territories to see sales details.
- Above Territory Analysis by Geography, click Analysis.

- In the POV, ensure that your selections match the following:
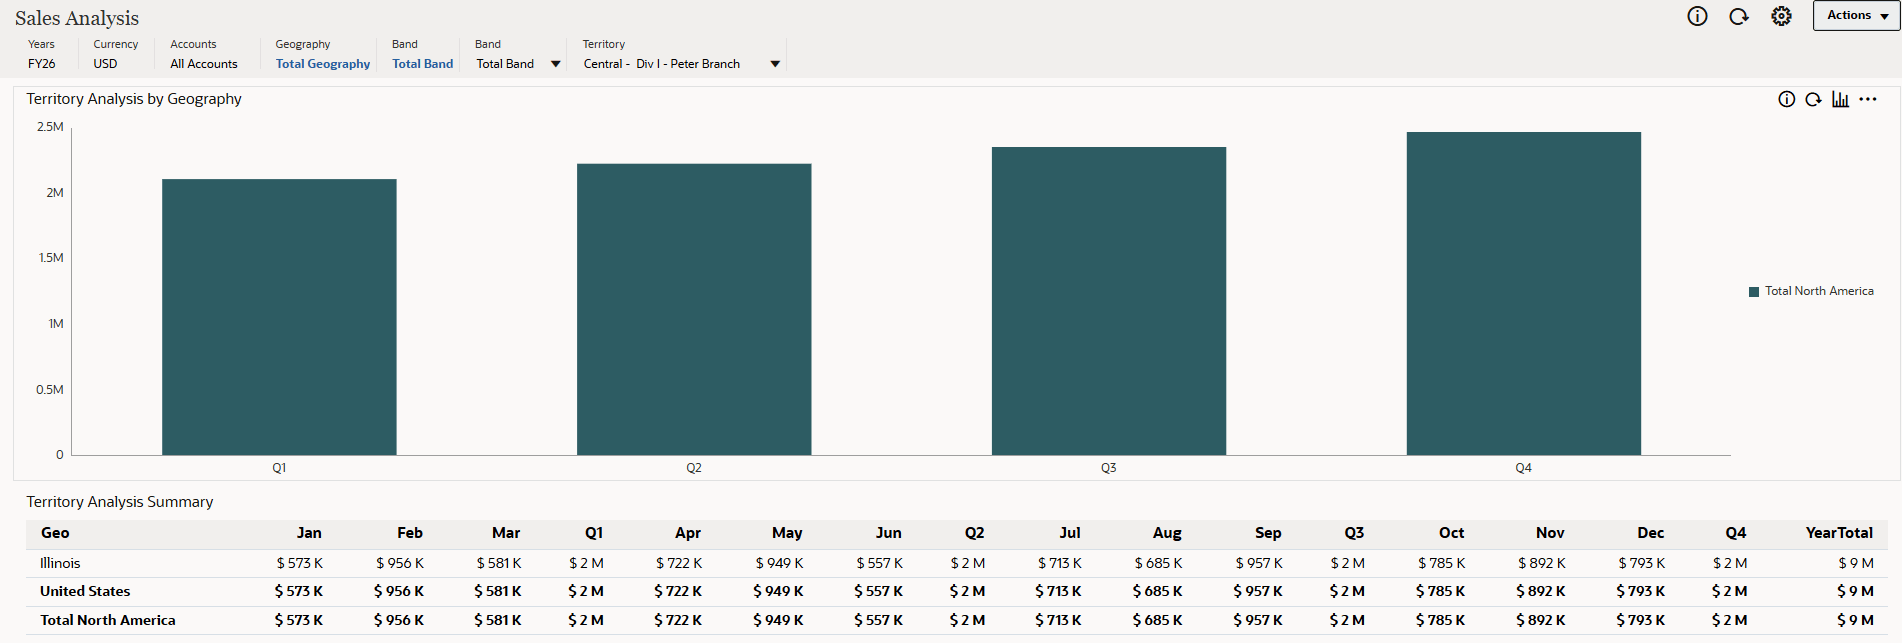
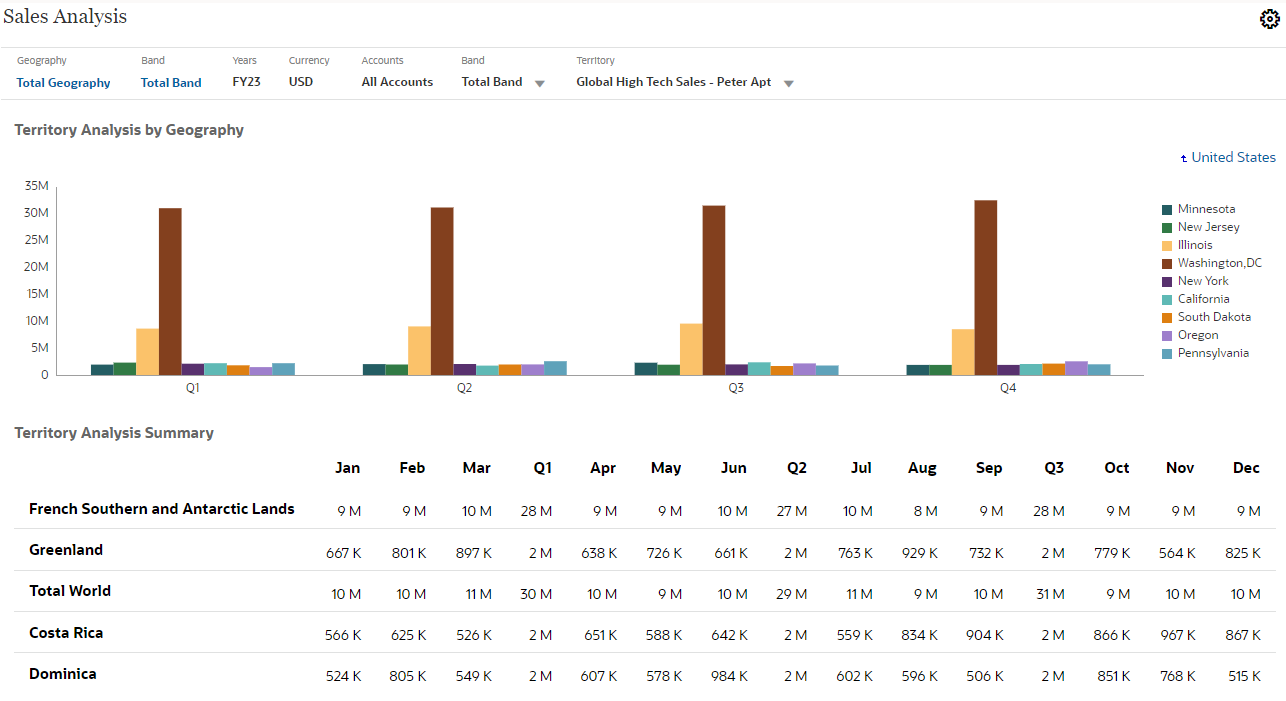
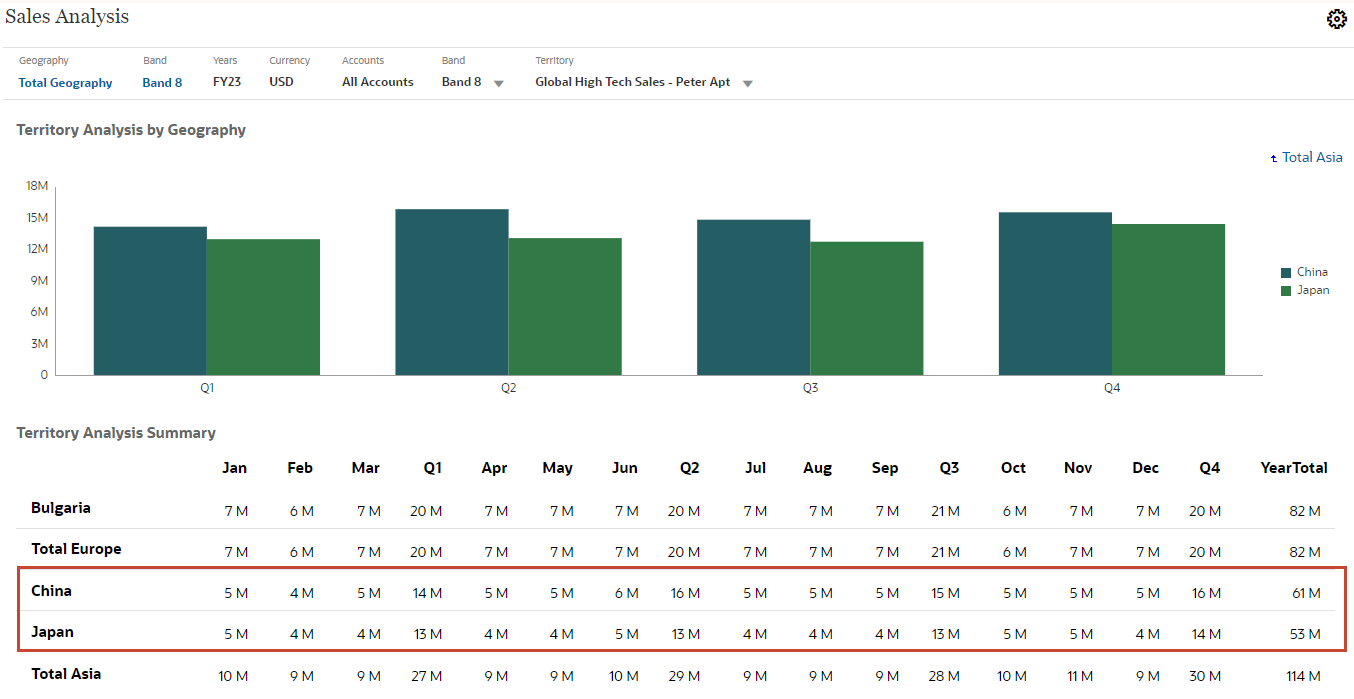
The Sales Analysis dashboard is displayed. In Territory Analysis by Geography, you can review sales by quarter for territories. In Territory Analysis Summary, you can review sales by month.
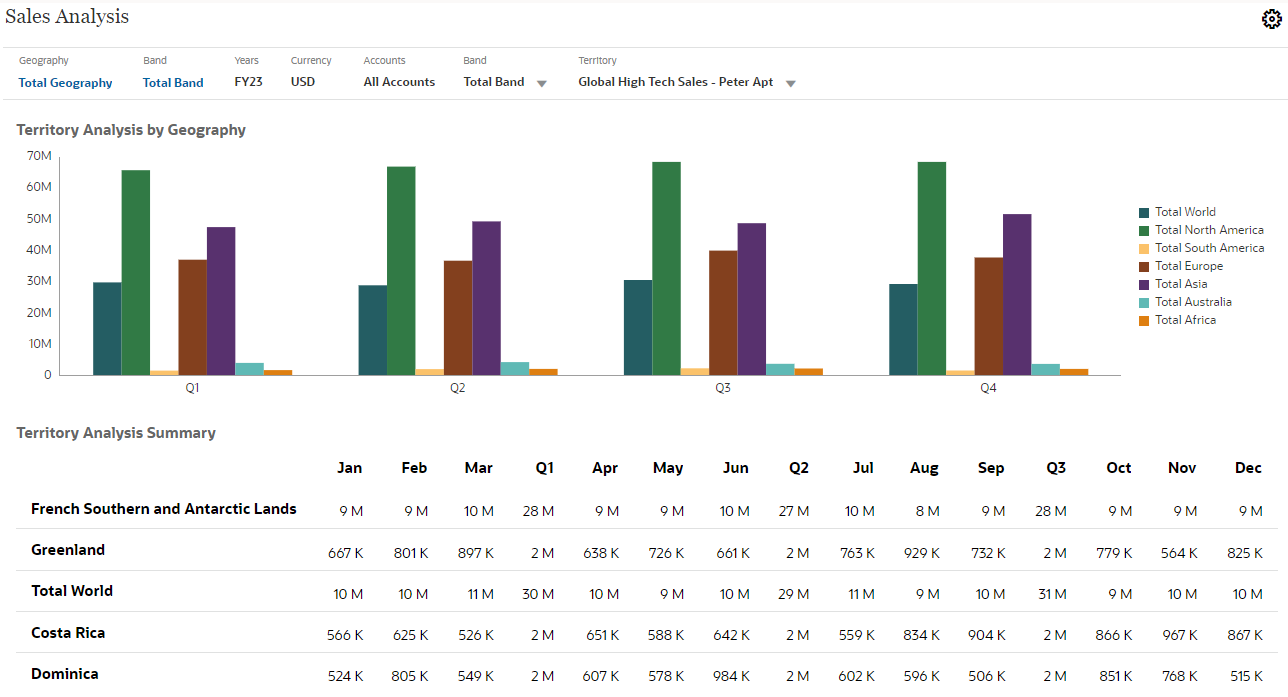
- To the right of the graph, click Total North America.
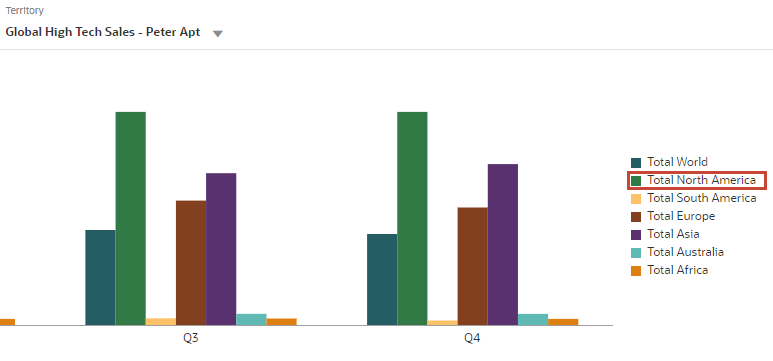
Data for the descendants of North America is displayed in the graph.
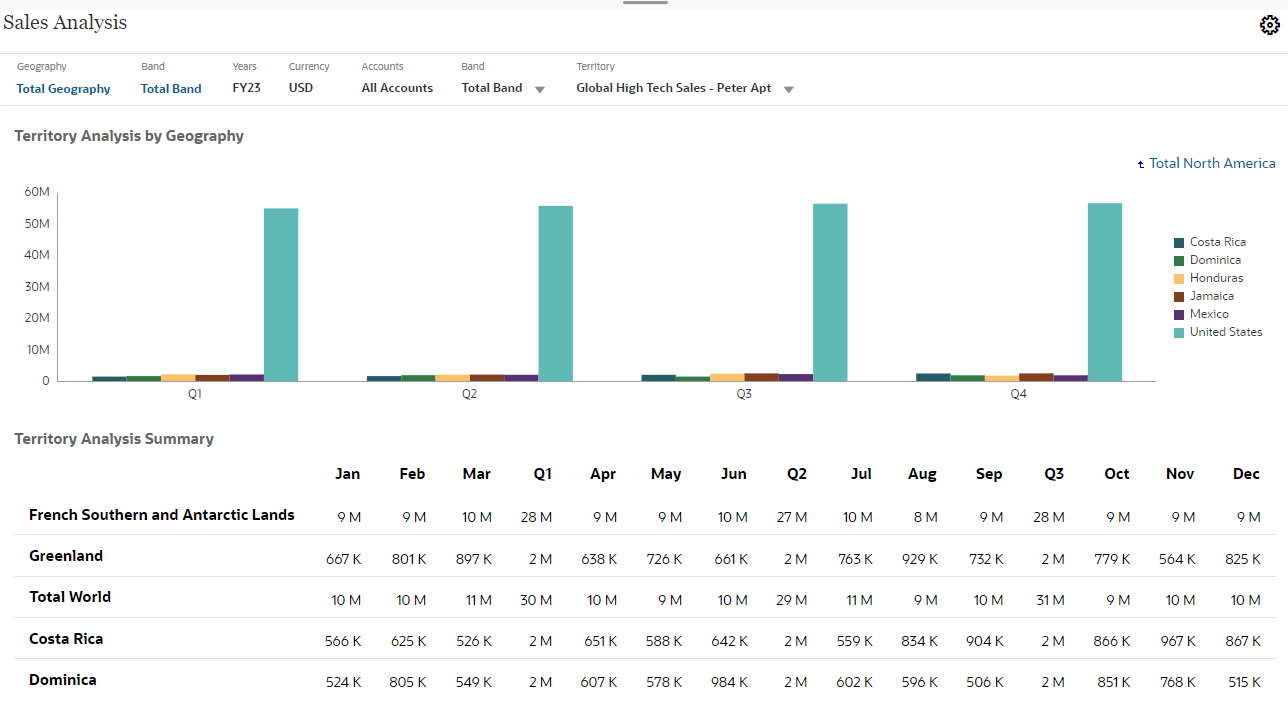
- To the right of the graph, click United States.
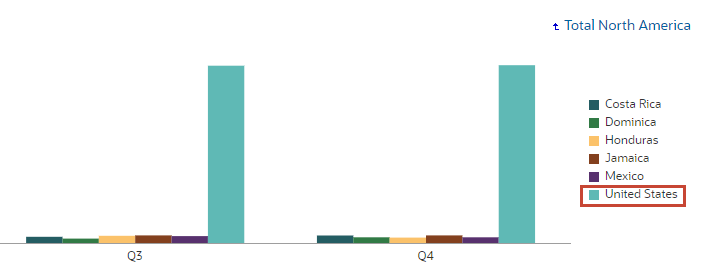
Data for the descendants of United States is displayed in the graph.
- In the POV, click Total Band.
- Under Total Band, select Band 8, and click OK.
- To the right of the graph, click Total Asia.
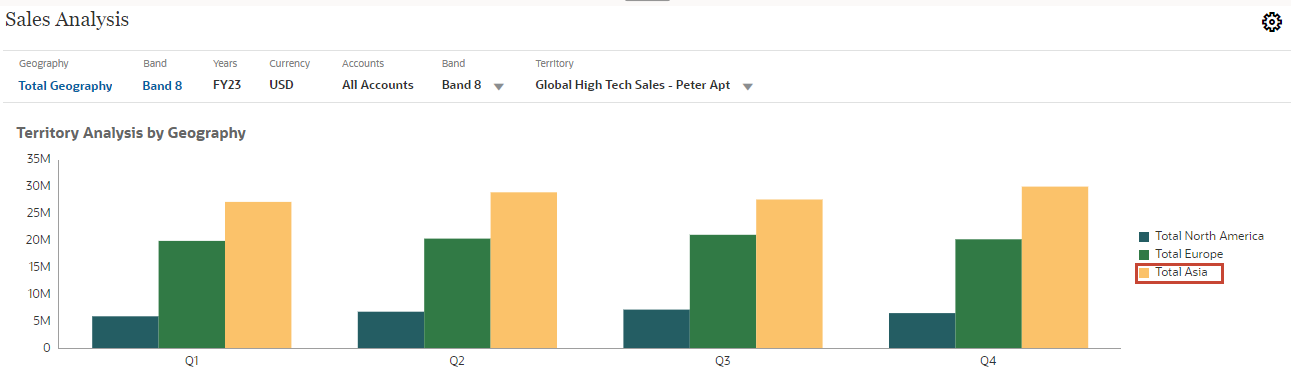
Territory Analysis by Geography is updated. Data for China and Japan is displayed.
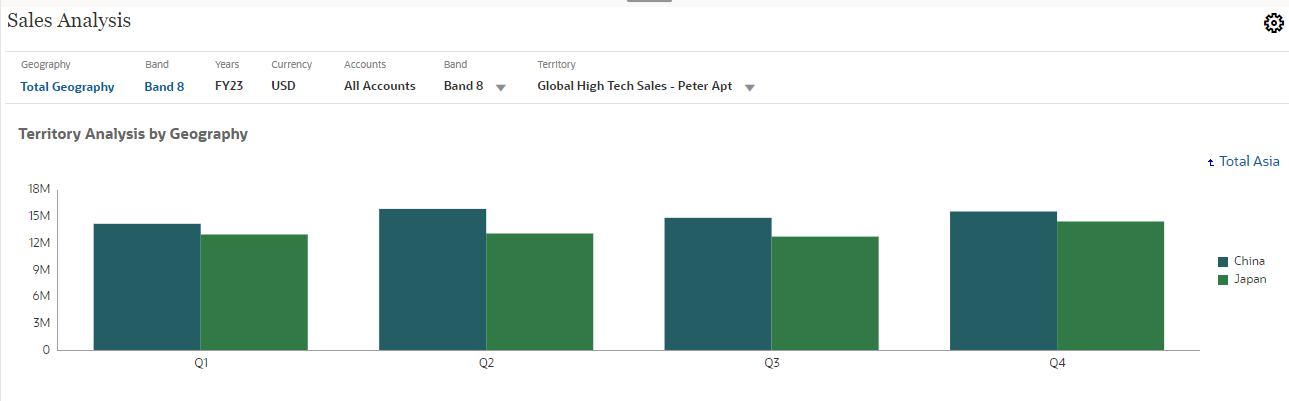
- In Territory Analysis Summary, scroll down to view information about China and Japan.
- In the POV, click Band 8.
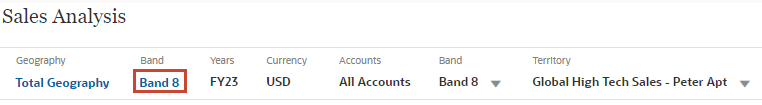
- Under Total Band, select Band 9, and click OK.
Territory Analysis by Geography is updated to include only Band 9.
Territory Analysis by Geography is updated to only include Band 8.
Analyzing Attribute Data in Smart View
In this section, you review attribute data in Smart View. In an ad hoc grid, you can filter by attributes in dimensions that contain attribute members. In this tutorial, the Territory dimension includes the attributes Geo and Band.
Connecting to the Application
In this section, you connect to your instance and application and refresh the workbook.
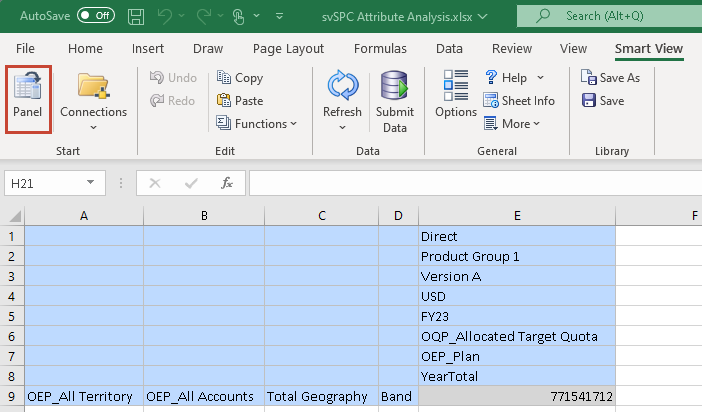
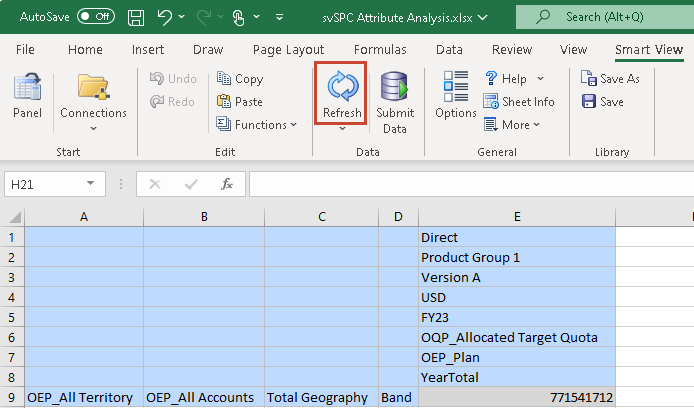
- Launch Excel and open svSPC_Attribute_Analysis_26.xlsx.
- Select the Smart View ribbon, and click Panel.
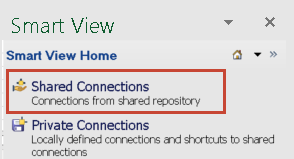
- Connect to your Cloud EPM instance using Shared Connections, Private Connections, or Recently Used.
In this tutorial, a Shared Connection is used.
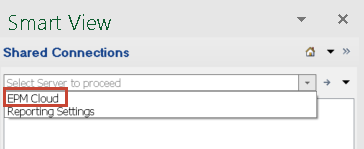
- For server, select EPM Cloud.
- In the Smart View ribbon, click Refresh.
Tip:
If the Planning Ad Hoc ribbon is not displayed, you may have to Start Ad Hoc Analysis: Right-click your Planning form, cube (eg. QTP), or data source in the panel, and select Ad Hoc Analysis. - Optional: Close the Smart View Panel.
- To ensure that the alias is displayed, complete the following steps:
- Select the account member on the grid and in the Planning Ad Hoc ribbon, click Change Alias.
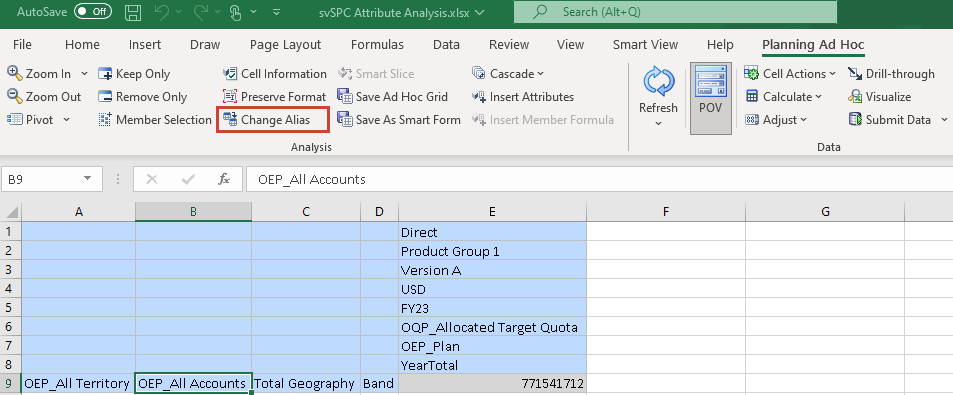
- Select Default.
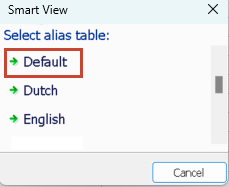
The alias is displayed for members.
- Select the account member on the grid and in the Planning Ad Hoc ribbon, click Change Alias.
Analyzing Data by Attributes in Smart View
In this section, you analyze attribute data in an ad hoc grid.
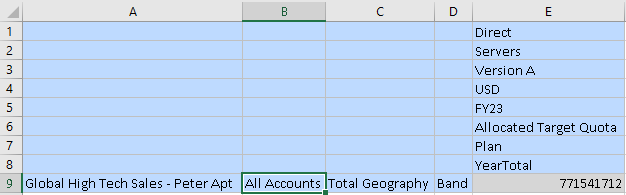
- In the Ad Hoc grid, double-click Band to drill down on it.
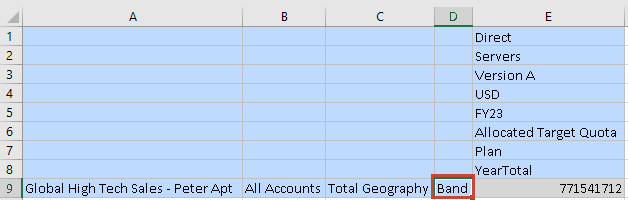
Total Band is displayed.
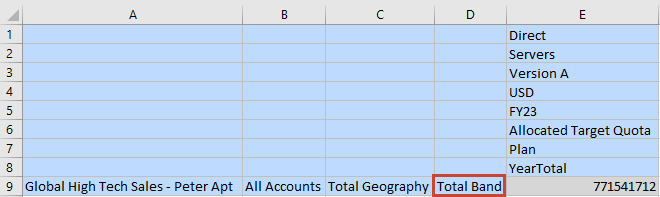
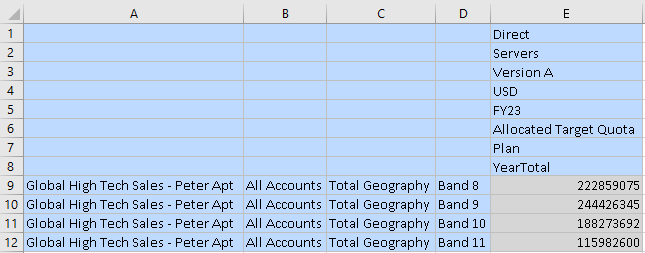
- In the Ad Hoc grid, double-click Total Band to drill down on it.
Four bands are displayed.
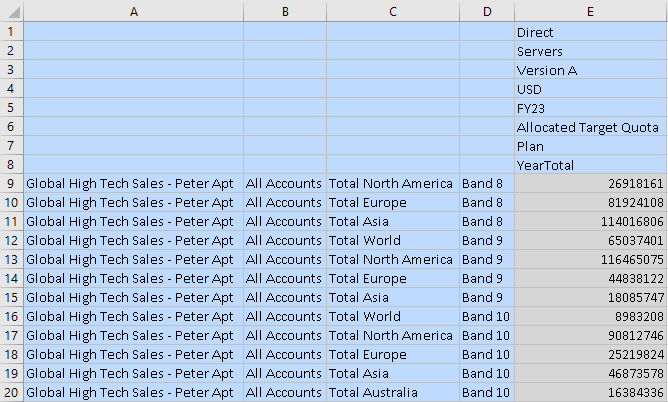
- In the Ad Hoc grid, double-click the first Total Geography (Band 8) member to drill down on it.
Tip:
You can select any of the Total Geography members to drill down.The children of Total Geography are displayed.
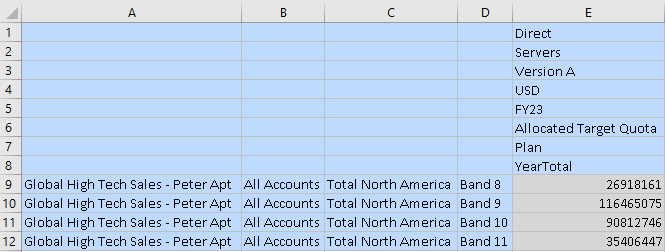
- Select the Total North America (Band 8) member, and in the Planning Ad Hoc ribbon, click Keep Only.
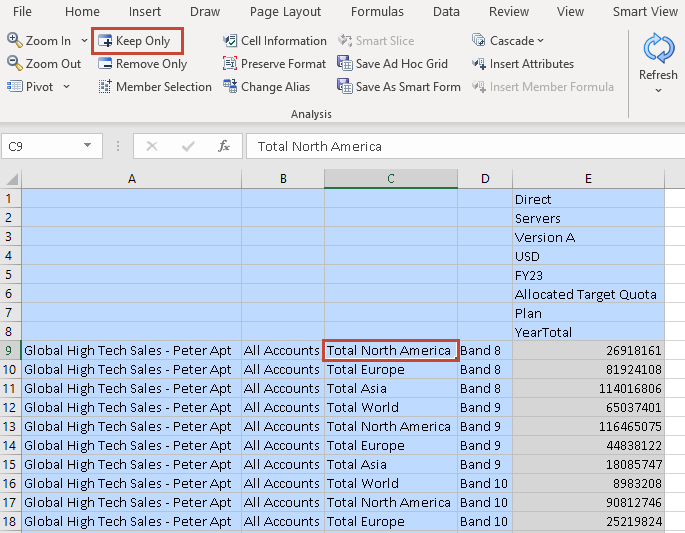
Tip:
You can select any of the North America members to drill down.Data for Total North America is displayed for each of the bands.
- Double-click the All Accounts (Band 8) member to drill down on it.
Tip:
You can select any of the All Accounts members to drill down.Data for the selected members is displayed.
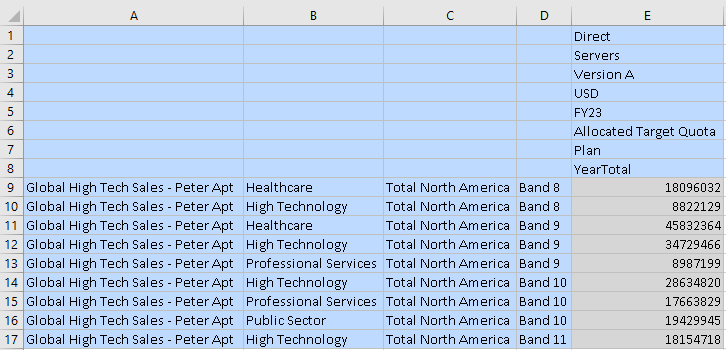
- Select the Healthcare (Band 8) member, and in the Planning Ad Hoc ribbon, click Keep Only.
Tip:
You can select any of the Healthcare members.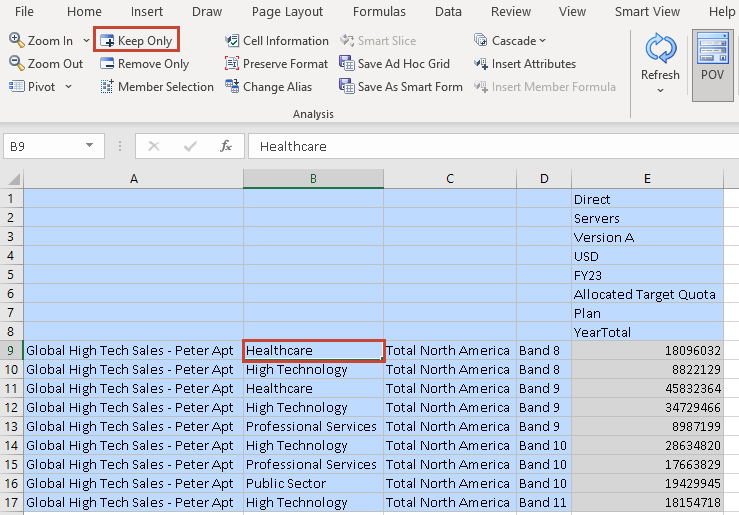
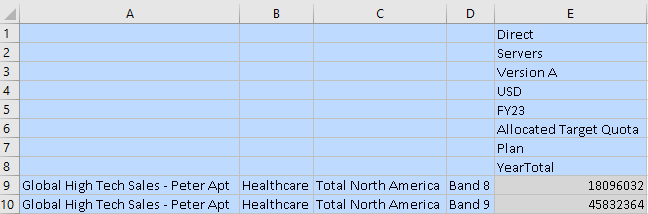
Data for Healthcare is displayed.
- Double-click the Total North America (Band 8) member to drill down.
Tip:
You can select any of the North America members to drill down.United States is displayed.
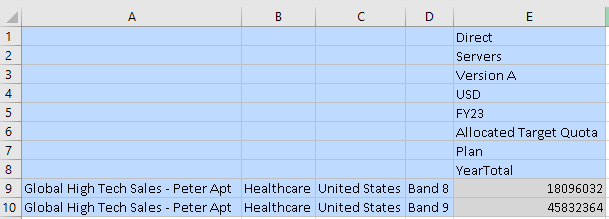
- Double-click the United States (Band 8) member to drill down.
Tip:
You can select any of the United States members to drill down.Data for the children of United States is displayed.
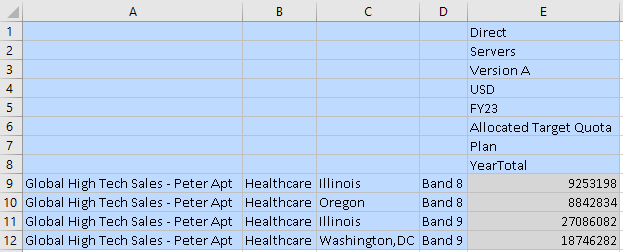
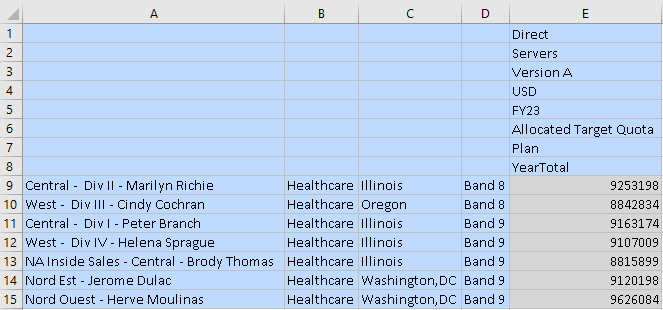
- Select the Global High Tech Sales – Peter Apt (Illinois, Band 8) member, and then in the Planning Ad Hoc ribbon, select Zoom In and then Bottom Level.
Tip:
You can select any of the Global High Tech Sales – Peter Apt members to drill down.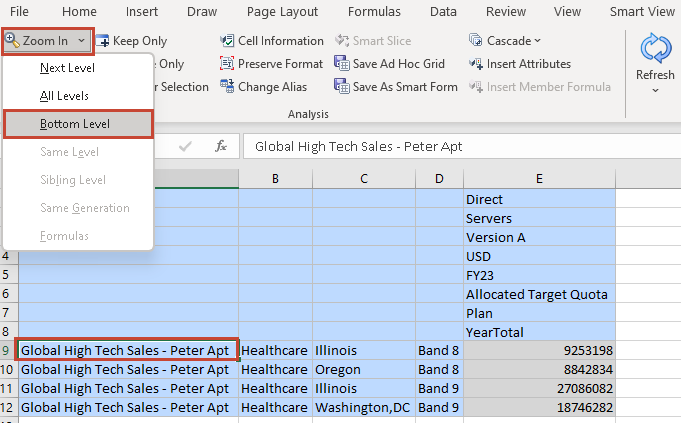
Data is displayed for the level 0 members in Peter Apt's organization.
Related Links
More Learning Resources
Explore other labs on docs.oracle.com/learn or access more free learning content on the Oracle Learning YouTube channel. Additionally, visit Oracle University to view training resources available.
For product documentation, visit Oracle Help Center.
Reporting on Data with Attribute Hierarchies
F87621-03
June 2026