Creating and Editing Analysis Views
To create a new analysis view:
-
Display the Analysis Views screen.
-
Click Create,
 .
.
Note:
You can access this option only if your security provisioning allows it.
-
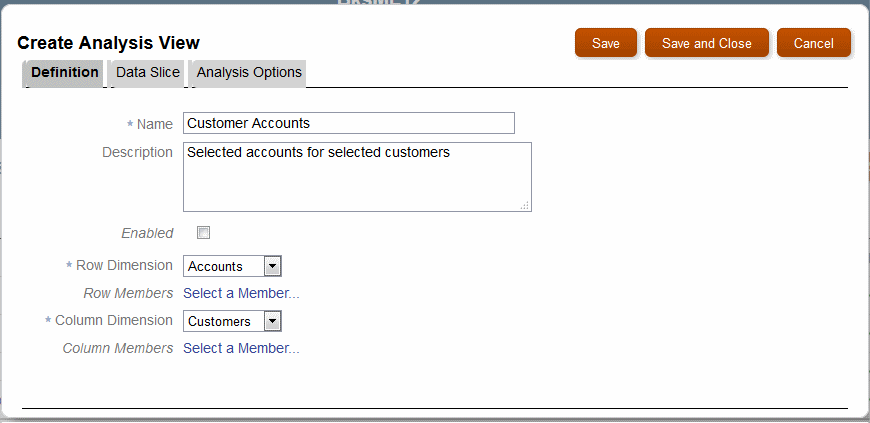
In the Create Analysis View screen, enter a name for the analysis view and an optional description.
-
Select a Row Dimension, for example Customers, and then select a Column Dimension, for example Accounts .
Figure 12-2 Create Analysis View Screen

-
Click Select a Member to select specific row or column dimension members:
-
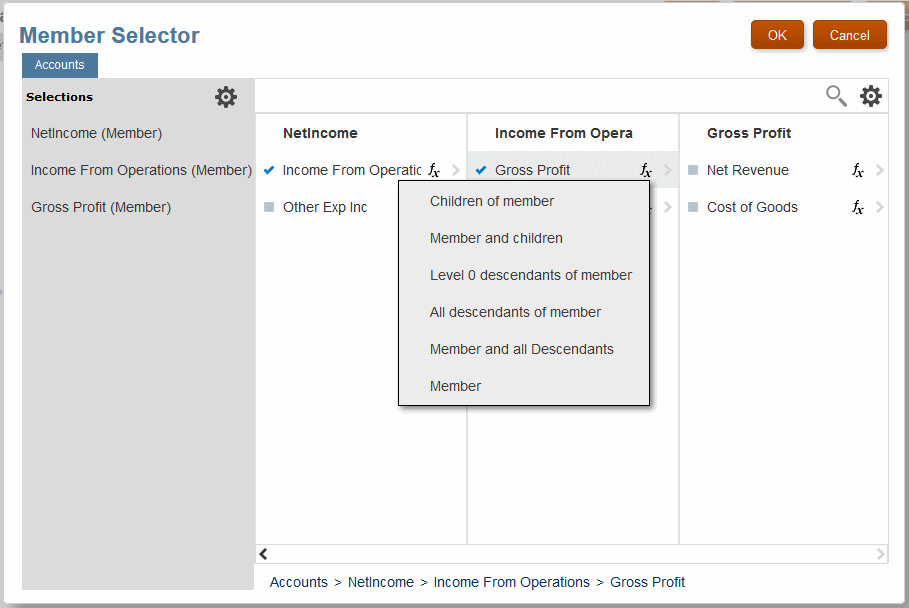
Select to any level of detail, for example Net Income, then Income From Operations, and then Gross Profit.
-
Select Member Function to use a default dimension member or select a formula to reference one or more members relative to the current selection.
Optionally, click fx to use a Selection Function.
Figure 12-3 Member Selector with Selection Function Options

-
-
Optional: Use the Data Slice tab to define the analysis view further, for example by including Products and selecting Bikes, but not Accessories.
Note:
If you don't specify a data slice, all dimensions that aren't rows or columns are used at the top level.
-
Optional: Use the Analysis Options tab to add more detail to the definition, especially concerning what displays on dashboards:
-
You can select one or more Point of View Bar Dimensions for user input, such as Year or Period, or any other dimensions available for that analysis view.
Users can customize member selection with the POV bar.
-
You can specify whether to use Generations or Levels for member ancestors, how many generations or levels to show for the row dimension, which row dimension attributes to use, what level of decimal precision to use, and whether or not to use aliases, if present.
Row dimension member's ancestors are displayed as additional columns in the view.
-
You can select from the following Row Sort Order and Column Sort Order settings to determine the order of rows and columns in the analysis view:
-
Outline -- Their order within the database outline
-
Alpha Ascending -- In alphabetical order from A to Z
-
Alpha Descending -- In reverse alphabetical order from Z to A
You can sort rows and columns in different orders. This feature can be helpful when using analysis views as simplified reports.
-
-
-
When the definition is complete, select Enabled on the Definition tab, and then select Save or Save and Close to add the new analysis view to the list.
To edit an existing analysis view, click ![]() at the end of the row. The Edit Analysis View screen is displayed. You can edit and save the definition following the previous steps used to create it.
at the end of the row. The Edit Analysis View screen is displayed. You can edit and save the definition following the previous steps used to create it.
You can also use ![]() to Copy an analysis view.
to Copy an analysis view.
Select Diagnose in the ![]() menu to display an overview of queries and other structural elements created by the definition. This diagnostic data can help you understand the analysis view and edit it if results are not as expected.
menu to display an overview of queries and other structural elements created by the definition. This diagnostic data can help you understand the analysis view and edit it if results are not as expected.