Predictive Cash Forecasting View By Forecast Method Supports What-if Analysis and Line Item Adjustments
View by Forecast Method is enhanced so you can perform what-if analysis and make adjustments to line items.
- The View by Forecast Method form has been converted to a dashboard. The dashboard includes Forecast Methods by Periods (in grid form and in chart form) and Forecast Method Assumptions.
- You can now make line item adjustments directly in View by Forecast Method. Previously, you could make adjustments to line items only in the Rolling Forecast form. This enhancement makes it easier to make future adjustments. The changes you make in View by Forecast Method are reflected in the Rolling Forecast form.
- You can now perform what-if analysis by modifying and blending forecast methods for a line item directly in View by Forecast Method. You see the impact of your changes on the forecast right away. Previously, you could make changes to forecast methods only in the Set Forecast Methods form.
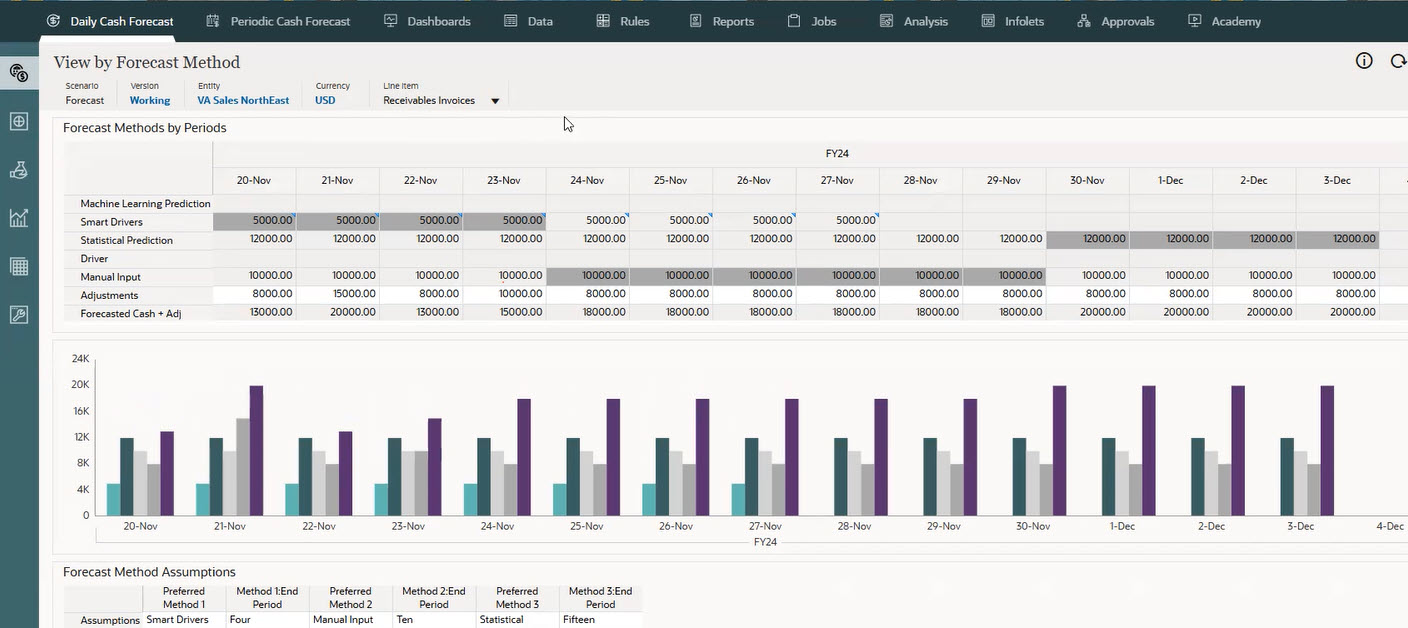
View by Forecast Method Dashboard
Business Benefit: The dashboard provides more information all in one view. It allows for what-if analysis, which can potentially change the forecast numbers for different line items. It also improves usability by allowing you to make line item adjustments and modify the forecast method directly in View by Forecast Method. Additionally, when you modify a forecast method for a line item and save the form, the rule runs only for that line item, which improves performance.
Key Resources
- Working with Predictive Cash Forecasting