Enhancements to the Touchpoints Manager’s Dashboard and Employee Details
The manager’s dashboard in Touchpoints has been enhanced with the following features:
Interactions Graph
A new Interactions graph now appears in the center of the manager’s dashboard, highlighting the check-ins that have been scheduled as well as feedback, recognitions, and awards that have been received in the last 90 days for each employee in a manager’s team.
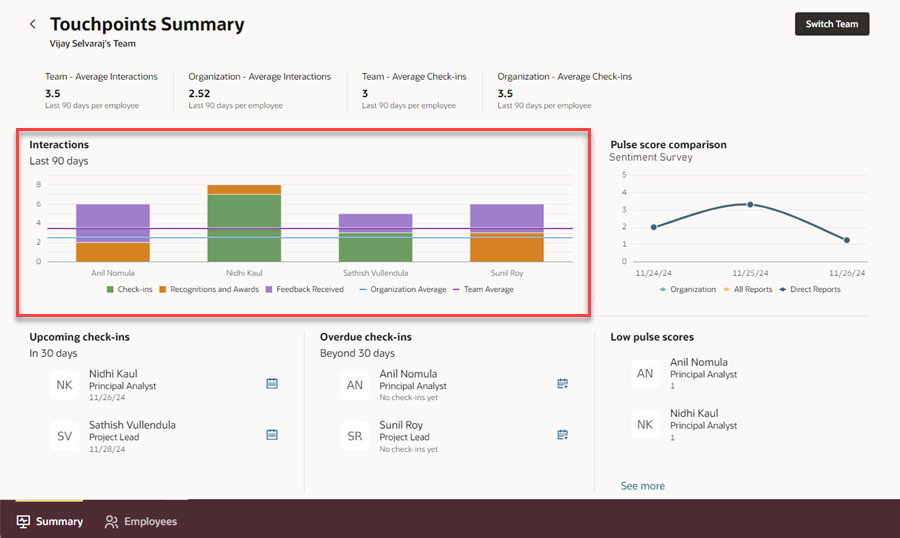
Manager's Dashboard
The Interactions graph can also be viewed as a list view by right-clicking on any bar on the graph. This opens up in a panel drawer, displaying the number of interactions for each employee, along with the team and organization averages.
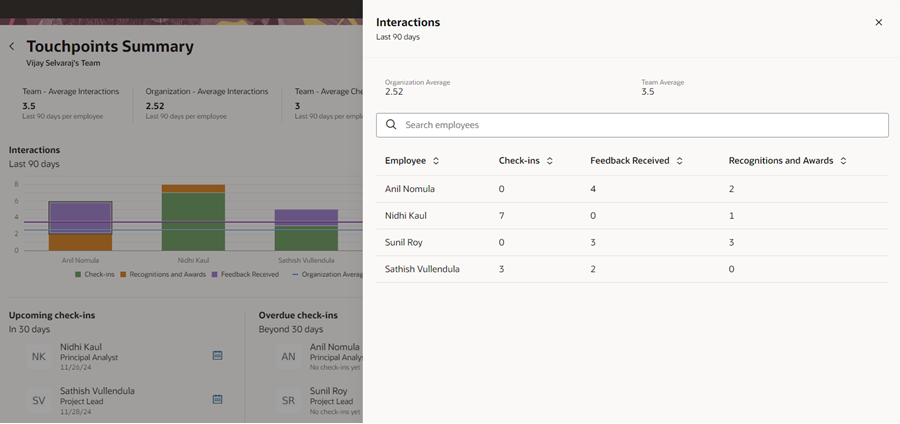
List View of Interactions Graph
You can sort this list by the employee name or any of the interaction types.
Pulse Score Comparison Graph Controlled by Analysis Period
The period for which the Pulse Score Comparison graph is displayed is now determined by the analysis period of the survey. If the analysis period is 2 months, then the survey scores are displayed for the past two months (from the current date). For example, if the survey has been running once a month for the last six months, only the last two months’ data will be displayed.
It’s recommended that you set the analysis period to match with the survey frequency so that the graph is rendered in a readable manner. For example, if the survey frequency is daily and you set the analysis period to 1 month, the graph will display the past 30 days’ data, but the graph will be difficult to read. So, for a daily frequency, it’s recommended to set the analysis period to 1 week or 7 days so that you can read the pulse survey trend easily.
When you change the analysis period for the survey, you need to run the scheduled process, Aggregate Oracle Touchpoints Data, with the Run Type parameter set to Full. This will ensure that the graph is refreshed with the latest data.
Upcoming and Overdue Check-in Sections
The Upcoming check-ins section displays check-ins that are coming up within a specific number of days. This value is configurable using a profile option, ORA_HRE_UPCOMING_CHECKIN_THRESHOLD. The default value is 30 days, which can be changed.
The Overdue check-ins section displays check-ins that are overdue by a specific number of days. This value is configurable using a profile option, ORA_HRE_OVERDUE_CHECKIN_THRESHOLD. The default value is 30 days, which can be changed.
These sections also display the active assignment name for each employee.
From these sections, you can directly schedule a check-in by clicking the Schedule Check-In icon next to each employee name, as shown here.
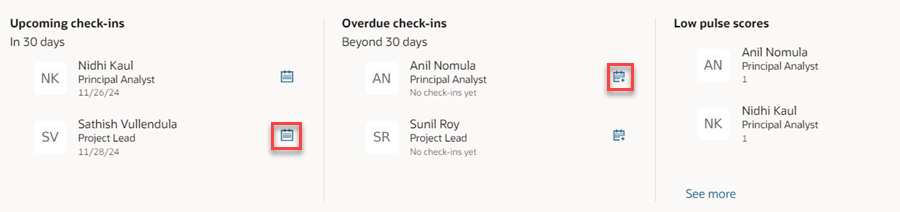
Schedule Check-ins Directly From Here
Low Pulse Scores Section
The Team pulse scores section has been renamed to Low pulse scores. If pulse scores fall below the threshold value defined in the Schedule Allocation tab of the survey configuration, they are considered as low.
This section also displays the assignment name for each employee.
Filters on the Employees Tab
The Upcoming check-ins, Overdue check-ins, and Low pulse score sections on the Summary tab display only the first three employees. To view the remaining employees, click the See more link. This takes you to the Employees tab with the corresponding filter (related to the section) automatically applied, where you can see the full list of employees who match the filter criteria. For example, when you click the See more link in the Upcoming check-ins section, the Employees page is displayed with the Upcoming check-ins filter automatically applied.
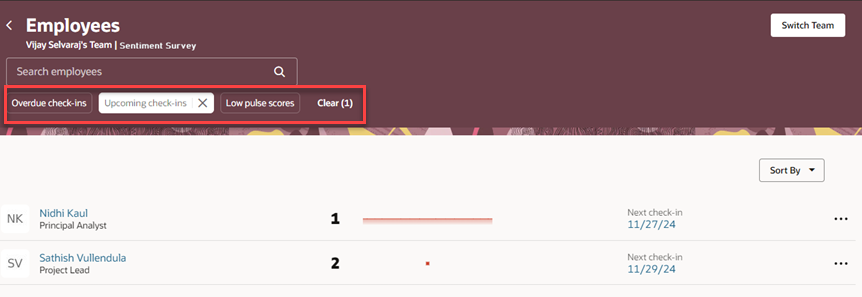
Filters on the Employees Tab
View Events and Interactions Timeline in a List View
The Events and Interactions timeline on an employee’s Touchpoints page can be viewed as a list, in addition to the existing chart view.
You can also sort the list by the type of interaction, in alphabetical order or the date of the interaction. By default, the list is sorted based on the type of interaction, from A to Z.
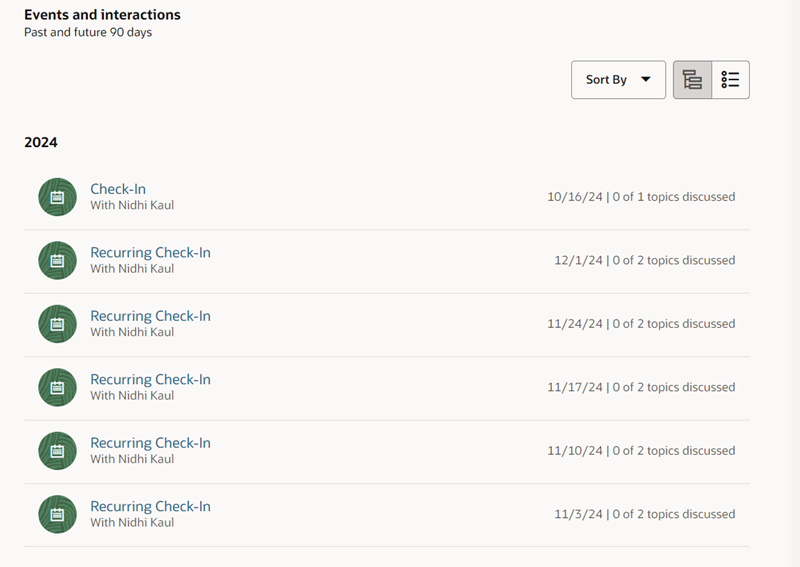
List View of Events and Interactions
These enhancements provide an improved user experience, making it easier to understand engagement levels and take actions based on them.
Steps to Enable
You don't need to do anything to enable this feature.
Tips And Considerations
The Check-ins pie chart has been deprecated from the manager’s dashboard.
Key Resources
Refer to these additional resources:
- Configure the Survey Frequency and Other Attributes
- 25A What’s New Touchpoints feature: Control Page-Level Features Using Page Properties