Additional Improvements to Redwood Experience
Providing a more intuitive and accessible product, the Redwood Experience enables you to easily navigate and utilize the powerful features and functionality that Oracle offers. We’ve added several improvements to the Redwood Experience including a new Refresh button in Dashboard Metrics, and new options for Outbound Performance Metrics.
REFRESH BUTTON - DASHBOARD METRICS
From the Redwood Experience, Operational Dashboard tab, we’ve added a new Refresh button in the top-right of the screen which now provides you easier flexibility to refresh data whenever you need to. For example, you can click the Refresh button to view receiving metrics throughout the day.
Refresh Button
You can refresh from the Inbound Performance and Outbound Performance screens.
From the Order Cycle Time metrics screen, the Refresh button is available from the Actions drop-down menu:
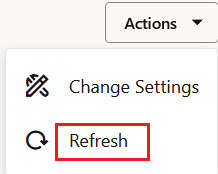
Actions Drop-Down
OUTBOUND PERFORMANCE METRIC
We’ve added an Outbound Performance tab that will include the several performance metrics. In the center of the Dashboard, you can view the current Open Tasks:
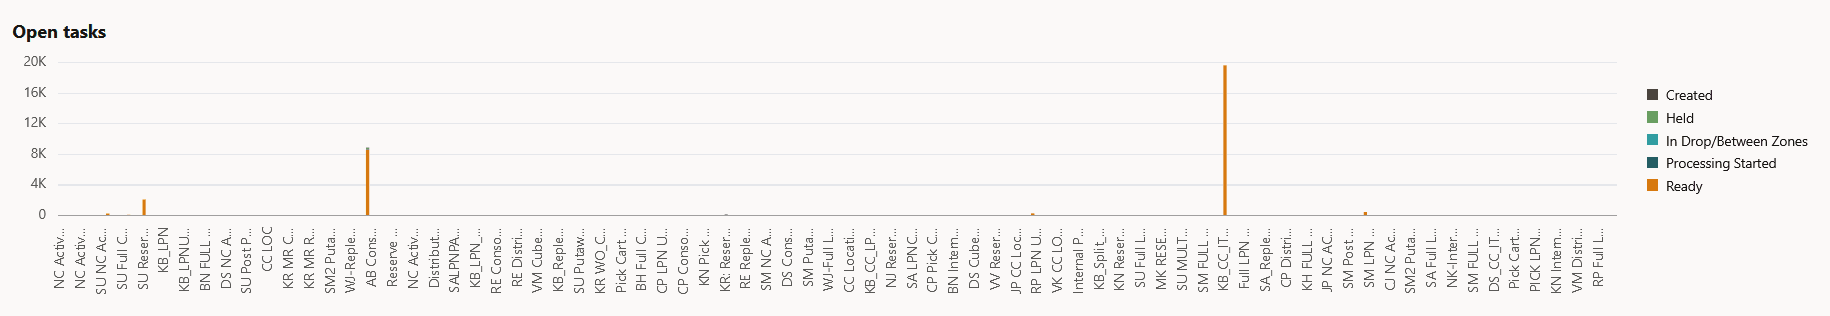
Open Tasks
The metrics are calculated and viewable by task type. Each bar represents a task type, and task type colors are indicated in the legend to the right.
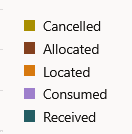
Task Type Colors
You can view the Orders to be shipped today:
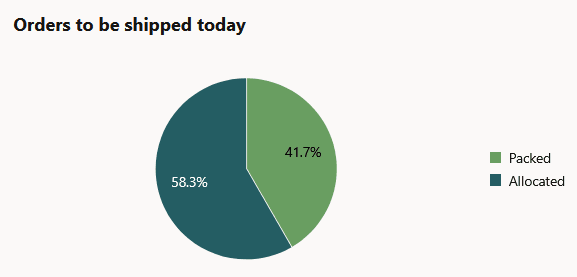
Orders to Be Shipped Today
This graph will include orders with a Required Ship Date listed as Today.
You can view Outbound LPNs by Status:
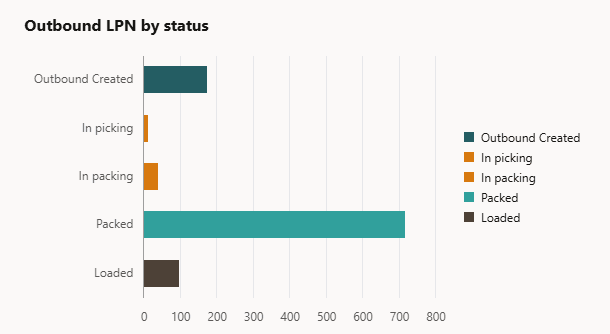
Outbound LPNs by Status
ORDER FILL RATE
You can view the Order Fill Rate according to the day. So based on the Required Ship Date, you can view the percentage of Shipped orders out of the total number of orders.
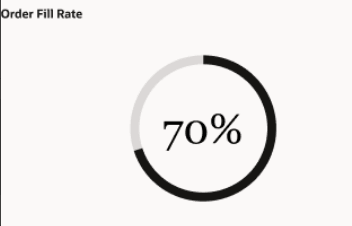
Order Fill Rate
NOTE: This number will not include cancelled orders.
Steps to Enable
- To access the Redwood Experience, click the user drop-down menu in WMS, and select Try the new Redwood Experience option. A new tab will open up with the new redwood experience. The Home page gives you quick access to useful links like User Guides and Release Content.
- Click the Operational Dashboard tab to access the available Dashboard Metrics.
- To see a Quick Tour video with more details, click the Get Started tile from the Redwood UI Experience Home page.