Redwood: Optimize Pick Locations with Reslotting Workbench
We’re introducing a new Reslotting Workbench which allows you to realign inventory pick locations based on current Item velocity (ABC rankings). It identifies mismatches between item velocity and location rankings and generates replenishment tasks to re-slot the material. This helps to maintain optimal pick paths, reduce manual effort, and improve picking efficiency.
NEW RESLOTTING WORKBENCH UI
The intuitive Reslotting Workbench (UI) is designed to help warehouses optimize inventory placement based on product velocity, seasonality, and demand patterns. This new UI will help improve operational efficiency by reducing picker travel times and congestion with smarter inventory placement.
You can view important location and item details and Key Performance Indicators (KPIs) all in one Workbench style display:
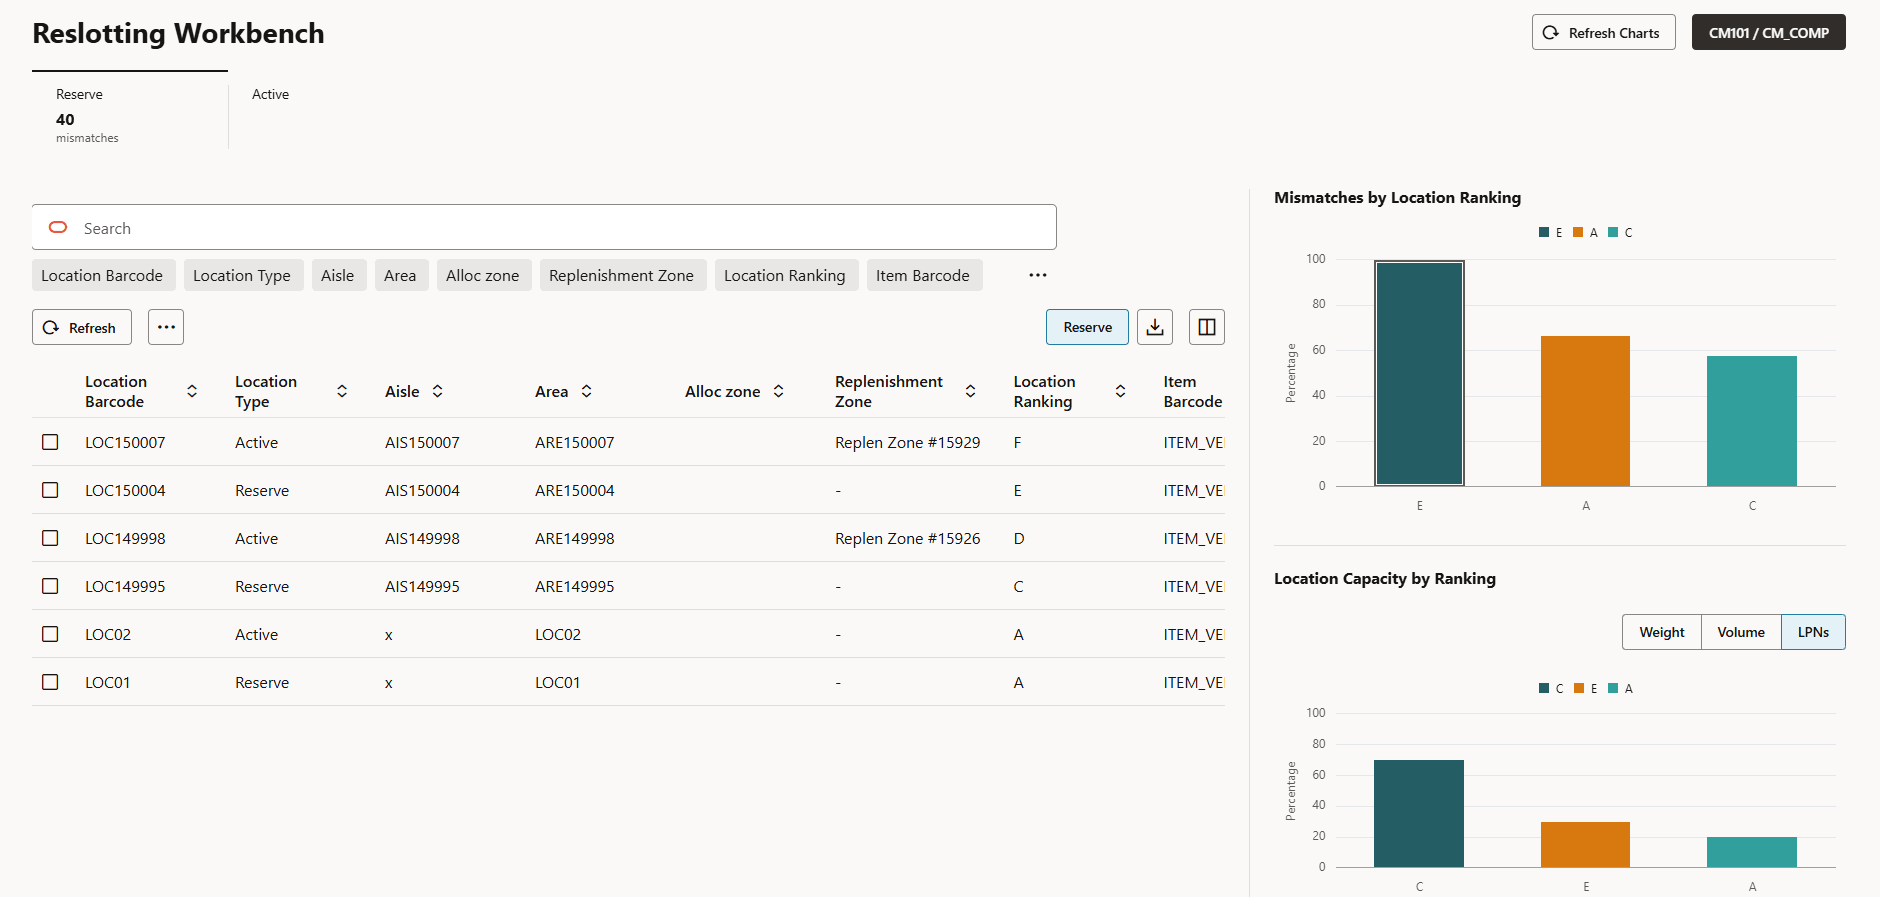
Reslotting UI with Location Ranking and Location Capacity Display
On the left side, the UI includes a user-friendly data grid where you can Search, filter, and sort by critical fields such as Location, Ranking, Item, Facility, Inventory Cost, and more.
NOTE: For the Workbench Graphs, we will only allow up to 6 rankings to be displayed on the graph.
VIEWING THE GRAPHS
When you are viewing the Workbench Graph KPIs / Location Capacity by Ranking, you can toggle between 3 metrics.
- You can view Active Locations metrics by: Volume, Weight, Units
- You can view Reserve Locations metrics by: Volume, Weight, LPNs
NOTE: The colors for the bars on the charts will always display in the same order. (i.e. green, orange, teal.) The colors are not based on their Ranking.
INITIATE RESLOT MOVEMENT ACTION BUTTON
The Initiate Reslot Movement action button will create a request in order to send the selected records to a drop location. This button is permission-based.
GENERATE NEW REPORT
You can click Generate New Report to run a new report with all of the Reslotting details from the Workbench UI for further analysis. You will see a buffering icon while the new report is being generated. You can click the CSV Export button to download to CSV format.
NOTE: Only users with supervisor-level permissions can invoke it.
LOCATION RANKING FIELD ADDED TO LOCATION UI/PATCH API AND INPUT INTERFACE
We’ve added a new report GET API that will generate the Reslotting Workbench metrics in a stacked bar chart format. This will display Location data such as volume, weight, and LPNs.
CONFIGURATION FOR VELOCITY CODE AND LOCATION RANKING
To configure an item’s Velocity Code Ranking, use the Item-Facility Velocity Code field in the Item Facility UI. This value can be set Manually, via Init Stage API, or Input Interface upload.
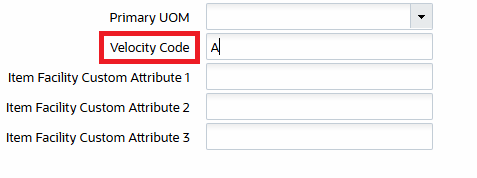
Velocity Code Field
To configure an item's Location Ranking, use the newly introduced Location Ranking field on the Locations UI. This value can be set Manually, via Init Stage API, or Input Interface upload.
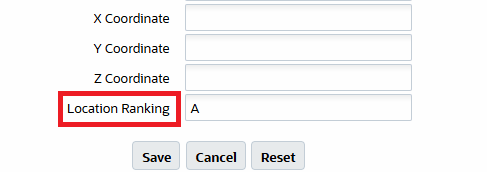
Location Ranking Field
NOTE: For the Location Ranking and Item Velocity Code Ranking to work, they both MUST match in naming convention.
FOR EXAMPLE:
- Item Velocity Codes: A, B, C, D and Location Rankings: A, B, C ,D or
- Item Velocities: Hot, Fast, Medium, Slow and Location Rankings: Hot, Fast, Medium, Slow.
LOCATION CAPACITY METRICS GET API
We've added a new Location Capacity Metrics GET API which will generate and display in a stacked bar chart the following:
- How much capacity is available per location ranking and per filter (max weight, volume or lpns (reserve only)).
- x axis = location ranking, y axis = % of capacity filled by mismatches
API URL
GET... /lgfapi/report/reslotting_location_capacity_metrics?metric={metric}SAMPLE RESPONSE
[
  {
    "rank": "A",
    "total_item_metric": 100.0,
    "max_metric_by_ranking": 150.0
  }
]
CREATE INVENTORY ACCURACY METRICS GET API
We’ve added a new reporting GET API that will generate the following Reslotting Workbench accuracy metrics in a stacked bar chart:
- The percentage of Items in locations where item_velocity_code = location_ranking
- How many items are in each location rank, how many are correctly vs incorrectly slotted
- The fields used are: SKU, item_velocity_code, location, location_ranking
- x axis = item count, y axis = location rank
- The fields used are: SKU, item_velocity_code, location, location_ranking
API URL
GET... /lgfapi/report/reslotting_inventory_accuracy_metricsSAMPLE RESPONSE
[

  {

    "rank": "A",

    "accurate_qty": 50.0,

    "total_qty": 100.0

  }

]
Steps to enable and configure
To access the Reslotting Workbench:
- From the User drop-down, select -> Try the new Redwood Experience.
- After the Redwood screen opens, click the Home with Ask Oracle button in the bottom right.
- Select the Putaway and Slotting tile, then Reslotting.
VELOCITY CODE AND LOCATION RANKING
- To configure an item’s Velocity Code Ranking, use the Item-Facility Velocity Code field in the Item Facility UI. This value can be set Manually, via Init Stage API, or Input Interface upload.
- To configure an item's Location Ranking, use the newly introduced Location Ranking field on the Locations UI. This value can be set Manually, via Init Stage API, or Input Interface upload.