SQL Performance Monitoring
The SQL Performance Monitoring enhancement is comprised of a set of SQL performance monitoring and diagnostics tools that have been designed specifically for customer-created or custom-invoked SQL. These features allow you to view explain plans, track performance history, and get actionable reports for all your saved queries, integration saved queries, and agent actions. These features make it easier to identify and address slow or problematic SQL statements before they impact system performance.
To support a smooth transition and minimize disruption when using the new SQL Performance Monitoring functionality, the functionality is introduced with a set of Optional Features, allowing you to disable the new capabilities if any unintended issues should arise.
The SQL Performance Monitoring related Optional Features include the following:
- ANNOTATES CUSTOM SQL: If opted out, category/use case hints are not applied to customer SQL. Support for implicit SQL is not available in SQL Performance monitoring.
- SUPPORT SQL PERFORMANCE IDs: If opted out, SQL IDs are not persisted with Saved Query, Integration Saved Query or Agent Action Details data. Collect SQL Performance is limited to showing cursor and AWR cache statements annotated by OTM.
Note: When opted in, internal updates to the UPDATE_DATE and UPDATE_USER are made to the SAVED_QUERY and AGENT_ACTION_DETAILS table that may impact external processes dependent on these columns.
- SUPPORT SQL CACHE MONITORING: If opted out, Collect SQL Performance is limited to showing a priori plans for explicit SQL. The cursor and AWR cache queries are suppressed.
Note that SUPPORT SQL CACHE MONITORING depends on ANNOTATES CUSTOM SQL.
Key Feature Elements:
Types of Customer SQL Monitored
- Explicit SQL: Your custom SQL statements entered directly in Saved Queries, Integration Saved Queries, or Direct SQL Update agent actions.
- Implicit SQL: Ad hoc queries generated by entering search criteria (Query By Example). These may result in complex SQL that can impact performance.
Identifying Your Queries
- Each custom query is annotated with a comment in the SQL text, making it easy for you (and support) to identify which SQL belongs to which business process when viewing performance data or reports.
SQL Validation
- When entering custom SQL, new validation checks will:
- Report syntax errors as you compose SQL.
- Show you an “explain plan” with performance tips, such as missing joins or problematic logic.
Performance Tracking and Storage
- Every explicit SQL statement is assigned an SQL_ID for tracking.
- Performance and execution data is collected from two sources:
- Cursor Cache: Holds stats for recently run SQL.
- AWR (Automatic Workload Repository): Provides historical performance and explains plans for top SQL statement.
QL Performance Dashboard (Finder)
- A new SQL Performance finder lets you:
- Search for all your custom/ad-hoc queries.
- View their historical performance and theoretical execution plans.
- Drill down for optimization suggestions.
- View the full SQL statement.
- Saved Queries, Integration Saved Queries, and Agents have a direct link to view performance.
Metrics & Alerts
- Improved metrics highlight slow or high-resource queries over time.
- You can easily set thresholds to trigger alerts for prolonged poor-performing queries.
Security & Access
- Functional security is based on the Sql Performance role. Users with this role have access to the performance finder, actions and servlets. By default, this role is granted to ADMIN.
- Only users with advanced privileges (DBA) have access to SQL Performance for records without a use case or a use case in the PUBLIC domain.
New UIs
Collect SQL Performance
This page is accessed via Configuration and Administration > Process Management > Collect SQL Performance.
This process runs at regular intervals to collect data on SQL performance. It will read explicit SQL, which includes the AWR cache, cursor cache, and any custom SQL (saved queries, integration saved queries, or direct SQL updates) that your users may have entered or activated. You can then use this data to help troubleshoot poorly performing SQL by using the SQL Performance UI and the related actions - shown below.
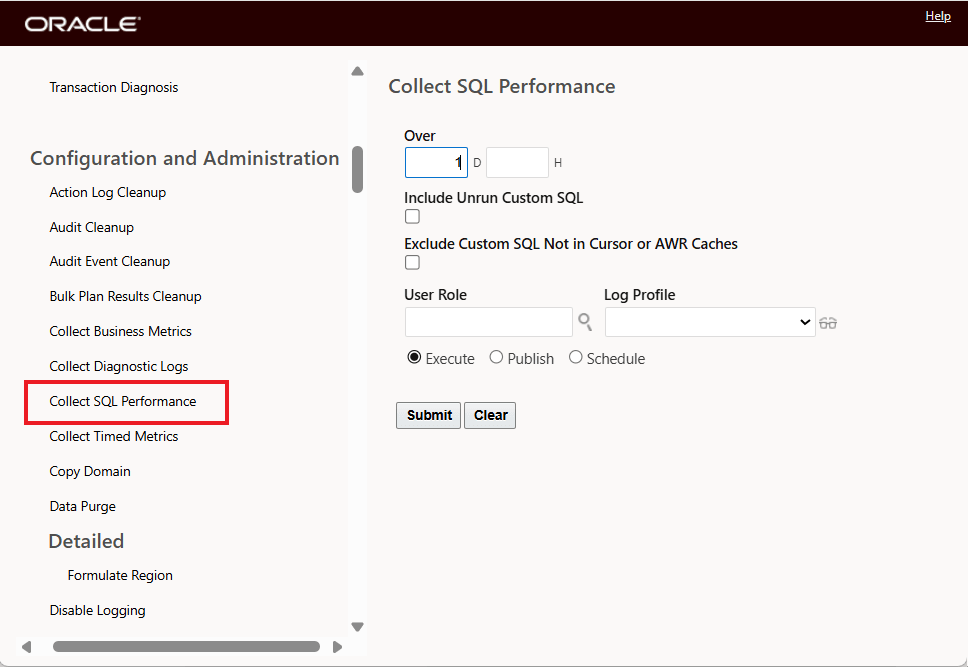
Collect SQL Performance
SQL Performance - Finder and Viewer
This page is accessed via Configuration and Administration > Technical Support > Diagnostics and Tools > Database > SQL Performance.
The SQL Performance Finder and Viewer lets you search for SQL queries that perform poorly. It allows you to search for particular categories of queries and view their theoretical or historical performance. Alternatively, you can sort all explicit and implicit SQL by execution time, rows processed, or number of executions, looking for problematic statements. It uses the data collected by the Collect SQL Performance process mentioned above.
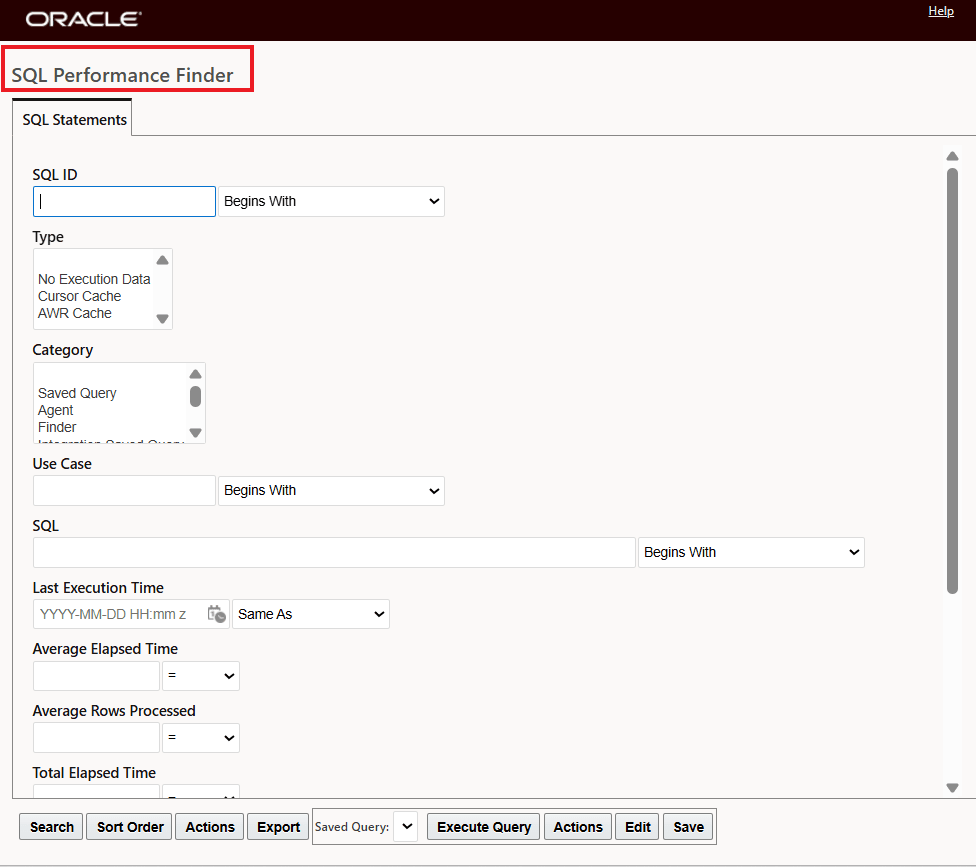
SQL Performance Finder
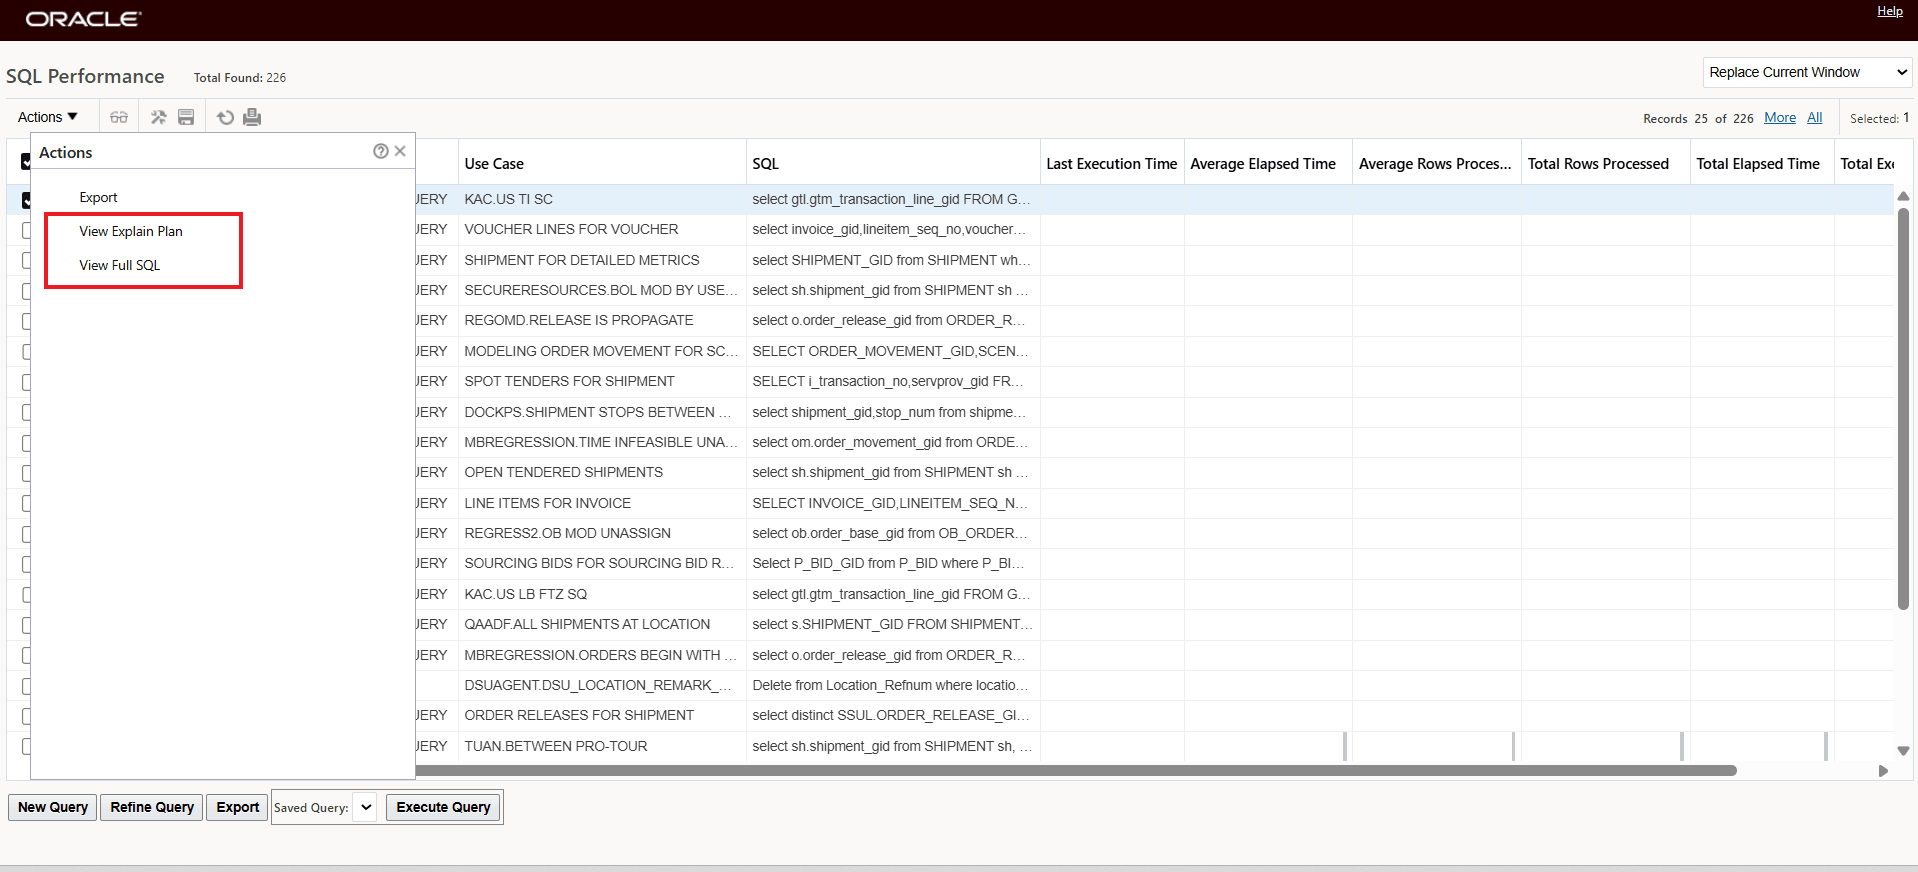
SQL Performance Viewer and Actions
Business Benefit: This feature gives you the ability to proactively verify, monitor, and optimize your custom SQL in the application, helping to avoid outages and performance surprises—using transparent dashboards, historical tracking, and actionable insights tailored specifically for your queries.
Steps to enable and configure
You don't need to do anything to enable this feature.
Tips and considerations
Best Practices
- Use validation before deploying new SQL to avoid future issues.
- Check the SQL Performance dashboard to proactively monitor and improve performance.
- Performance data for ad-hoc queries is collected only when certain thresholds (time, rows) are met, reducing clutter.
Key resources
See the About SQL Performance Monitoring topic in the online help.