Application Duration and Status Report
The Health Metrics BIP report helps customers identify potential blockages throughout their agency-defined, end-to-end application lifecycle. There are several metrics that are tracked:
- Application In Count: the number of applications that have a particular status during the reporting time period. For example, when an application goes into Review status.
- Application Out Count: the number of applications that leave a particular status during the reporting time period. For example, when an application goes out of Review status.
- Backlog: the number of applications that remain in a status during the time period. Essentially, this is the difference between applications in and out, in addition to carry-over backlog counts from previous reporting periods. The backlog count can help identify potential workflow blockages.
-
Average Duration: the average number of days that an application will take to complete for a specific status. For example, an average of 3.5 days in Review status indicates that it takes an average 3.5 days for all applications to be completed.
In addition, the embedded graphs illustrate the trends in the underlying changes in the metrics, as shown below:
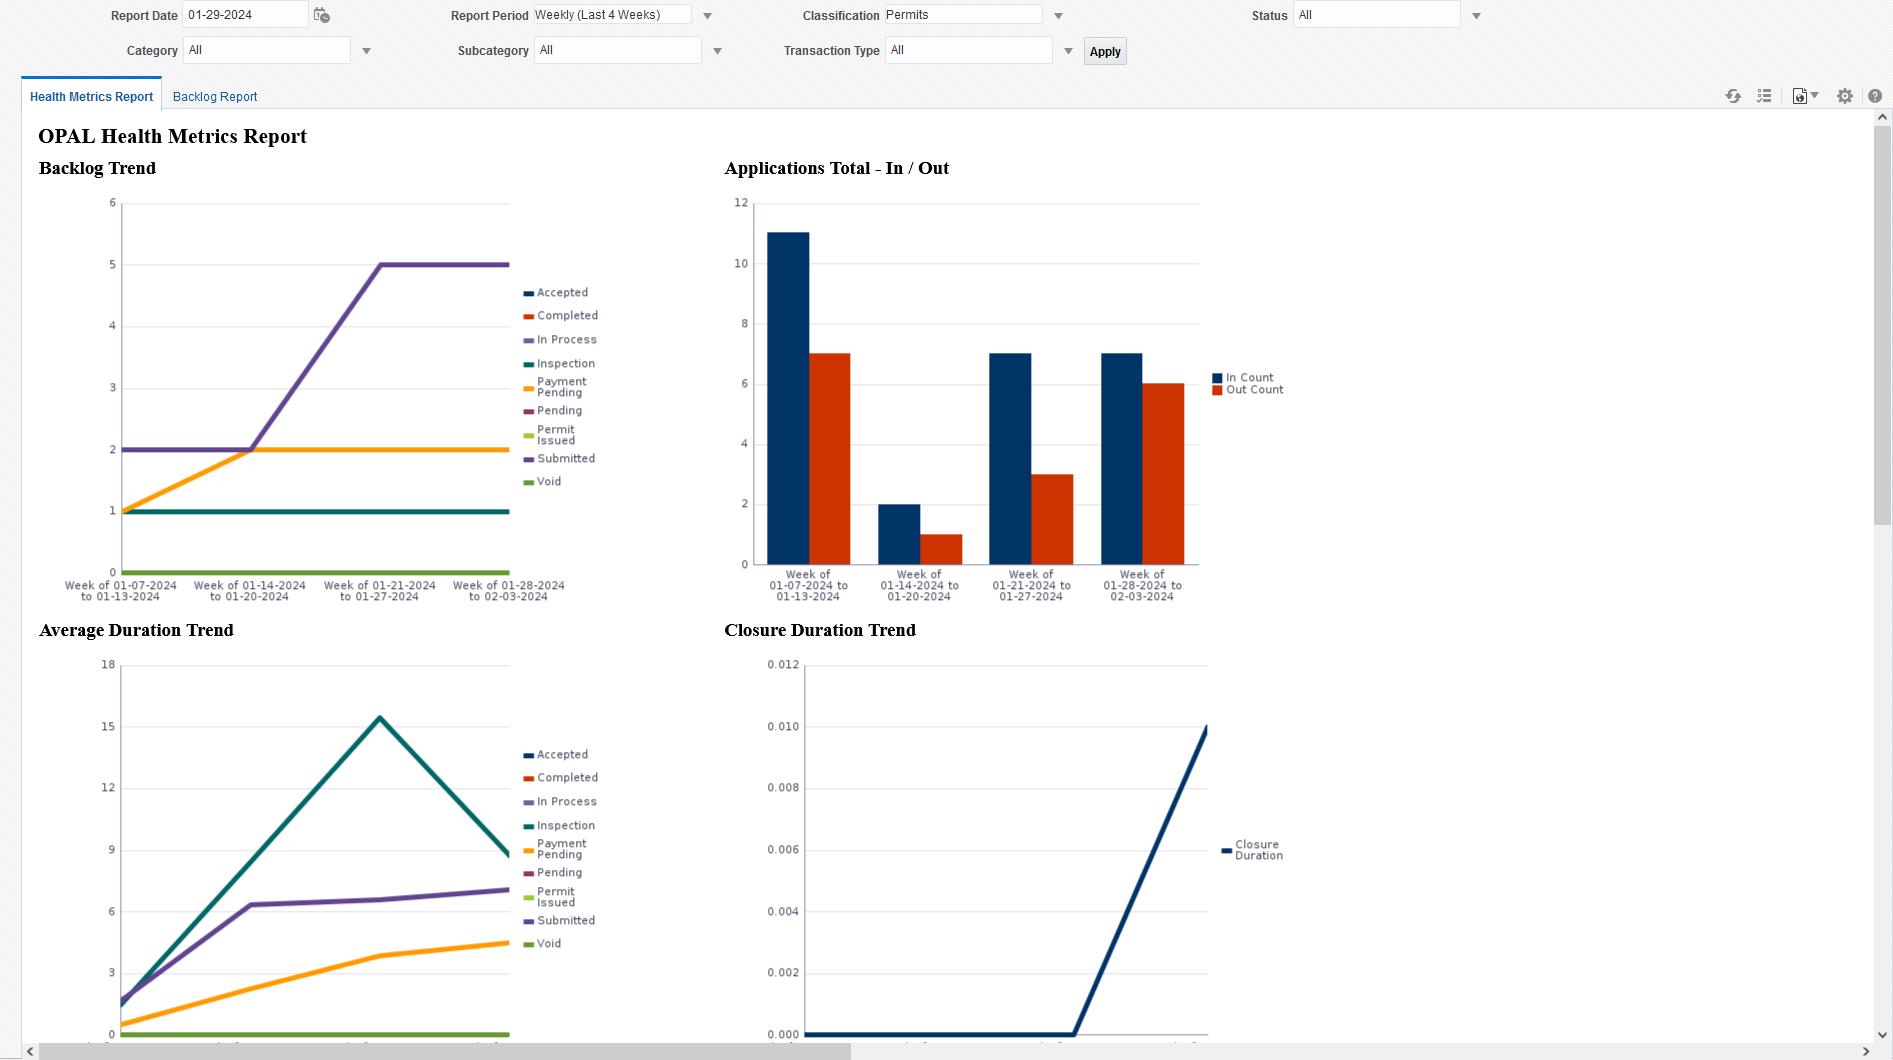
Health Metrics Report
This report surfaces the key metrics that impact the application life cycle and take early corrective actions.
Steps to Enable and Configure
You don't need to do anything to enable this feature.
Tips And Considerations
This report is available in the BI Catalog and should be run from the BI Portal.
You can limit the data using the prompts provided in the report. Date range for the chart data is calculated based on the report date and report period. Report period can only be 'Last 4 weeks' or 'Last 4 months'. For example, if you select 4 weeks, then From Date = Start of the week for (Report date - 4 weeks) and the To Date = End of the week for (Report date).
Key Resources
- See Implementing Your Agency, "Setting Up Analytics," Setting Up Reports on the Oracle Help Center.