Redwood: Use Pivot Tables to Analyze Plans Using a New User Experience
You can use the pivot table component in the Redwood user experience to help you identify data relationships and find the root causes of planning problems. You can display measure data at the intersection of plan dimensions (such as item, organization, customer, supplier, demand class, and time), and quickly switch dimensions between columns and rows to focus on a subset of data or aggregate the values to a level.
Pivot tables provide a convenient way to make updates in the right plan scope and level of detail, or link to other page layouts, tables, or graphs in context. They also enable copy and paste through Microsoft Excel for desktop integration and reporting.
Insightful and in-depth planning and analysis
The pivot table provides you with a rich set of features and tools to analyze planning data and modify and adjust planning data in order create the best planning outcomes. It’s a visualization that can be added to a Supply Chain Planning page. Existing tables created in the classic experience are available in the content library. You can also create and configure a new table on the planning visualizations page.
Pivot table Toolbar Actions
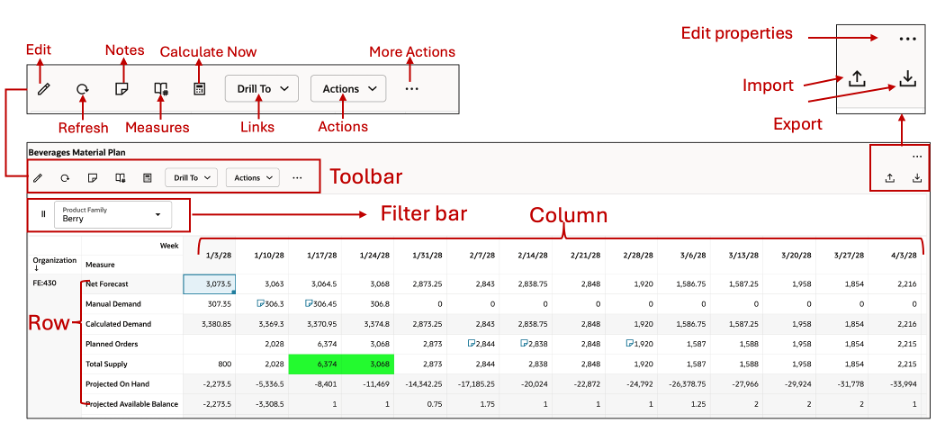
Edit measures in a Pivot table
The pivot table includes both editable and non-editable measures. For editable measures, you can modify cell values by selecting one or multiple cells and using the Edit icon in the toolbar.
- Single cell editing: Enter the value directly into the cell.
- Multi cell editing: Select one or multiple cells, then either right-click and choose the Edit option from the context menu or click the Edit icon in the toolbar.
Edit Action
Click and drag the lower right corner of the cell to extend and fill values across multiple cells, similar to a spreadsheet.
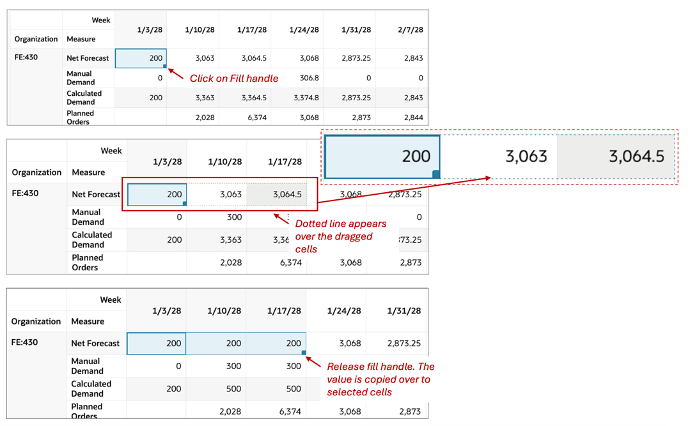
Editing Multiple Cells
The edit can be a user-specified value or a relative numerical condition:
- Set value to: a user-specified number. All selected cells are changed to this value.
- Increase by / Decrease by: a user-specified number. The changed cell value increases or decreases by the value entered using this option.
- Increase by / Decrease by percentage: a user-specified number. The changed cell value increases or decreases by the percentage entered using this option.
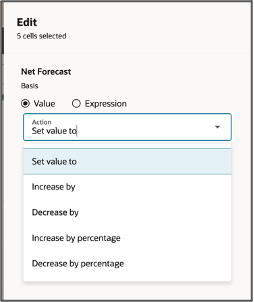
Edit By Value
You can also create a one-time expression to derive a value. This may be useful when measures have a relative dependency or when applying an arithmetic formula.
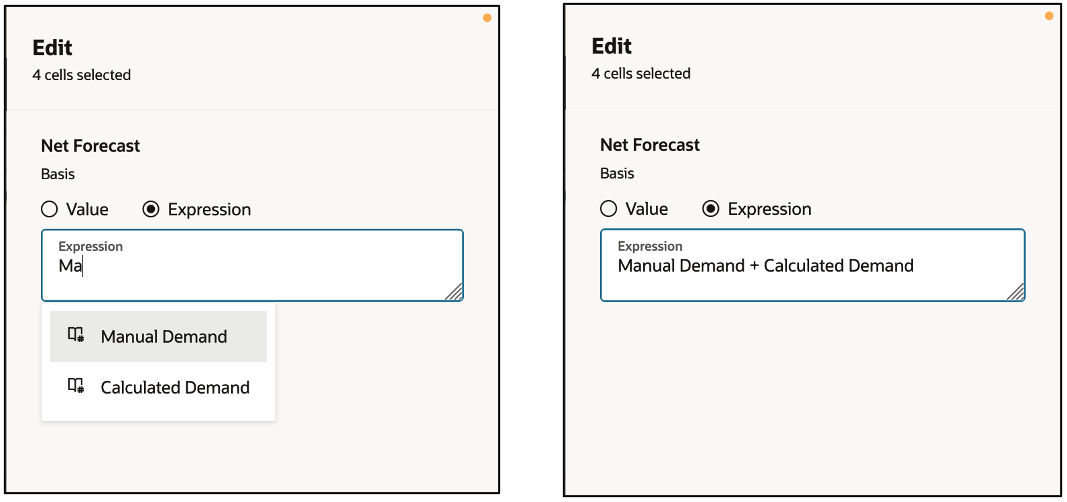
Setting up an Expression
You can set up an expression using a combination of mathematical operators and/or any of the measures currently available in this table. You can see the measures and available operators as you type along.
In the example, the Net Forecast is a sum of Manual and Calculated Demand.
You can use the following basic arithmetic operators in expressions:
- + (Sum) - Plus sign for addition. Example: Net Forecast + 100
- - (Minus) - Minus sign for subtraction. Example: Total Demand - Manual Demand
- / (Divide) - Divide by sign for division. Example: Safety Stock / Projected Available Balance
- *(Multiply) - Multiply sign for multiplication. Example: Safety Stock Qty * Price
- = (Equals) - Equal sign, indicating the same value.
You can use the mathematical operators along with the following operators in an expression:
- IF: Evaluates each WHEN condition and, if met, assigns the corresponding THEN expression value. If no conditions are met, the default value from the ELSE expression is assigned.
- AND: Represents an intersection of multiple conditions to form a compound condition, denoted by the ‘&’ symbol.
- OR: Represents a union of multiple conditions to form a compound condition, denoted by the ‘||’ symbol.
- NOT: Specifies that a condition is not met.
- SUM: Calculates the total by adding all values that satisfy the numeric expression argument.
- CUM: Computes the cumulative sum of values in a time series.
- LAG: Returns the lagging value of a specified measure based on the number of lowest-level time buckets in the table definition.
- POWER: Multiplies a given measure exponentially by a specified factor.
-
Here are some examples of expressions with these functions:
- If ( Manual Demand < Net Forecast , Net Forecast * 0.5 , Manual Demand )
- Cum(Net Resource Availability)
- Lag(Total Demand,4)
Refreshing the table
You can refresh the table to display the new data available. For example, use this option if you’ve imported data into the pivot table or if you want to reset any changes done to the display layout of the table. Refresh clears any column filters on the table and resets it to the original state.
Adding notes
You can add, edit, or delete notes in a Pivot table to document and communicate important information about the plan. This can be defined for any entity represented in the Pivot table. You can create a note for:
- Cell Level notes for measure data
- Column header
- Row header
To create a note at a level member, select the level member, and select the Notes icon. Use the Notes option to view, edit, or delete an existing note.
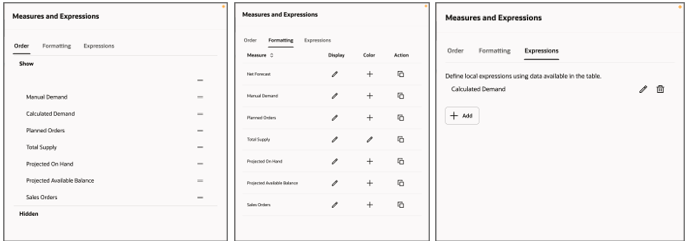
Display of Measures in a table
You can now format measures, manage measures and do reordering of measures in the table from Measures and Expressions drawer.
You can perform the following actions using the measures icon. Opening the measures icon brings up the right drawer, which contains three sections:
- Change the display order of measures and show or hide measures in the table.
- Adjust the display formatting of a measure, including:
- Modifying its display properties.
- Applying conditional formatting based on a criterion.
- Duplicating a measure.
Create a calculated measure using an expression based on table data, arithmetic operators, and functions, similar to a spreadsheet formula. These calculated measures are specific to the table, evaluated at the same dimension levels, and not available in other tables.
Displaying Measures
Changing the display order of the Measures
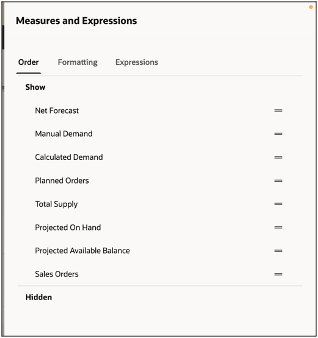
Display Order
Use the Show and Hide sections to include or remove measures from the Pivot table respectively. To hide the measure from displaying on the table, use the handlebars to move the measure to the Hidden section.
Change the bars icon to reorder the measures.
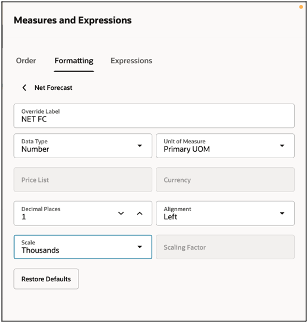
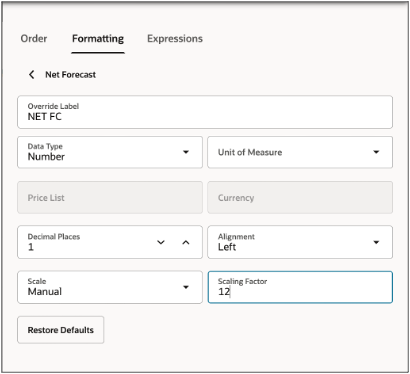
Formatting the measure’s properties in the pivot table.
By default, display formatting settings are inherited from the measure definition, but you can override them for this table. Even if you are not the table owner, you can customize the display to match your preferences. In that case, the initial settings will be based on the owner’s configuration. Here, you can:
- Override the measure label. Example: Rename Net Forecast to Net FC.
- Change the data type to Number or Currency.
- Define the number of decimal places for display.
- Adjust the alignment of the measure within the cell (Left, Right, or Center).
- Set the scale of the measure, such as Units, Hundreds, or Thousands.
Formatting Properties of a Measure
Scaling factor
You can also apply your own scale for the measure. In the scale, select Manual. And in the scaling factor assign a scale. You can select the desired Unit of Measure. If a measure has multiple Unit of Measurements , you can use those. Select Restore Defaults to restore the default values.
Scaling Factor
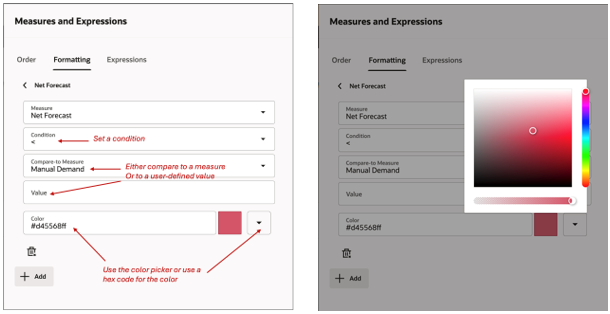
Configure conditional formatting for a measure
You can use conditional formatting to change the background color of a cell to highlight a specific condition of the cell. For the selected measure, set a condition by comparing it with another measure or a specific value. Choose a color from the color picker or enter a hex code.
Apply one or more conditional formats to the measure. Use the +Add button to add additional conditions.
Conditional Formatting
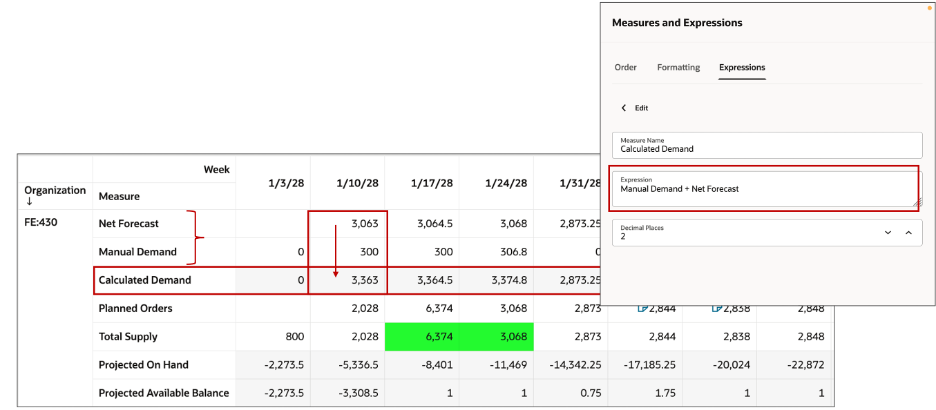
Configure user-defined expressions
You can create your own measures with a numerical expression and save them in a pivot table. The table expression used to create a measure can be a numerical expression, a measure-based expression, or a combination of both. For example, the measure Calculated Demand is defined using the expression: Manual Demand + Net Forecast.
The created measure can’t be used in other expressions and can’t have conditional formatting. However, its display order in the table can be adjusted. These measures are not editable. The functions and operators can be used to define a table expression.
User-Defined Measures
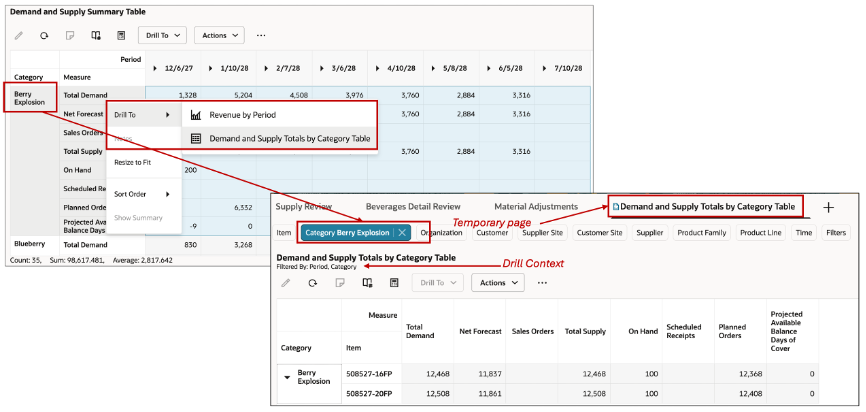
Drilling to a linked table to a page or graph
To enable insight discovery in planning and analysis, you can use the drill to feature that allows you to drill-to a linked Table, Graph or Page. With this you can get an in-depth view of your planning data in the following scenarios:
- Drill to another visualization (table or graph) on the same page.
- Drill to another visualization that isn’t present on the same page. This opens a temporary page containing the target visualization and is identified by a temporary page icon next to it.
- Drill to another page in another tab. This passes the search context that shows in the filter criteria. All visualizations on the page are refreshed when the linked page is opened.
- Drill to another page that is not open in the current session. Dynamically a new tab is opened and filtered by the search context. You can see the drill context visible in the header of the opened page.
Drill To a Linked Table
Toolbar Action Menu
Audit trail
For more details Refer to the What’s New section for the 25B feature, “Redwood: View the Audit Trail of Measure Updates Using a New User Experience.”
Drill Settings
You can set drill setting in the table to expand and collapse the levels across hierarchies and you can view different levels of aggregation.
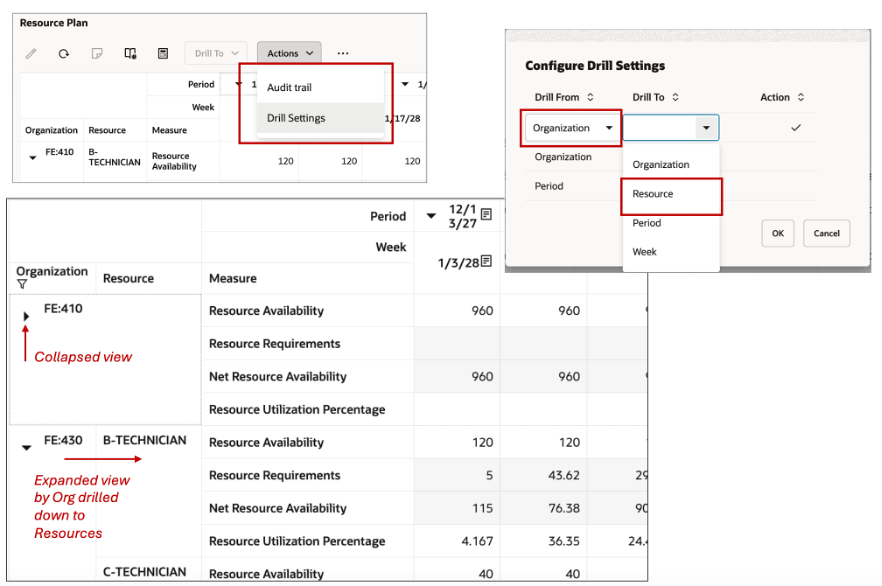
Drill Settings
In the example above, a drill setting is created with a Drill from Organization to Resources. In a resources plan table, the organizations resource related measures can now be viewed either collapsed or individually expanded by each resource.
Sorting a Pivot table
When working in a table, you can sort the data in ascending or descending. For example, the Sort Order menu option allows you to sort time members in either ascending or descending order.
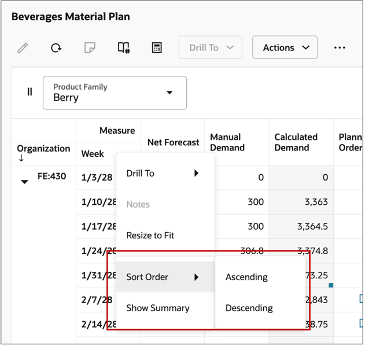
Sorting
Hover over the column header to enable a Sort arrow with a tooltip that shows how the column is sorted. Clicking on the arrow toggles the sorting option between ascending and descending.
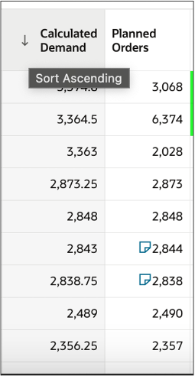
Sorting a Column in Ascending or Descending Order
Sorting on columns works differently while sorting the data columns vs. member columns. Data columns are sorted when the table has only measures as column headers, with no other levels.
When sorting other columns, such as Items, the sorting is done within their parent level, such as Category. Sorting a column adjusts the order across the entire table, so the display order of members does not remain the same..
Resetting the layout of the table
The Reset Layout action resets to the default layout. All changes applied to the previously saved layout are restored. The saved layout is unique to each user.
Pivot Table View Menu
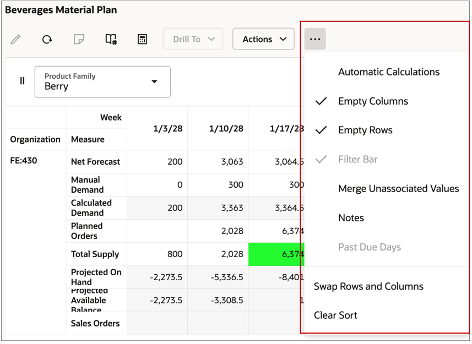
Pivot Table View Menu
Automatic Calculations: When using this action for editing, calculations for dependent measures are performed automatically. By default, this action is disabled for supply plans and enabled for other plan types.
Empty Columns: Select this option to hide the empty columns to focus on columns with measure data. All the cells of the column must be empty.
Empty Rows: Select this option to hide the empty rows to focus on rows with measure data. All the cells of the column must be empty.
Filter Bar: Select this option to enable the filter bar that appears at the top of the table. You can drag and drop dimensions levels (column and row) headers into the filter bar and use that as a basis for filtering.
- Select the member (Dimension - Product, Org, Time or another dimension) and drag and drop it on the filter bar.
- This enables the filter Dimension to be used as a filter for its members For example, when Organization is selected as a filter, a list of organization member values appear as filter criteria.
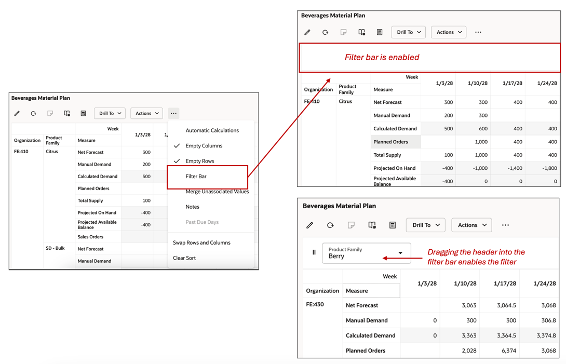
Enabling the Filter Bar
When you save the layout of the table, the option for display of filter bar is saved as part of the user's layout.
Merge Unassociated Values: The Show Unassociated check box in the data tab of the Edit Properties determines whether the measure values that aren't associated with a specific dimension in the table or graph are hidden or displayed.
For example, a table could include Net Forecast and Planned Orders measures and Organization, Category, Item, Customer as the levels. Customer level is relevant only for Net Forecast measure and not the Planned Orders measure. Here is how the data will be displayed with
- Show Unassociated unchecked for customer dimension
- Show Unassociated checked for customer dimension
This Merge Unassociated option allows for a more convenient and dense view of the table as shown:
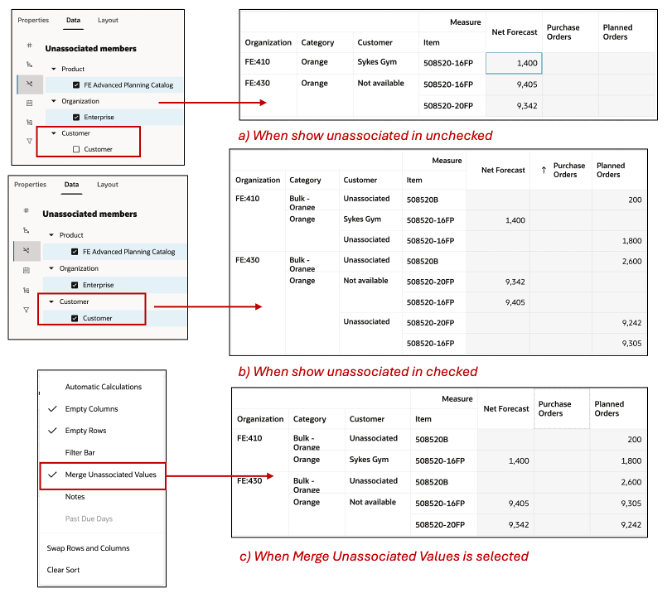
Merge Unassociated
- Notes: The notes icons are visible on the pivot table.
- Past due days: This setting is especially for the archived measures. You should be able to see the archived measures.
- Swap Rows and Columns: You can swap columns with the rows of the layout in the table. Nested columns and rows are maintained in the layout.
- Clear Sort: Select this option to reset any applied sorting and restore the table to its default order. This means that any custom sorting on columns, whether by measure values or member attributes, is removed, and the original display order is reinstated.
Exporting data from a pivot table
You can now export data from a plan into an XLSM file. To export data, use the Export icon at the top of a table.
Some important points to note are:
- The export includes only the columns that are displayed in the table.
- The notes related to the pivot table are not exported.
- The export corresponds to the sorted order if the table has been sorted. The export preserves the order in the exported spreadsheet, if user has sorted by date.
- The maximum number of cells in a pivot table to be exported is same as the limit for the table that is 500,000 cells. If you need to export more than this, use the option Export Data in Table Format from the More actions menu options.
Import data into a pivot table
You can import planning data into a pivot table from an external spreadsheet. All the rules that exist in the classic experience are applicable here also.
Some important points to note here are:
- The imported file must be a .xlsm file in the same layout and format as it was initially exported.
- Macros must be enabled in Microsoft Excel for some of the features to work.
- Only editable measures are updated throughout the import procedure.
- Dependent measures are also recalculated during the import process.
- The levels in the spreadsheet must be the same. The header columns don’t need to contain the level names, such as Organization or Item, but the columns and rows that correspond to the level must match.
- The table to be imported must have a symmetric structure, where all members at a given level are expanded consistently, ensuring the initial export is done with a symmetric display, and the imported members can be a subset of those in the plan.
- When the filter bar is applied the valid combinations that are in the import file are accepted and imported.
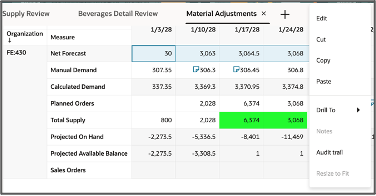
Cell level context menu options
You can perform the cell-level actions to change cell data in a Pivot table or to navigate away from the table.
- Edit: Edit a cell's content with a numerical value.
- Cut: Cut a single or multiple cell values to paste them into other cells
- Copy: Copy a single or multiple cell value to paste them into other cells.
- Paste: Paste the content of the clipboard to into editable cells
- From/To other cells
- From/To Excel
- Drill To another Page, Table or Graph. When enabled you can navigate away while retaining the content of the pivot table’s member data.
- Notes: Edit or review notes for a cell.
Resize to fit the width of the column to the cell’s content.
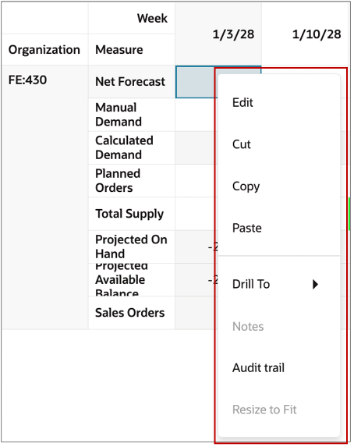
Actions on a Cell
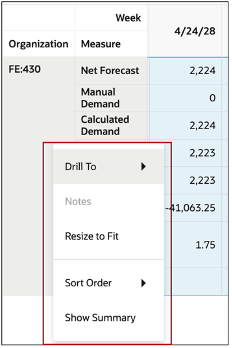
Column headers context menu
You can also perform actions on the column headers in a Pivot table.
- Drill to: Drill to another Page, Table or Graph. Navigate to another visualization with context.
- Notes: Create, edit, or review motes for the column header.
- Resize to fit: Resize the column width to the widest width required to show the cell level content adequately.
- Apply as Fixed Width: Applys the width of the selected column as the width for all displayed columns. This can be then saved as part of a user's layout for this table. This option is available for any member column such as Week, but not for measure columns.
- Sort Order: Sort the column in ascending or descending order
- Show Summary/ Hide Summary: This adds a column at the end of the table which shows the totals for the measures for each row. Use the ‘Hide Summary’ to hide when the summary is not needed.
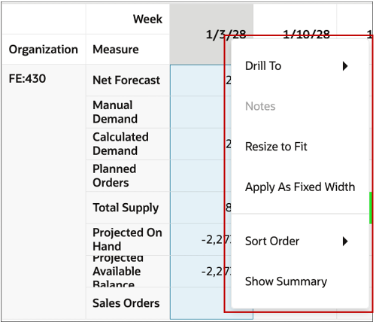
Actions on a Column Header
Row headers context menu
You can perform actions at row header level.
- Drill to: Drill to another Page, Table or Graph. Navigate to another visualization with context of the row header.
- Notes: Create, edit, or review notes for the row header.
- Resize to fit: Resize the row height to the tallest height required to show the content of the rows’ cells adequately.
- Sort Order: Sort the row in ascending or descending order.
- Show Summary: This adds a summary row at the end of the table that shows the totals for the measures for each column. Example below:
Actions on a Row Header
Pivot table Header Filters
You can filter based on column header. Depending on the type of column header, different filters are available:
For all member columns such as Organization and Item, clicking on the column name shows a filter menu with two parameters for selection, Is and Matches any.
Header Filter: Filter based on Category.
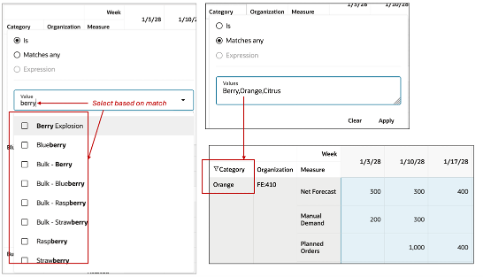
Pivot Table Header Filters
Measure filter
You can create a custom expression using one or more measures by selecting Measure, the title of all measure columns. This expression filters the table, displaying only the combinations that match your criteria. You can choose from any measures in the table and apply different expressions to refine the displayed data.
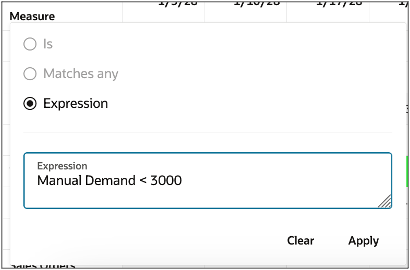
Measure Filter
Time Filter
You can apply time-based filters by selecting any time level column title such as Period in the table. These filters use date ranges with options such as equals, before, after, on or before, on or after, or between specific dates.
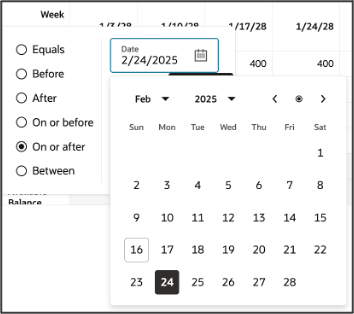
Time Filter
Other Pivot Table Interactions
- Adjusting column width: Double-click to automatically adjust the column width, resizing it to fit the widest content within the selection.
- Navigation Context Information for incoming drill - When drilling from another panel (Graph or table) to this pivot table, the navigation context as defined in the navigation link is displayed under the panel title. You can clear the context using the option Clear Context.
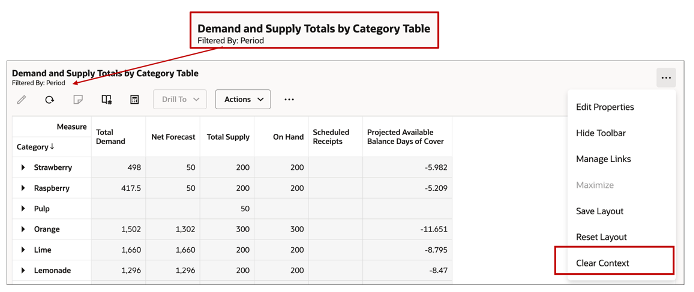
Clear Context
Page-Level Search
The page-level search applies to all visualizations on the page, including the pivot table. When you search for a specific product family, the pivot table filters the data accordingly, provided that level is available in the table. If the level is already part of the table's filter, the filter is refreshed to align with the page-level search.
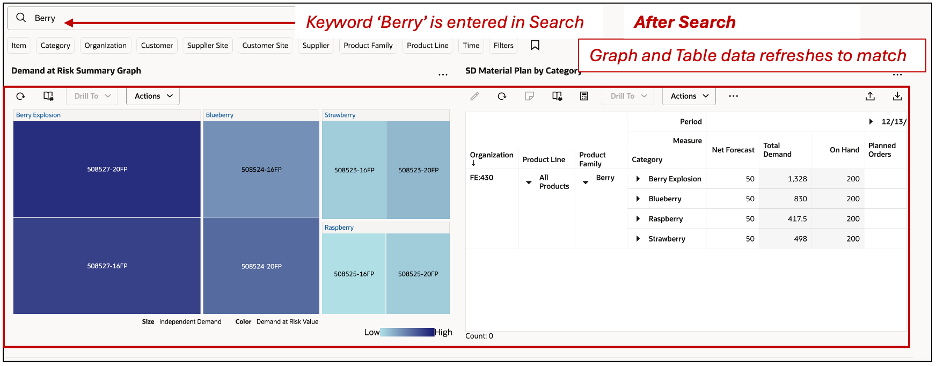
Page-level Search
If the table already has other filters at different levels such as Organization, then the search will use both, the page-search and the table filters.
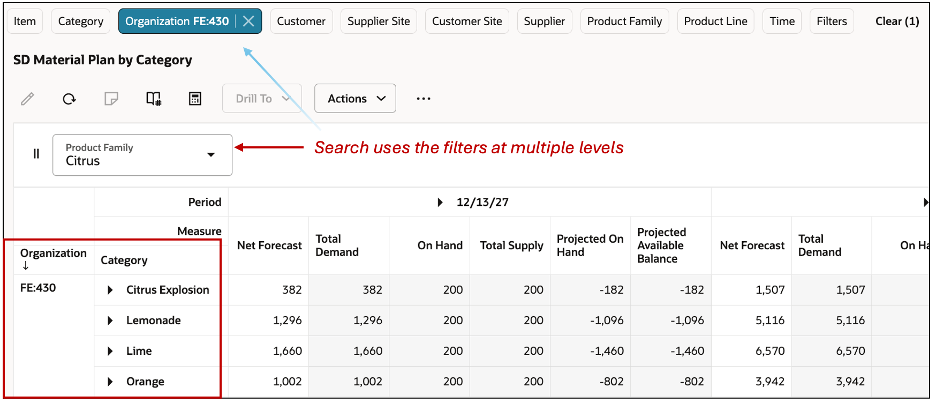
Page-level Search and Table Filters
Steps to Enable
You don't need to do anything to enable this feature.
Tips And Considerations
For large tables, it is recommended to use filters to reduce the number of cells as much as possible to reduce the memory load for a superior user experience
When exporting table data to Excel, the date values are exported as Excel date data type in the date format of the client. Hence this could potentially look different from the table as it uses the application's user preference date format.
Key Resources
- Refer to What’s New updates for the following features:
- Redwood: Configure Pivot Tables and Graphs Using a New User Experience.
- Redwood: Manage Visualizations Using a New User Experience
- Redwood: Analyze Supply Plans Using a Configurable Redwood Page
Access Requirements
Users who are assigned a configured job role that contains these privileges can access this feature:
- Edit Planning Analytics Configuration (MSC_EDIT_PLANNING_ANALYTICS_CONFIGURATION_PRIV)
- View Planning Analytics (MSC_VIEW_PLANNING_ANALYTICS_CONFIGURATION_PRIV)
- Maintain Planning Tables (MSC_MAINTAIN_PLANNING_TABLES_PRIV)
- Delete Planning Tables (MSC_DELETE_PLANNING_TABLES_PRIV)
These privileges were available prior to this update.
- View Planning Objects (MSC_VIEW_PLANNING_OBJECTS_REST_SERVICE_PRIV)
This is a new privilege.