Redwood: Review and Update Allocations Using a New User Experience
Allocated items have restricted availability, which can affect order quantities and timing. A new report displays the total amount assigned to each node in the allocation hierarchy, the remaining quantity customers can order each week, and other related measures. You can also adjust allocation quantities and re-run the plan to reassign supply to customers, channels, or regions that need it. The report summarizes total demand scheduled on time and the fill rate. Additionally, you can drill down to review the order lines that consume supply for a given allocation node.
To access Backlog Management, go to the Redwood Supply Chain Planning work area and select Backlog Management in the context selector. The default landing page is Backlog Analysis. The Allocation page is included by default in the same page group as Backlog Analysis. To open it, click the Allocation tab.
Allocation Page
The Allocation page includes the following components:
- Allocation Scenario dropdown: Displays the default scenario. If no default is set, the first scenario in alphabetical order is shown. You can select a different scenario as needed.
- Organization dropdown: Displays the organization associated with the selected scenario. Only one organization is supported per allocation scenario.
- Item dropdown: Lists the items included in the selected scenario The first item (alphabetically) is displayed by default and its measure data is shown in the data grid. You can switch to view measure data for items in the scenario.
- Simulation and Actions menus: Located to the right of the Organization dropdown, these menus provide access to available actions and simulation tools.
- Allocation nodes, Measures and Weekly time buckets in data grid: Data grid displays demand satisfaction metrics and allocation measures for each allocation node, organized by weekly time buckets.
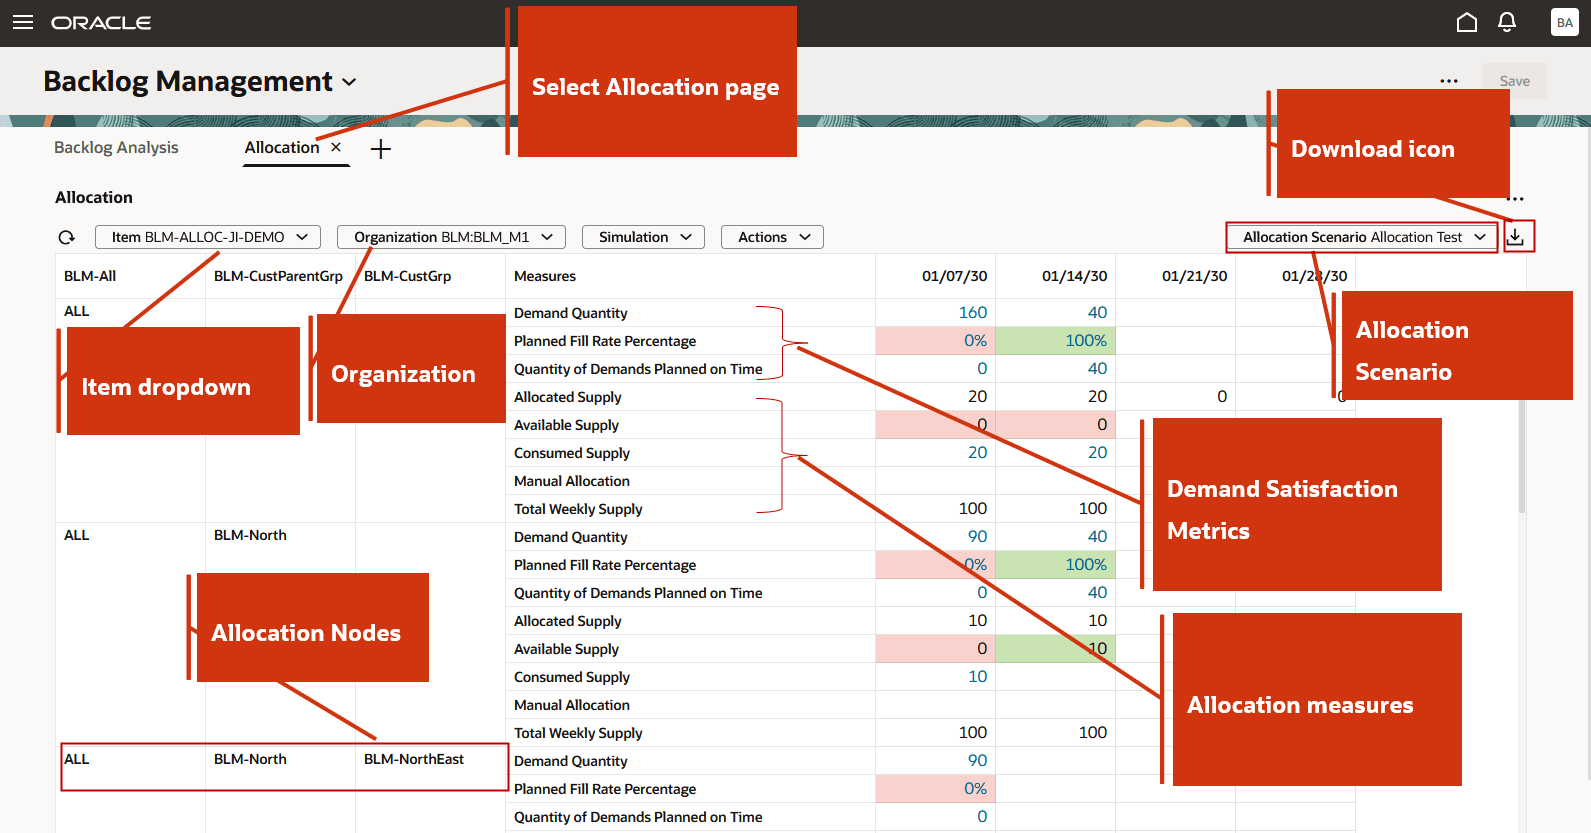
Allocation Page in Backlog Management in Redwood Supply Chain Planning Work Area
Simulation and Actions Menus
On the Allocation page, the Simulation and Actions menus provide access to key functions. The available actions are as follows:
- Simulation menu
- Run Simulation: Enabled after you modify a Manual Allocation measure for an item-organization-allocation node and time bucket.
- Save Simulation: Enabled once the simulation run completes successfully.
- Actions menu
- Manage Scenarios: Opens the Allocation Scenario drawer, where you can
- Create a new allocation scenario
- Edit an existing scenario
- Duplicate a scenario
- Delete a scenario
- Manage Scenarios: Opens the Allocation Scenario drawer, where you can
Manage Scenarios
Click Manage Scenarios to open the Allocation Scenario drawer.
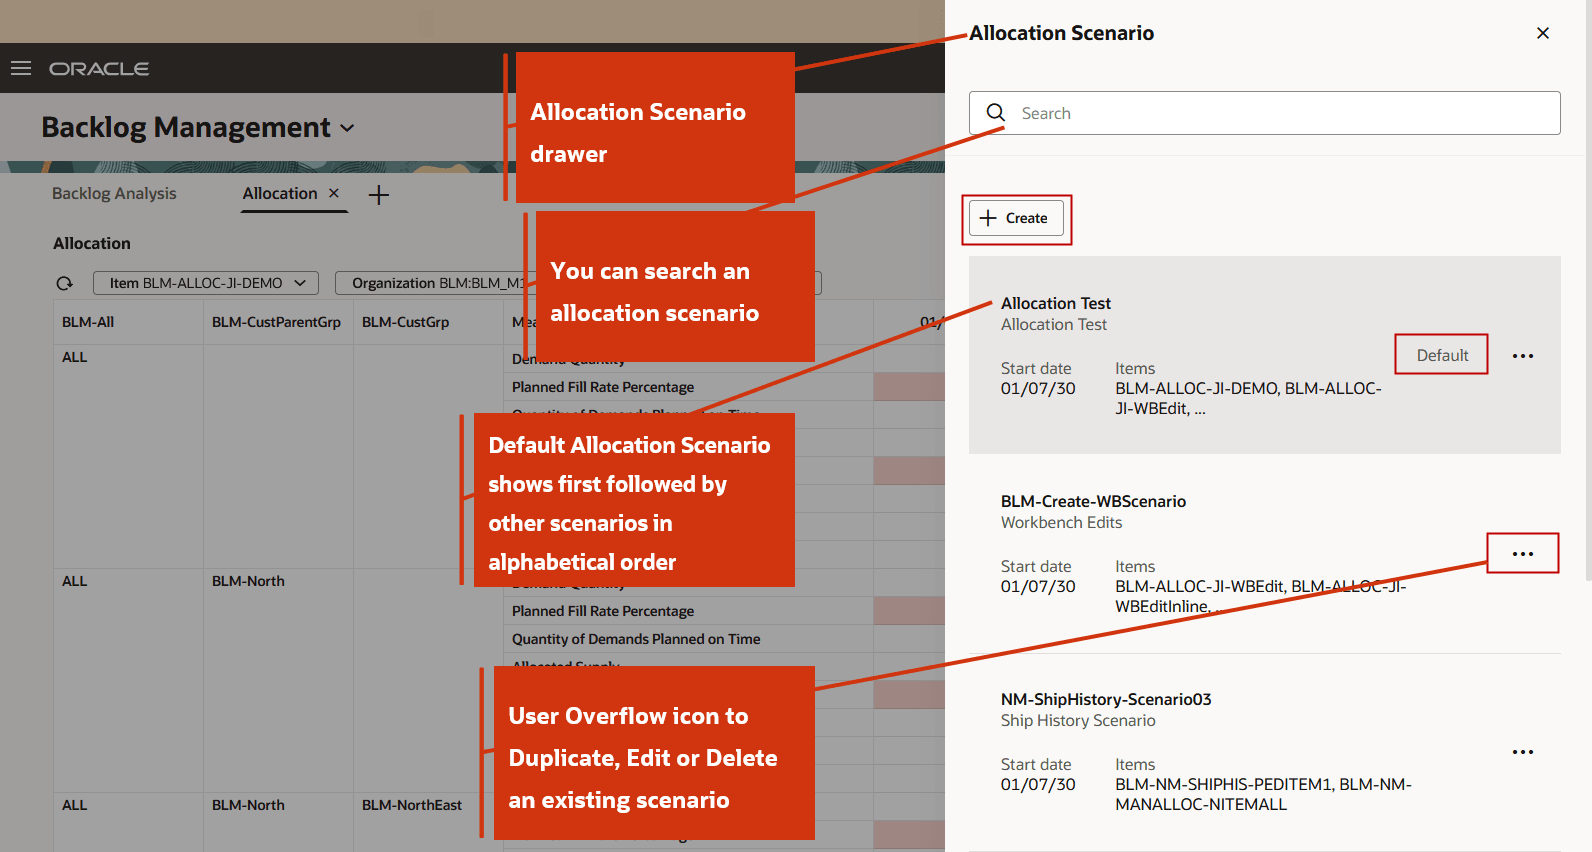
Allocation Scenario Drawer
The Allocation Scenario drawer displays a list of existing allocation scenarios. The default scenario appears at the top, followed by other scenarios in alphabetical order.
In the Allocation Scenario drawer, you can perform the following actions:
- Search for an existing scenario by name using the Search field.
- Create a new allocation scenario.
- Use the ellipsis icon next to a scenario to edit, duplicate, or delete it.
To create a new allocation scenario:
- In the Allocation Scenario drawer, click Create. The New allocation scenario drawer opens.
- Enter the Name and Description of the scenario.
- Select an Organization from the dropdown.
- Select one or more Items from the dropdown.
- Select a Start Date.
- Enter the number of time buckets for which you want to view the allocation data.
- (Optional) Select the Set as default checkbox to make this the default scenario.
- By default, the following three measures are selected in:
- Demand Satisfaction Metrics: Demand Quantity, Quantity of Demands Planned on Time, and Planned Fill Rate Percentage.
- Allocation Measures: Allocated Supply, Consumed Supply, and Available Supply.
You must select at least one metric or measure. You can select additional ones as needed and rearrange them in the desired order.
- In the Allocation Nodes tab, select at least one allocation node.
- Click Create to create the allocation scenario.
The newly created allocation scenario appears in the scenario list.
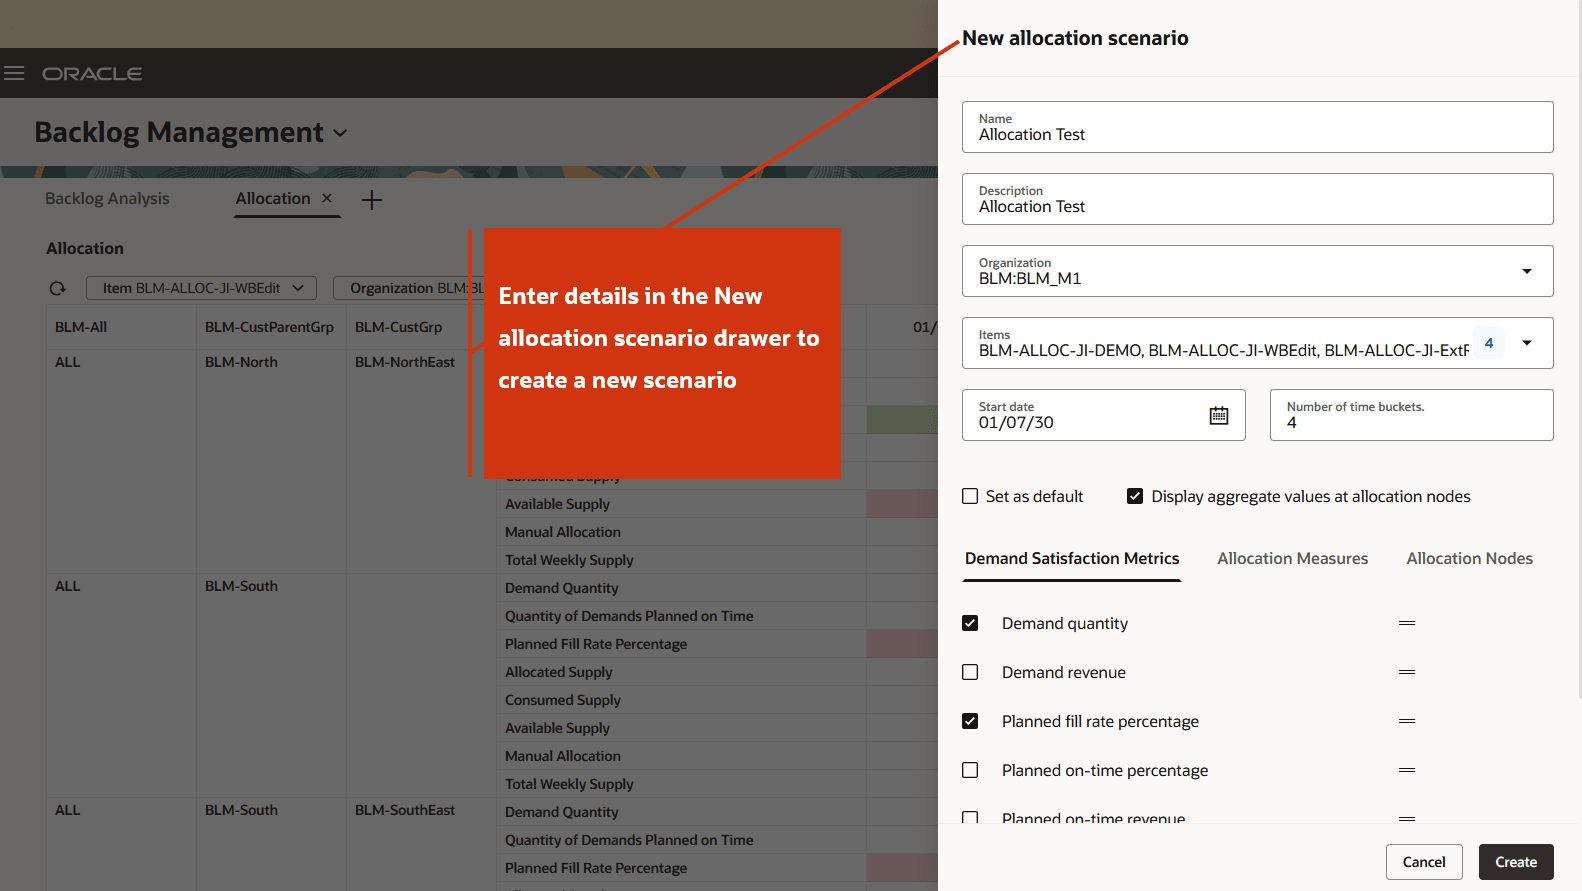
New Allocation Scenario Drawer
To view the allocation data for the scenario you created:
- Close the Allocation Scenario drawer.
- Select the scenario from the Allocation Scenario dropdown on the Allocation page.
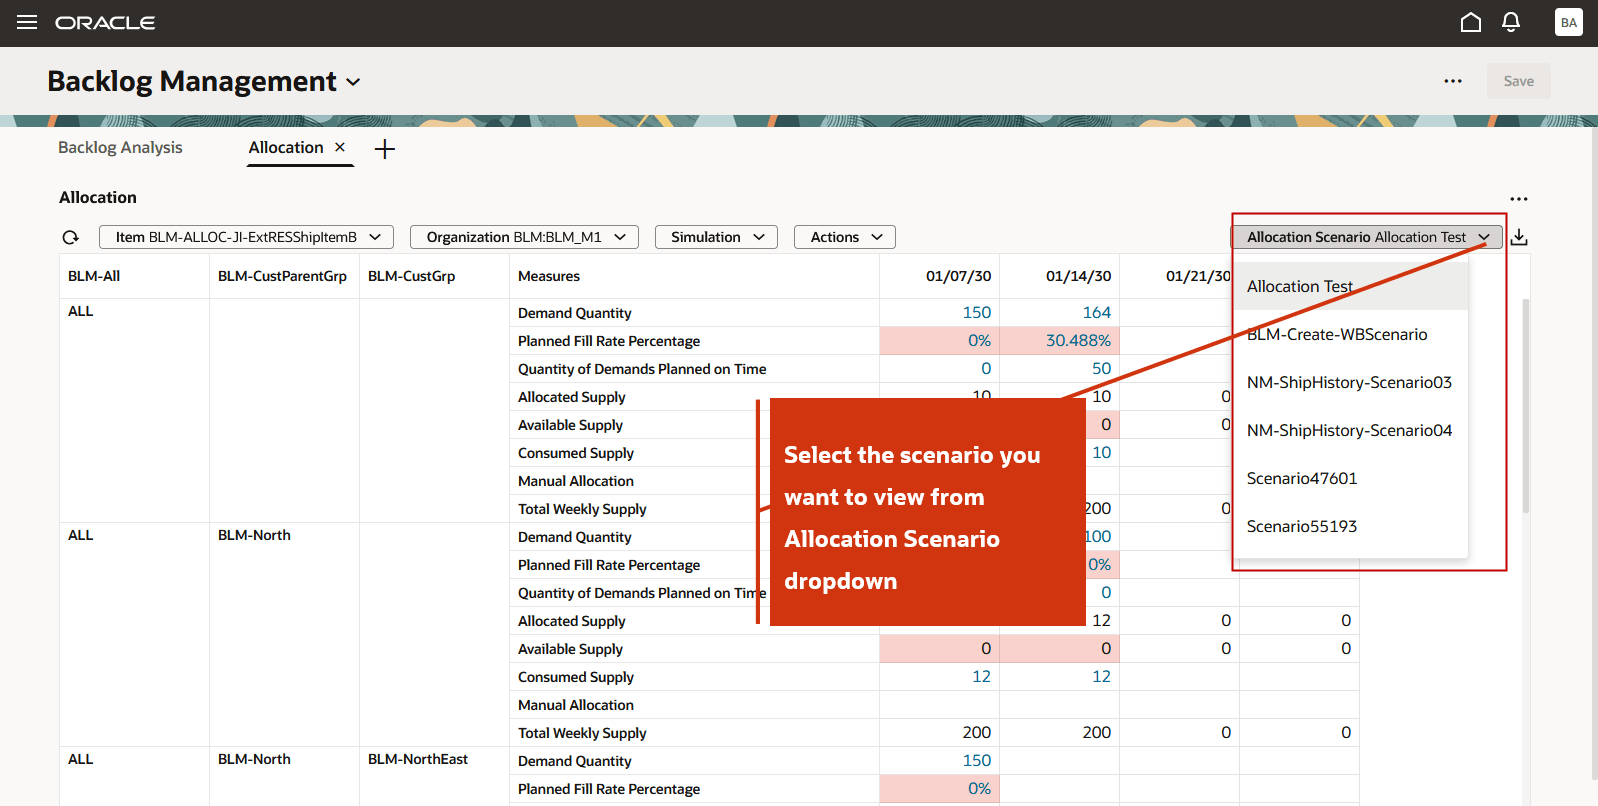
Select Scenario from Allocation Scenario dropdown
To edit an allocation scenario:
- Click the ellipsis icon next to the scenario name and select Edit.
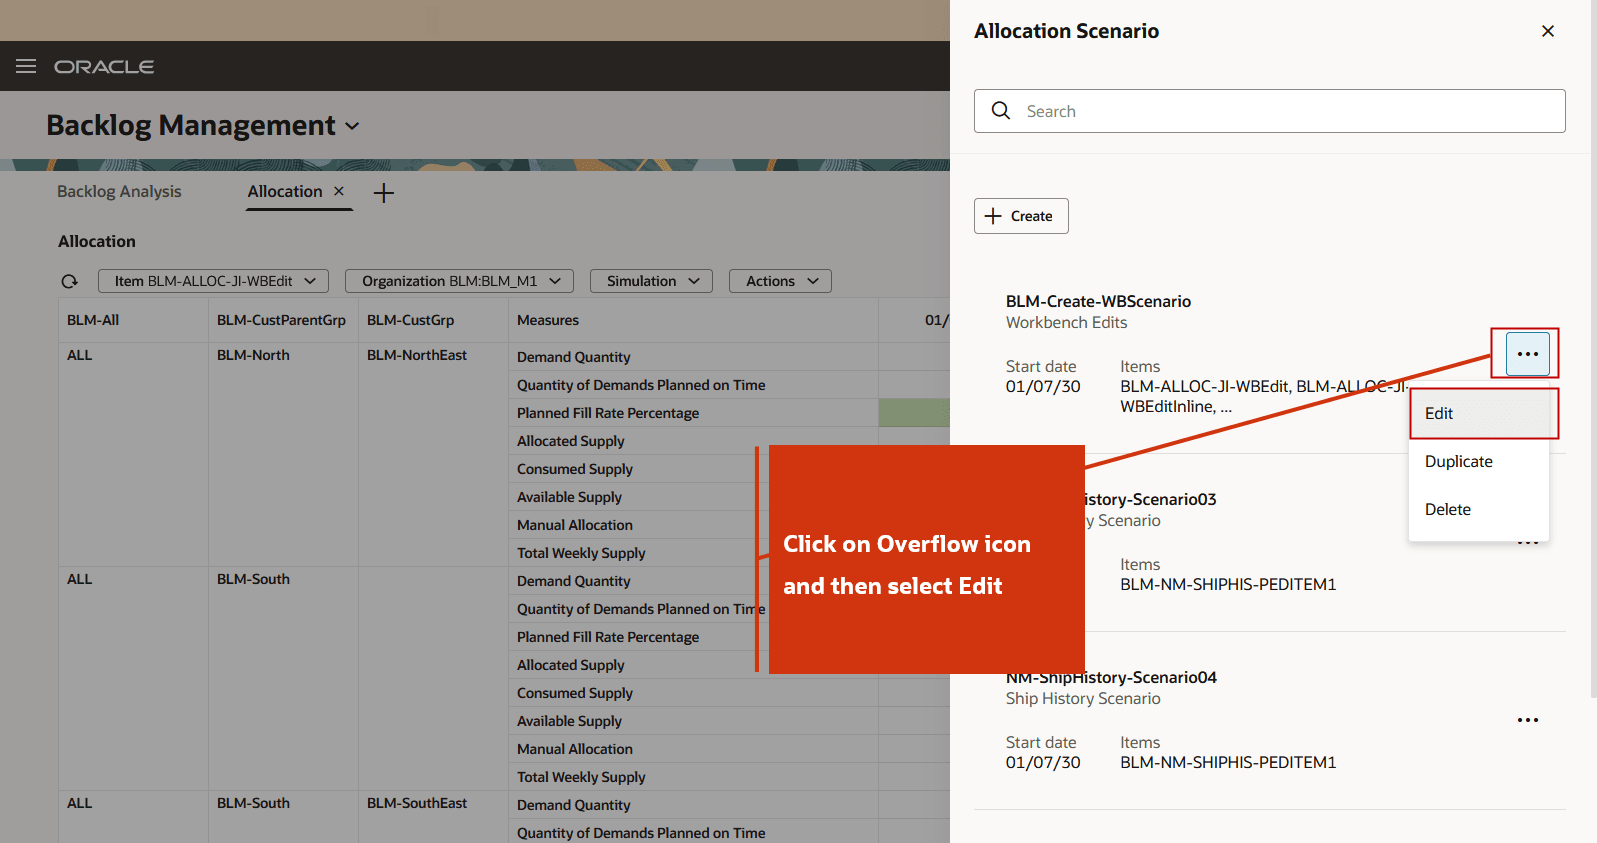
Click Overflow and Select Edit
- In the Edit scenario name drawer, you can:
- Edit the Description
- Select additional items.
- Modify the Start Date and Number of Time Buckets.
- Set a scenario as Default.
- Add or reorder measures in the Demand Satisfaction Metrics and Allocation Measures tabs.
- Select additional Allocation Nodes.
- Click Save and Close to apply your changes.
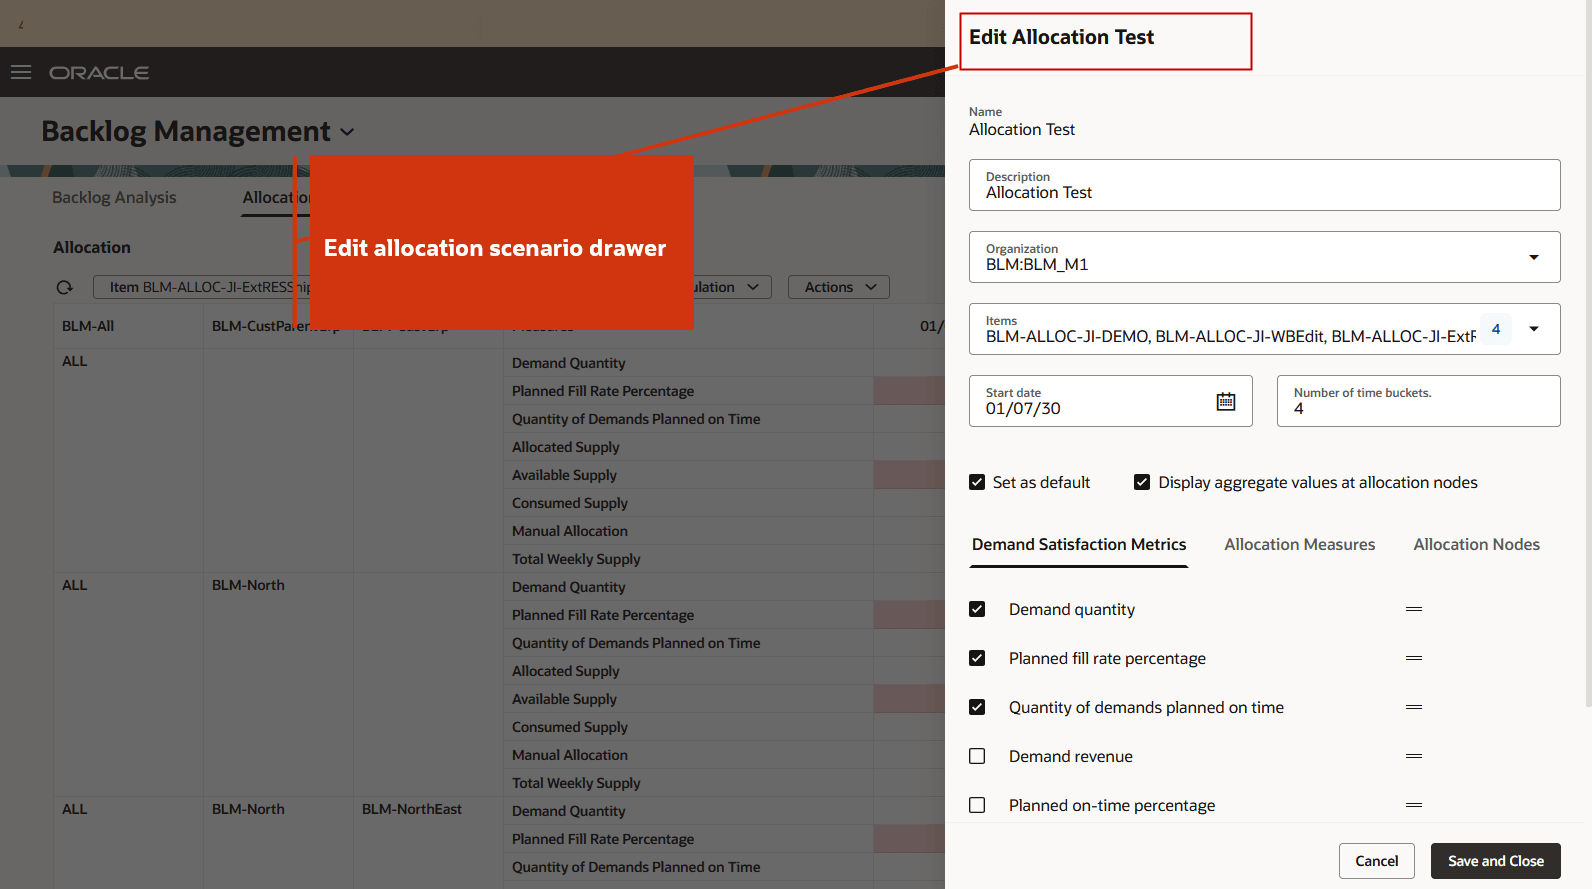
Edit Allocation Scenario
To duplicate and delete a scenario:
Click Duplicate to quickly create a new allocation scenario by copying the details from an existing one.
To delete a scenario, click Delete.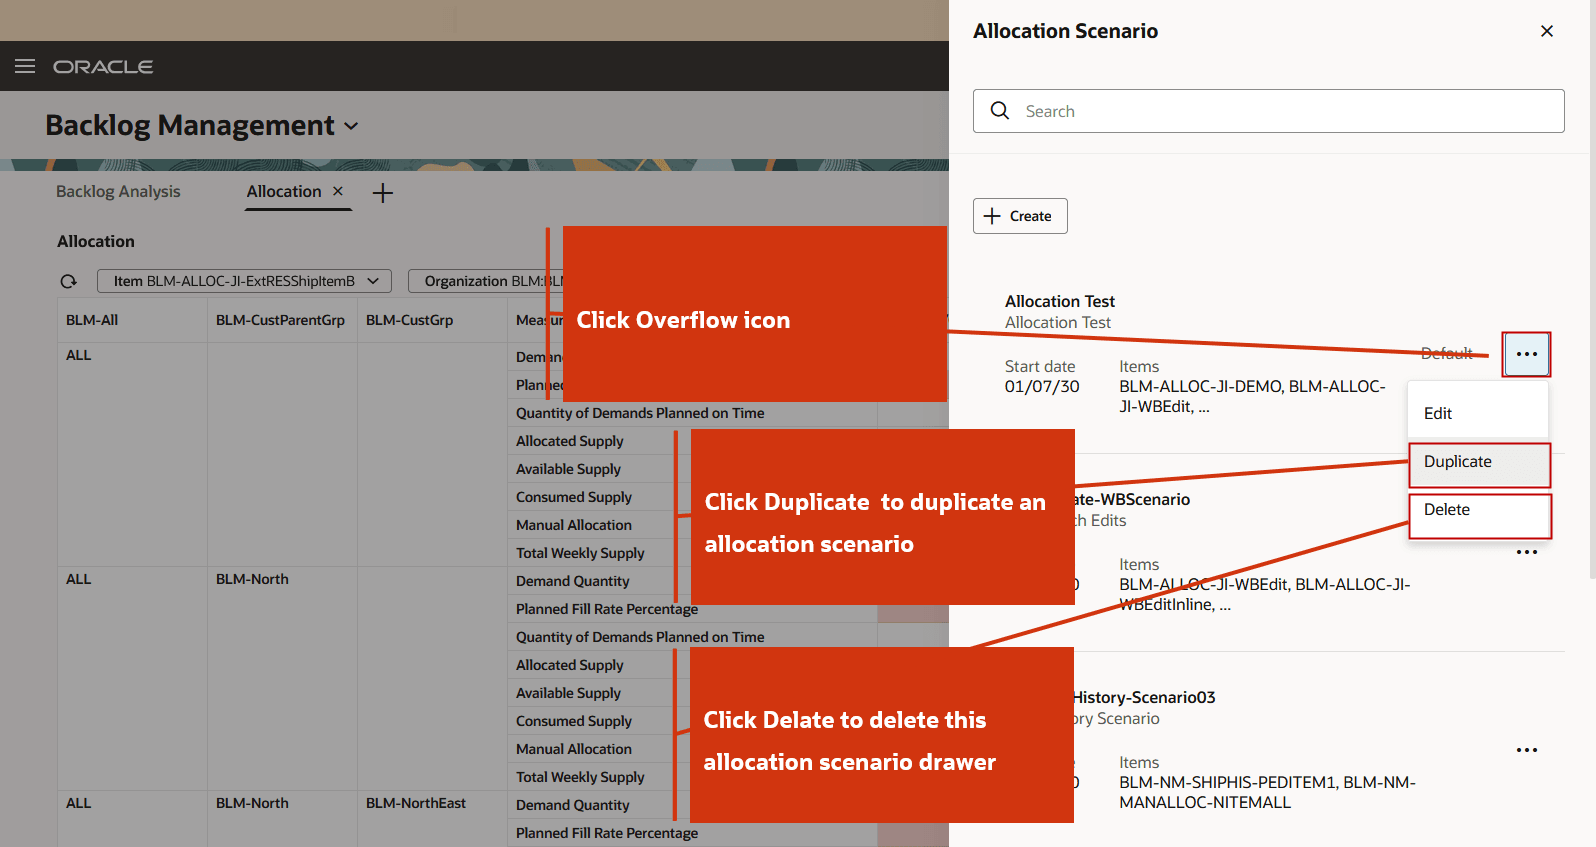
Duplicate or Delete an Allocation Scenario
Color Coding
Color coding is applied for the following measures for quick visual assessment:
- Planned Fill Rate Percentage
- Planned On-Time Percentage
- Scheduled Fill Rate Percentage
- Scheduled On-Time Percentage
- Available Supply
Color coding logic for different measures is as follows:
- For Planned Fill Rate Percentage, Planned On-Time Percentage, Scheduled Fill Rate Percentage, Scheduled On-Time Percentage:
- Greater than 80% = Green
- 40% to 80% = Orange
- 40% or less = Red
- For Available Supply (as a percentage of Allocated Supply):
- Greater than 70% = Green
- 30% to 70% = Orange
- Less than 30% = Red
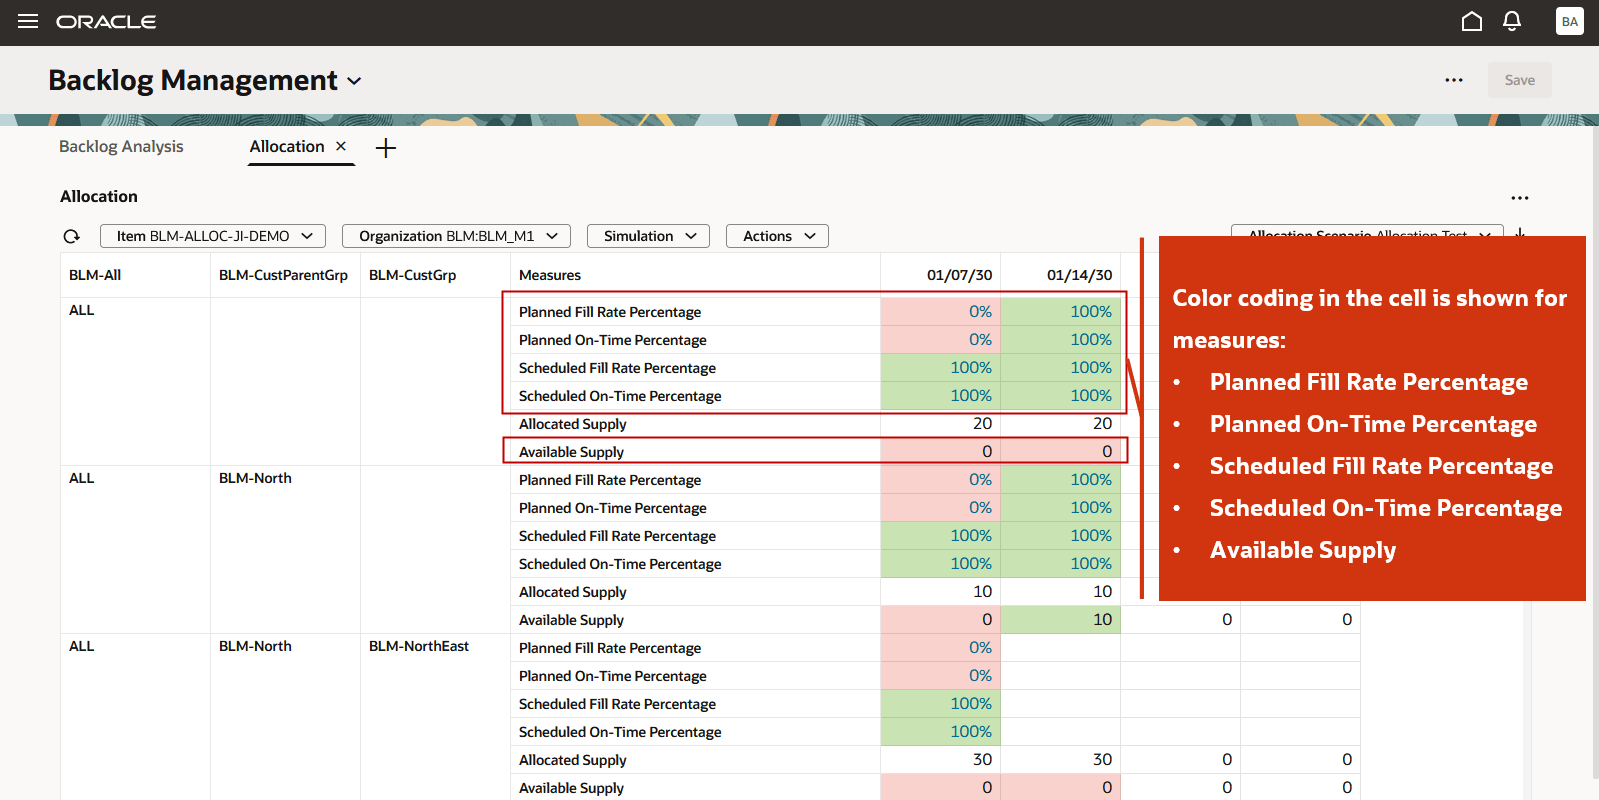
Color Coding in Cells
Run and Save Simulation
You can edit the Manual Allocation measure to run a quick simulation and evaluate improvements in the demand satisfaction at an allocation node. You can also drill to the Backlog Analysis page to confirm improvements in planned dates.
To edit the Manual Allocation measure to run a simulation:
- Edit the Manual Allocation value in a cell on the Allocation page.
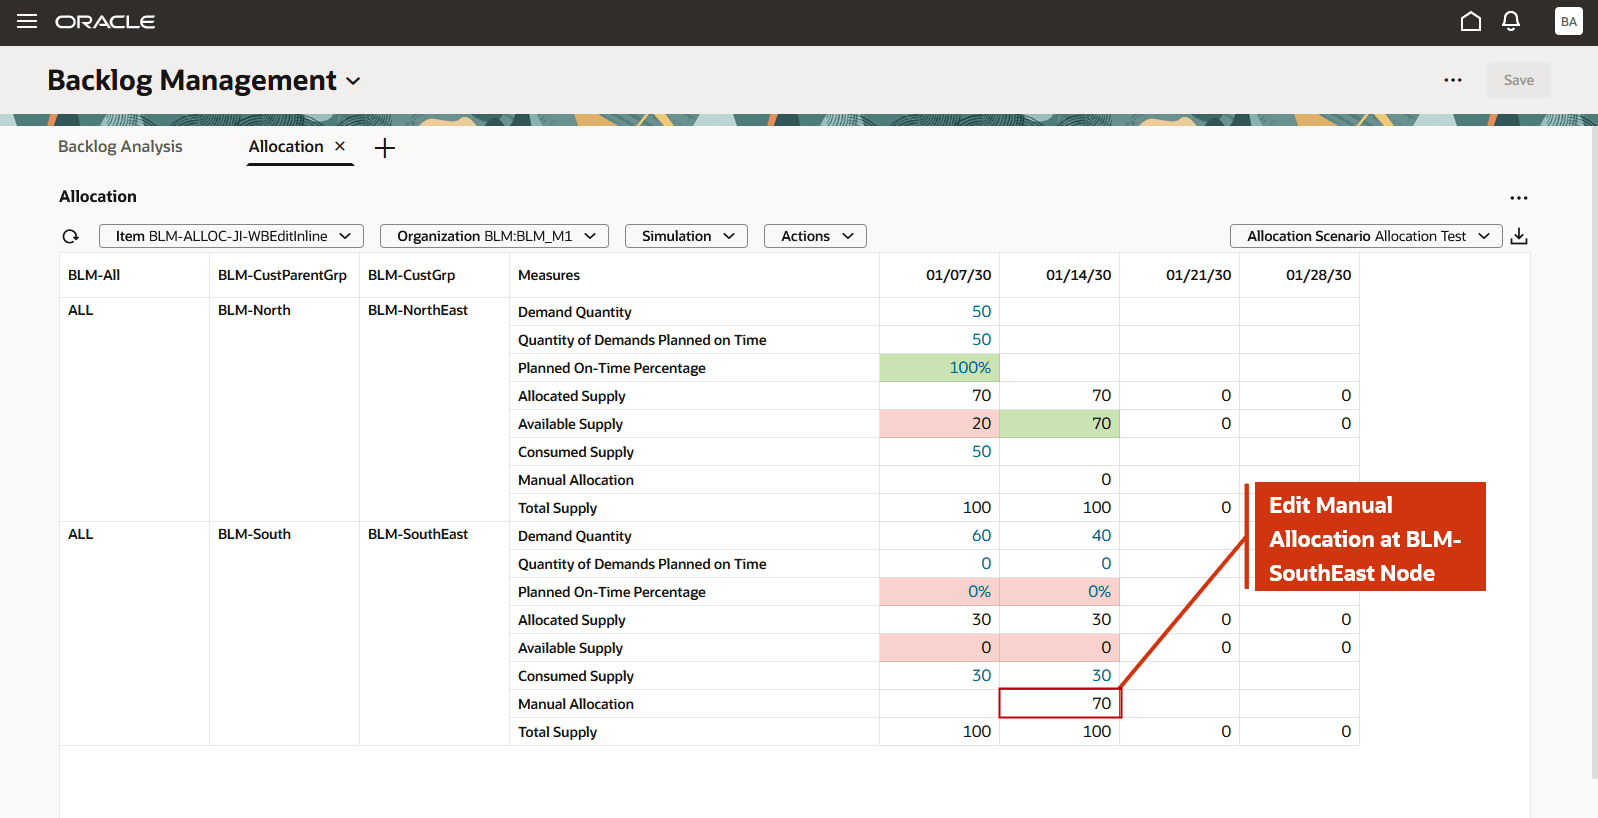
Edit Manual Allocation
Once a cell is edited, Run Simulation becomes available.
- Select Run Simulation from the Simulation menu.
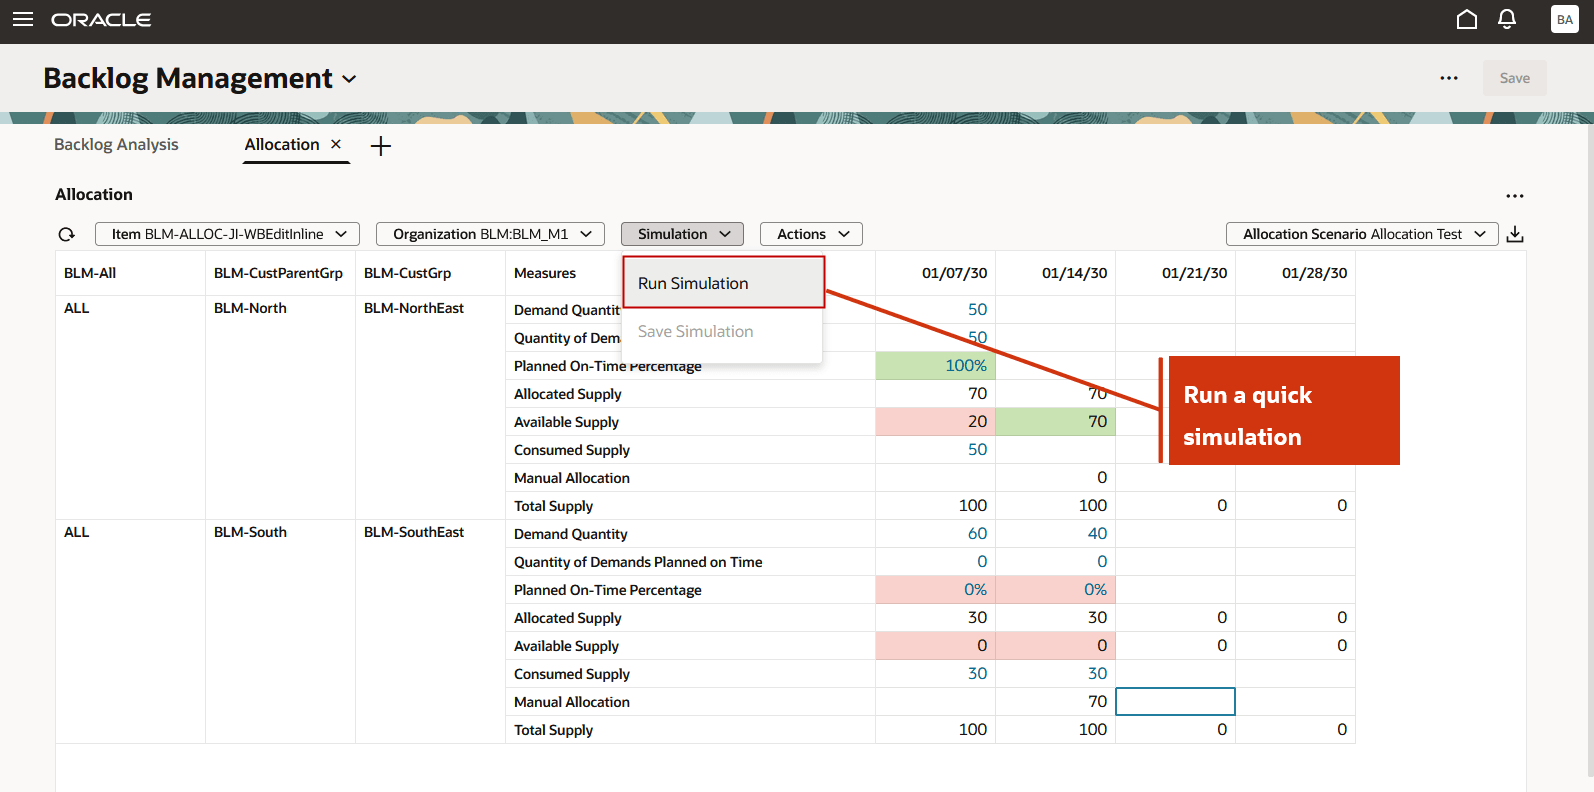
Run Simulation
The simulation starts immediately.
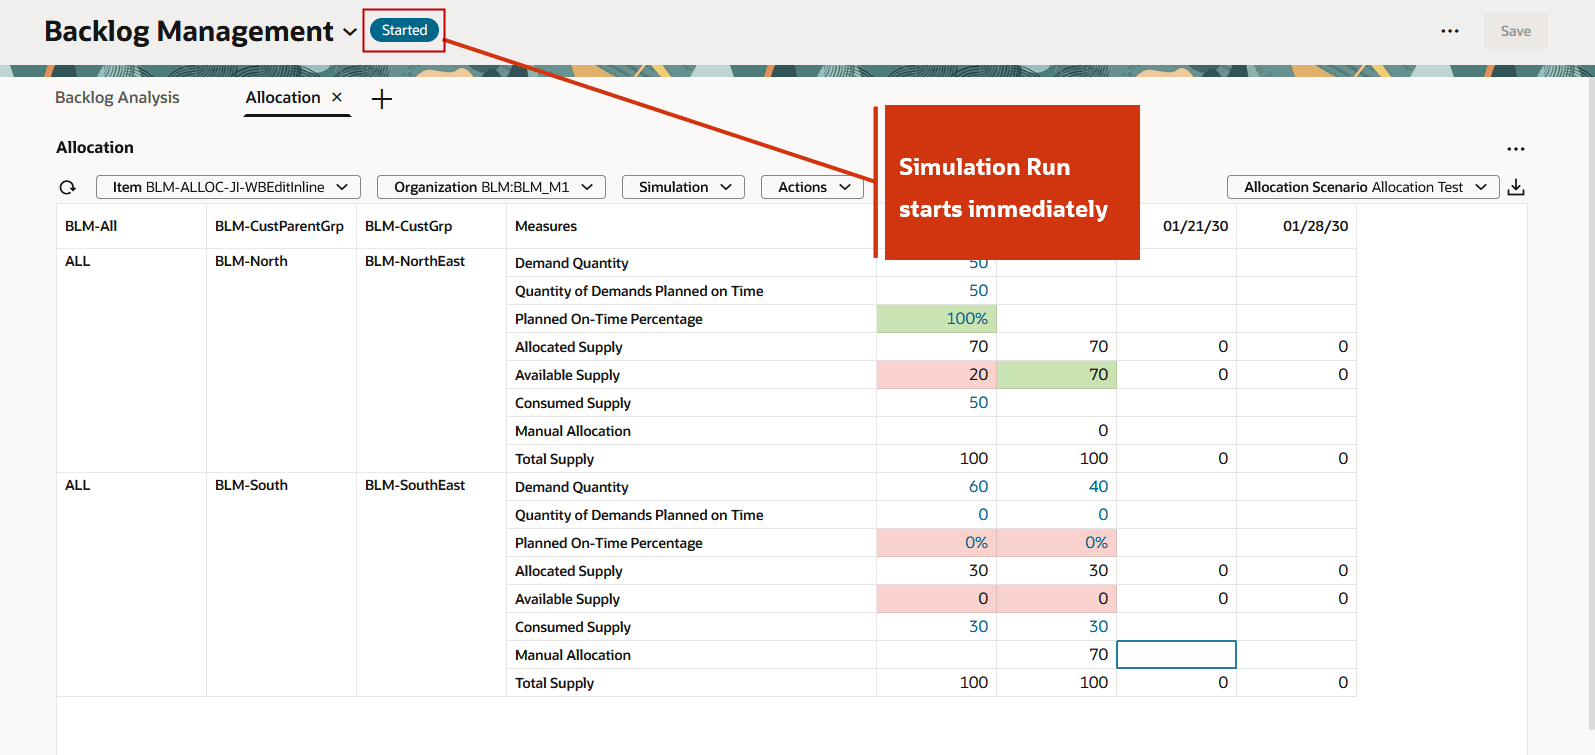
Run Simulation is Started
After a quick run, the results are displayed. For example, the Planed On-Time Percentage at the BLM-SouthEast node has improved from 0% to 100%.
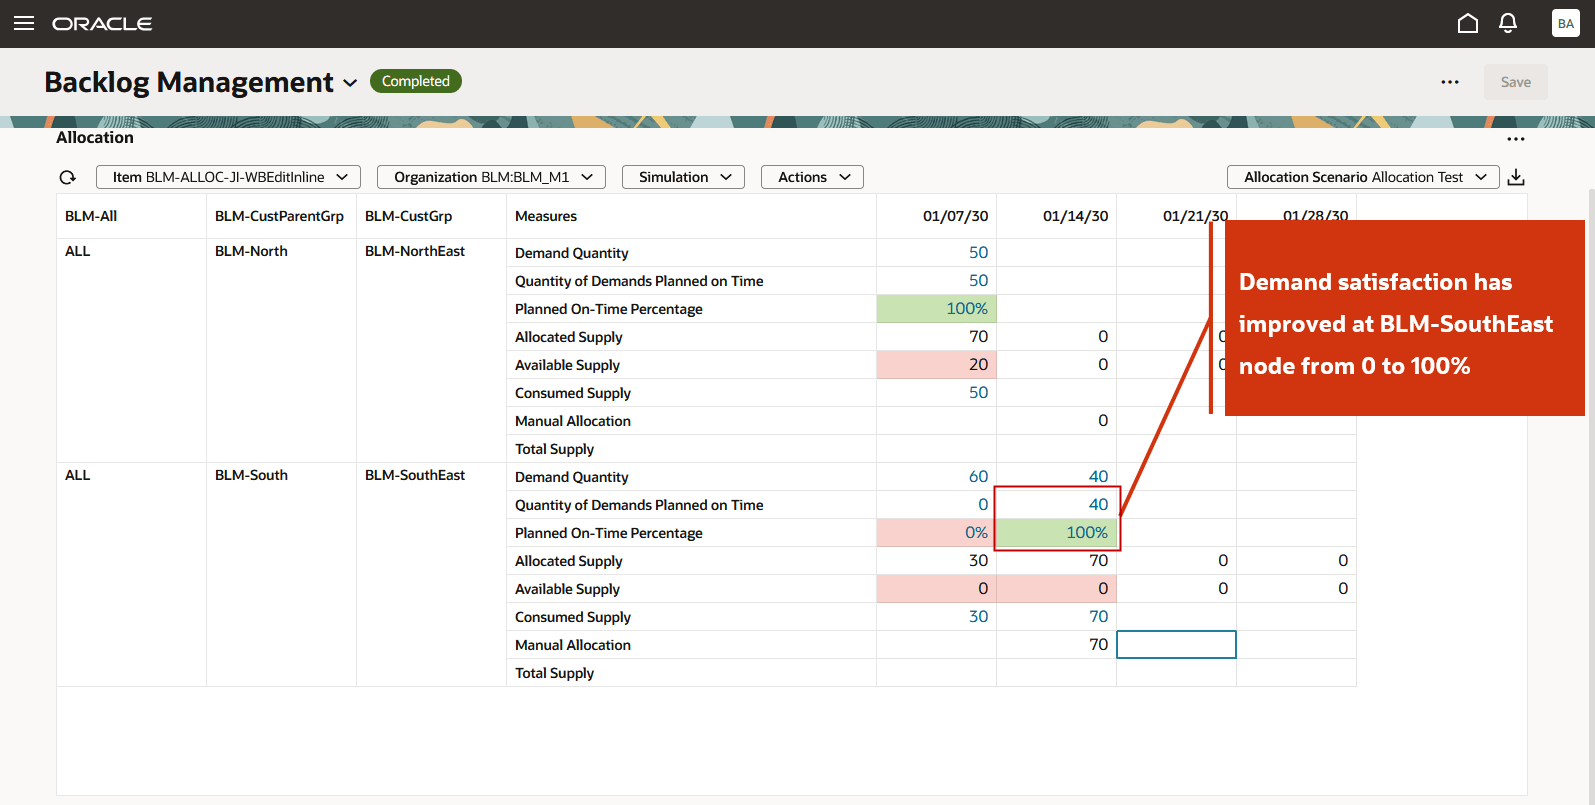
Simulation Run is Completed
- To save the simulation results, select Save Simulation from the Simulation menu.
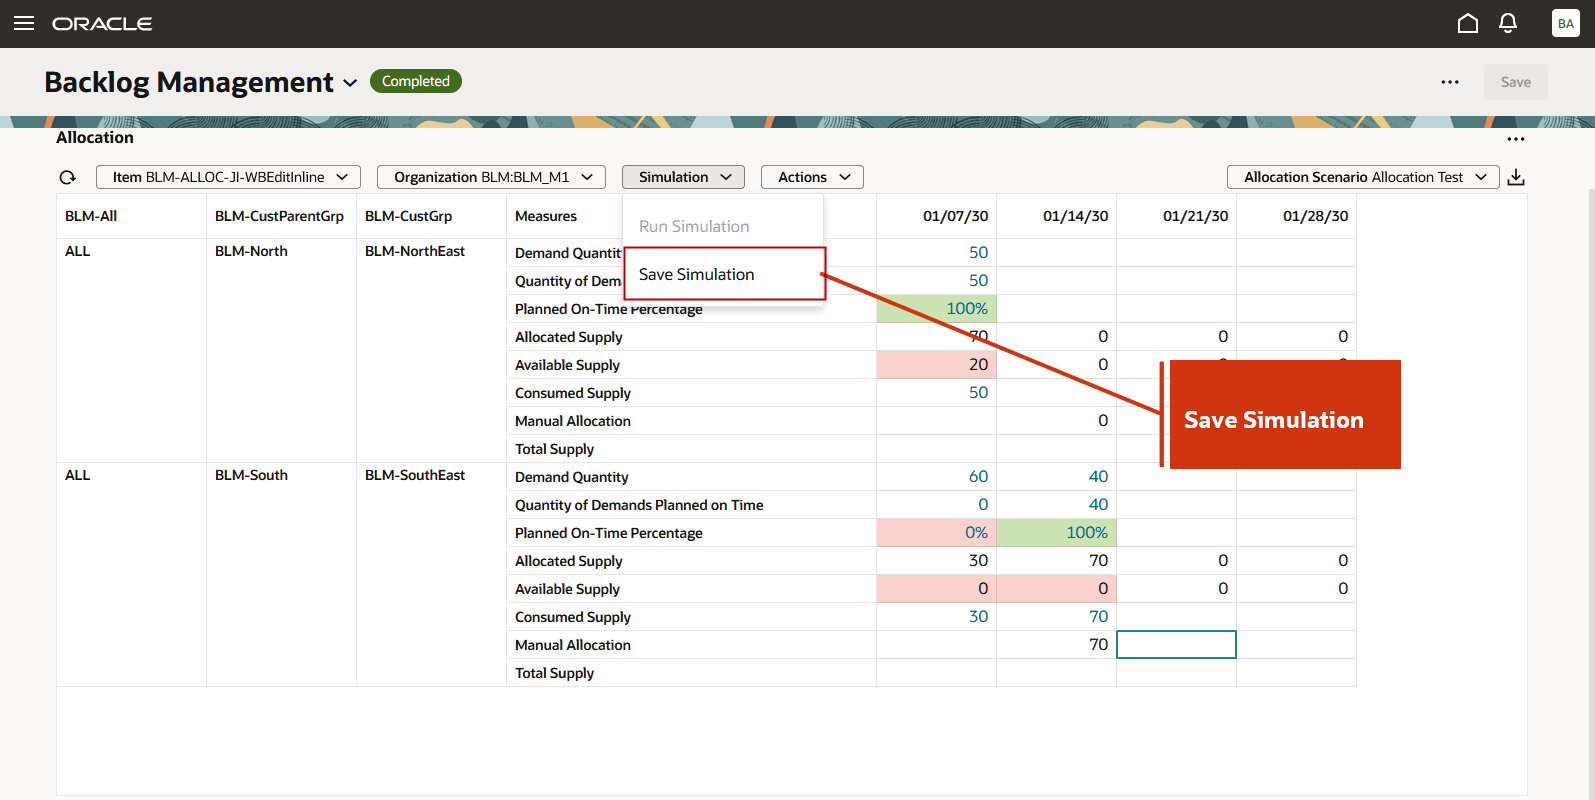
Save Simulation
After saving, analyze the simulation results by reviewing the demand satisfaction metrics. To see if sales order line planned dates have improved, drill from Allocation to the Backlog Analysis page.
For example, click the hyperlink on the Planned On-Time Percentage 100% value to drill to the Backlog Analysis page to view the underlying demand.
You can also view all the demands that consume the supply at a node. For example, click the hyperlink on the Consumed Supply 70 value at BLM-SouthEast in the Jan 14th bucket. This opens the Backlog Analysis page, showing the order lines that consumed 70 units of supply from BLM-SouthEast node.
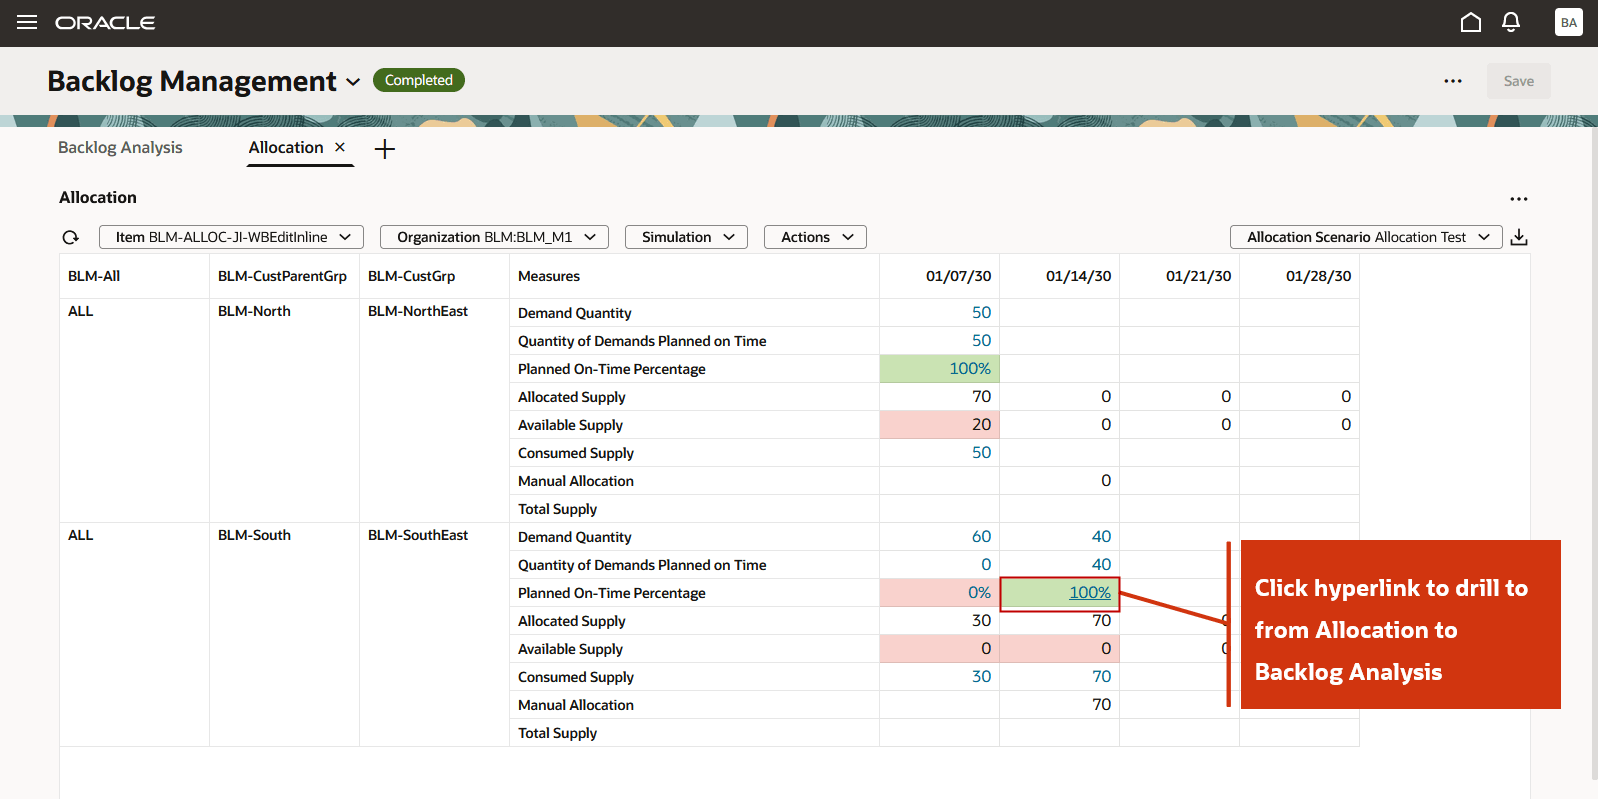
Drill To from Allocation to Backlog Analysis
On the Backlog Analysis page, review the demand details of the drill to context from the Allocation page.
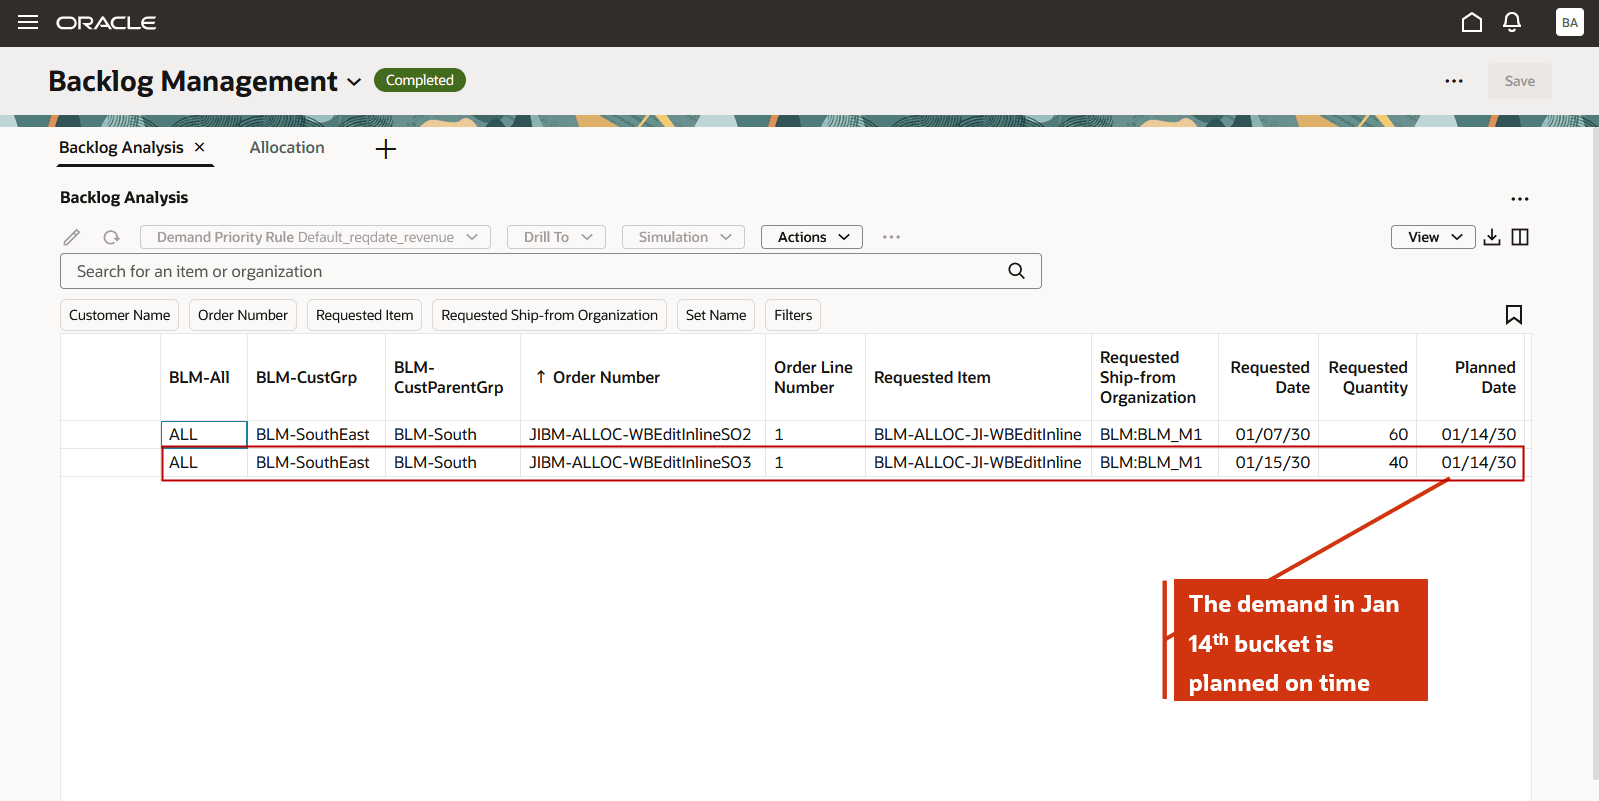
View Sales Order Line in Backlog Analysis After Drill To from Allocation
Drill to from Backlog Analysis to Allocation
You can navigate from the Backlog Analysis page to the Allocation page to review the supply allocation details for a selected order line. The Allocation page displays the total and consumed allocation for the item at its assigned ship-from organization, specifically for the weekly bucket that includes the request date. It also shows relevant demand satisfaction, such as fill rate percentage and planned on-time revenue.
Steps to navigate to Allocation from Backlog Analysis page and save navigation results to a scenario:
- On the Backlog Analysis page, select or highlight the sales order line.
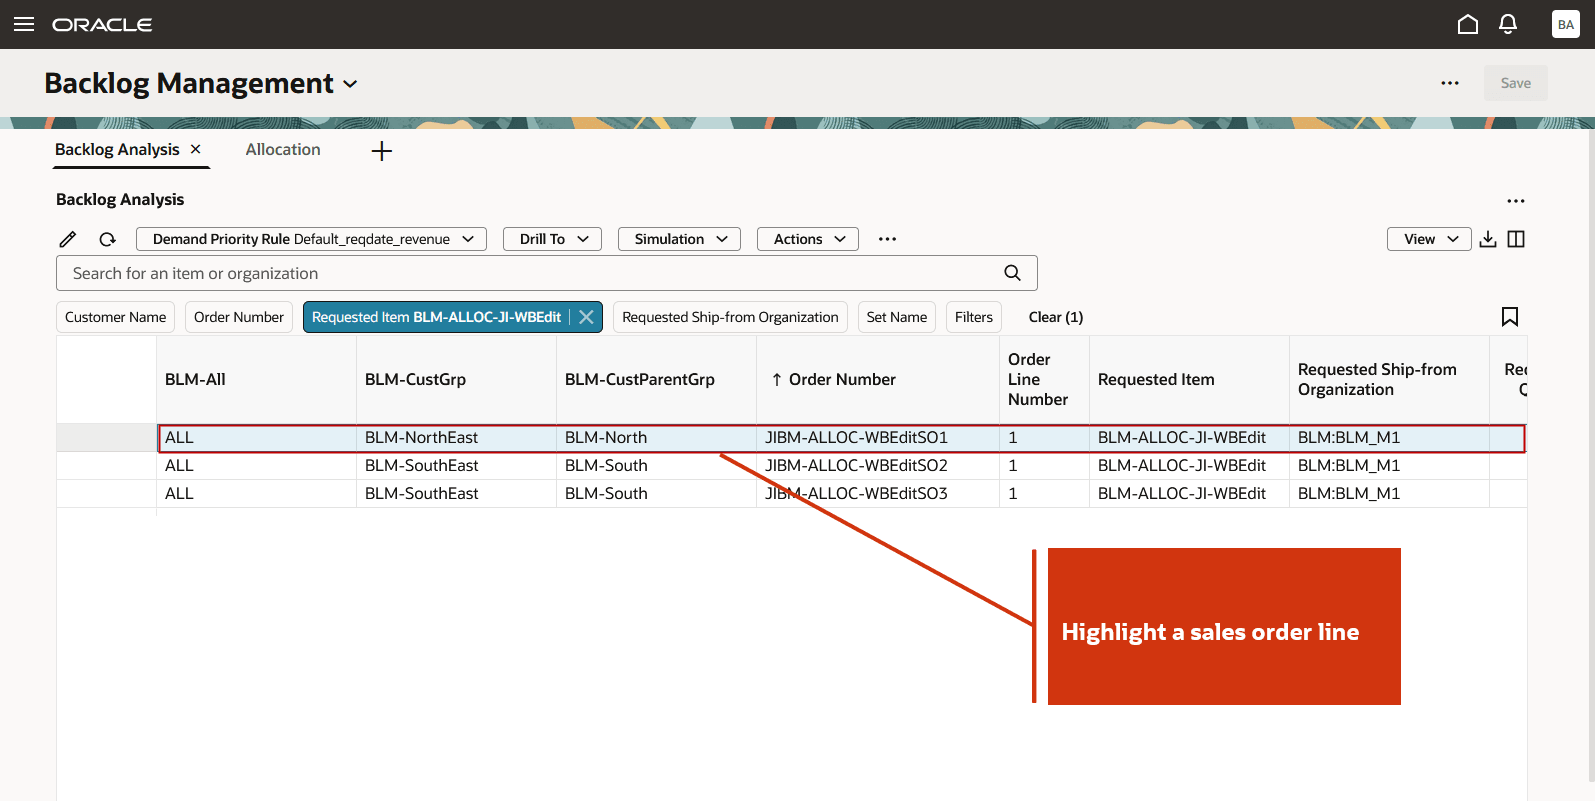
Select a Sales Order Line
- Click Drill To and then select Allocation. The system passes the context - item, organization, allocation nodes, and the requested date bucket - from the Backlog Analysis page to the Allocation page.
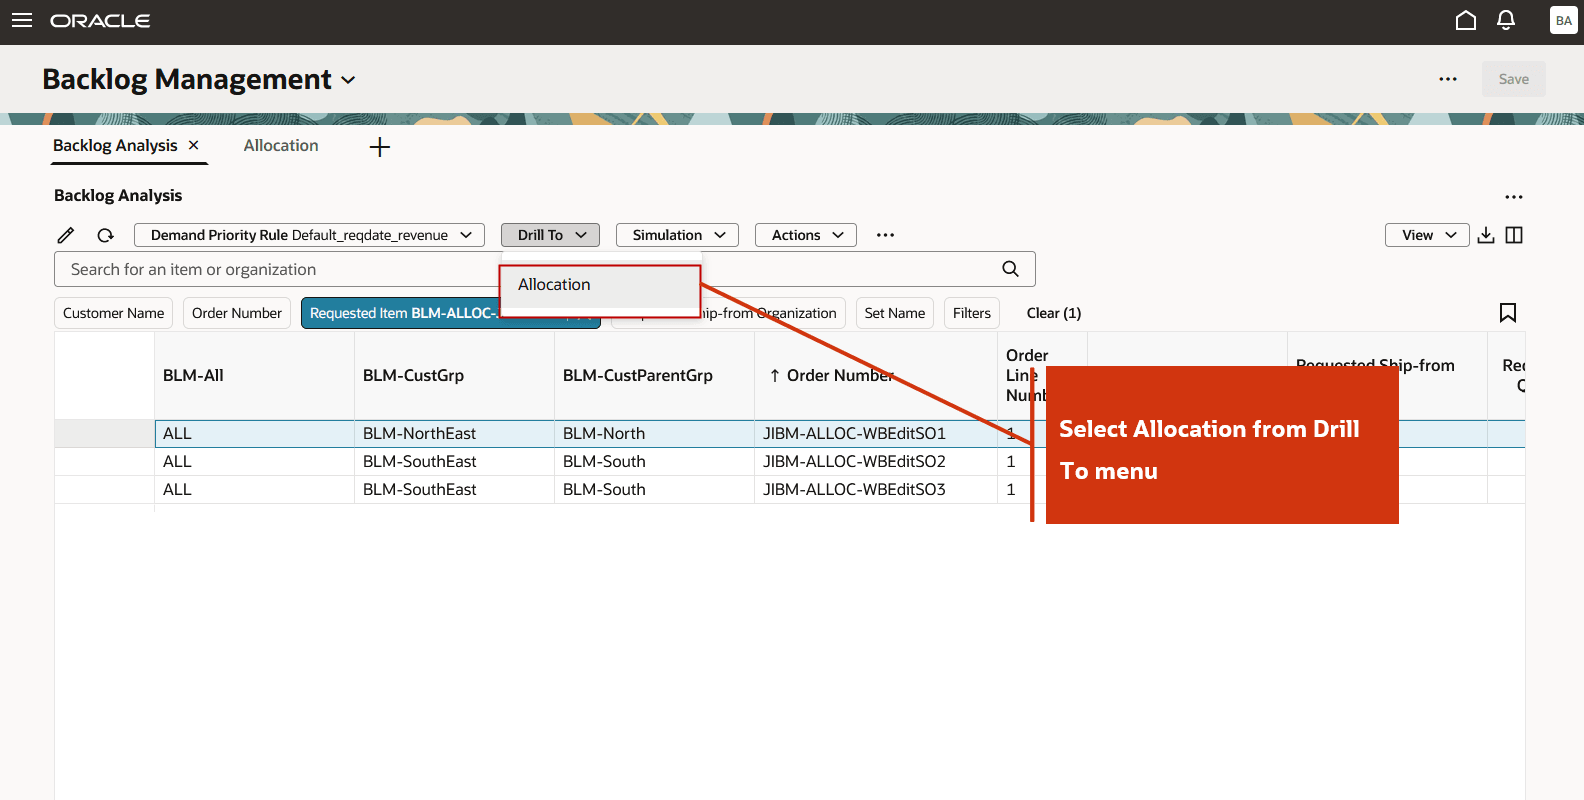
Select Allocation from Drill To Menu
The Allocation page is opened in a new tab, displaying:
- The selected context
- Three additional buckets beyond the request date bucket
- A set of default demand satisfaction and allocation measures
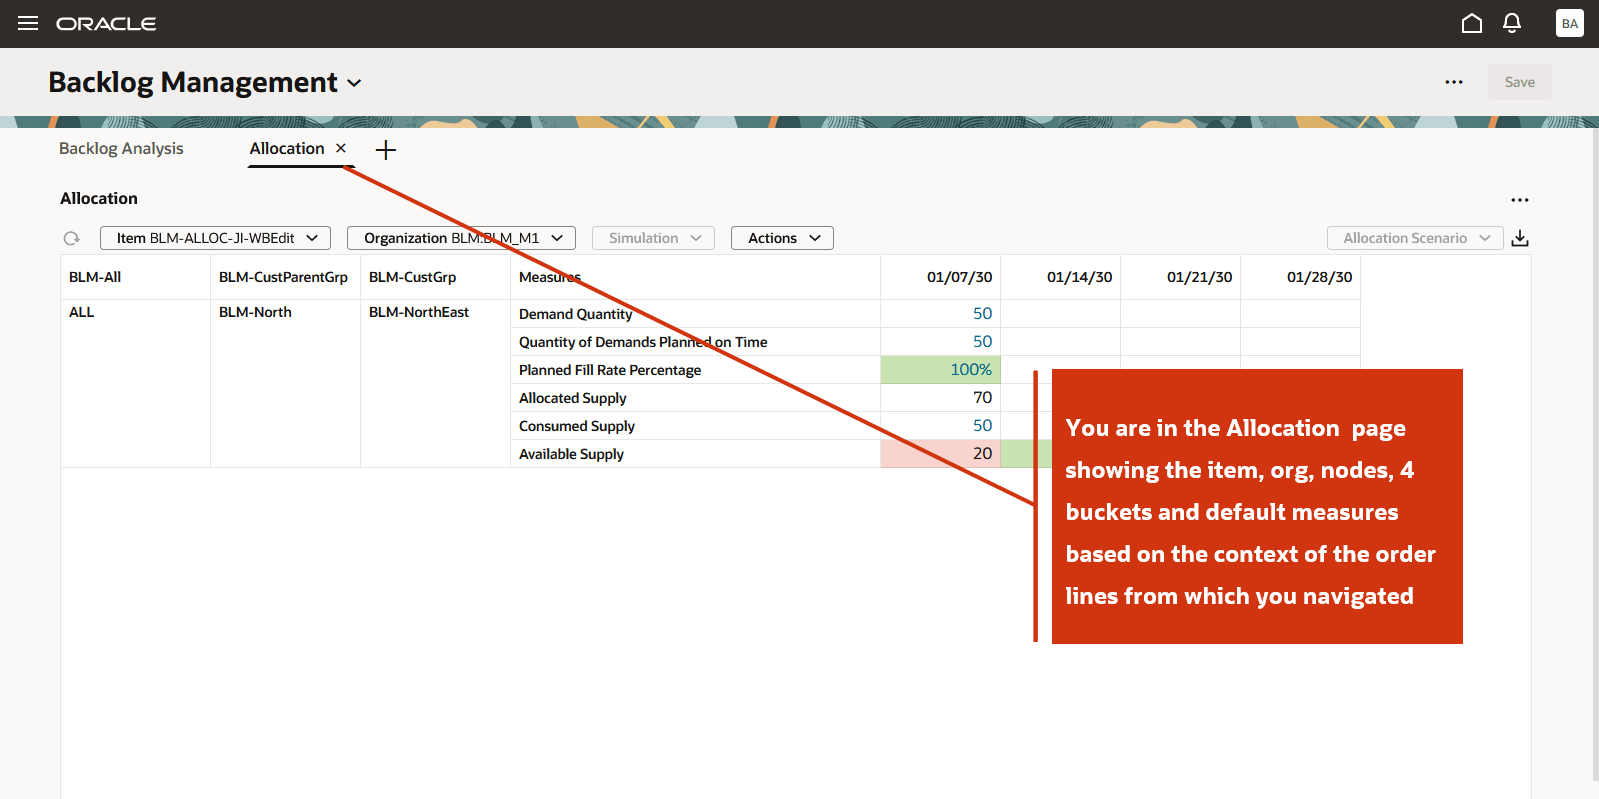
Allocation Page Opens Showing Drill To Context
- To save the results to an allocation scenario, open the Actions menu and select Save as New Scenario.
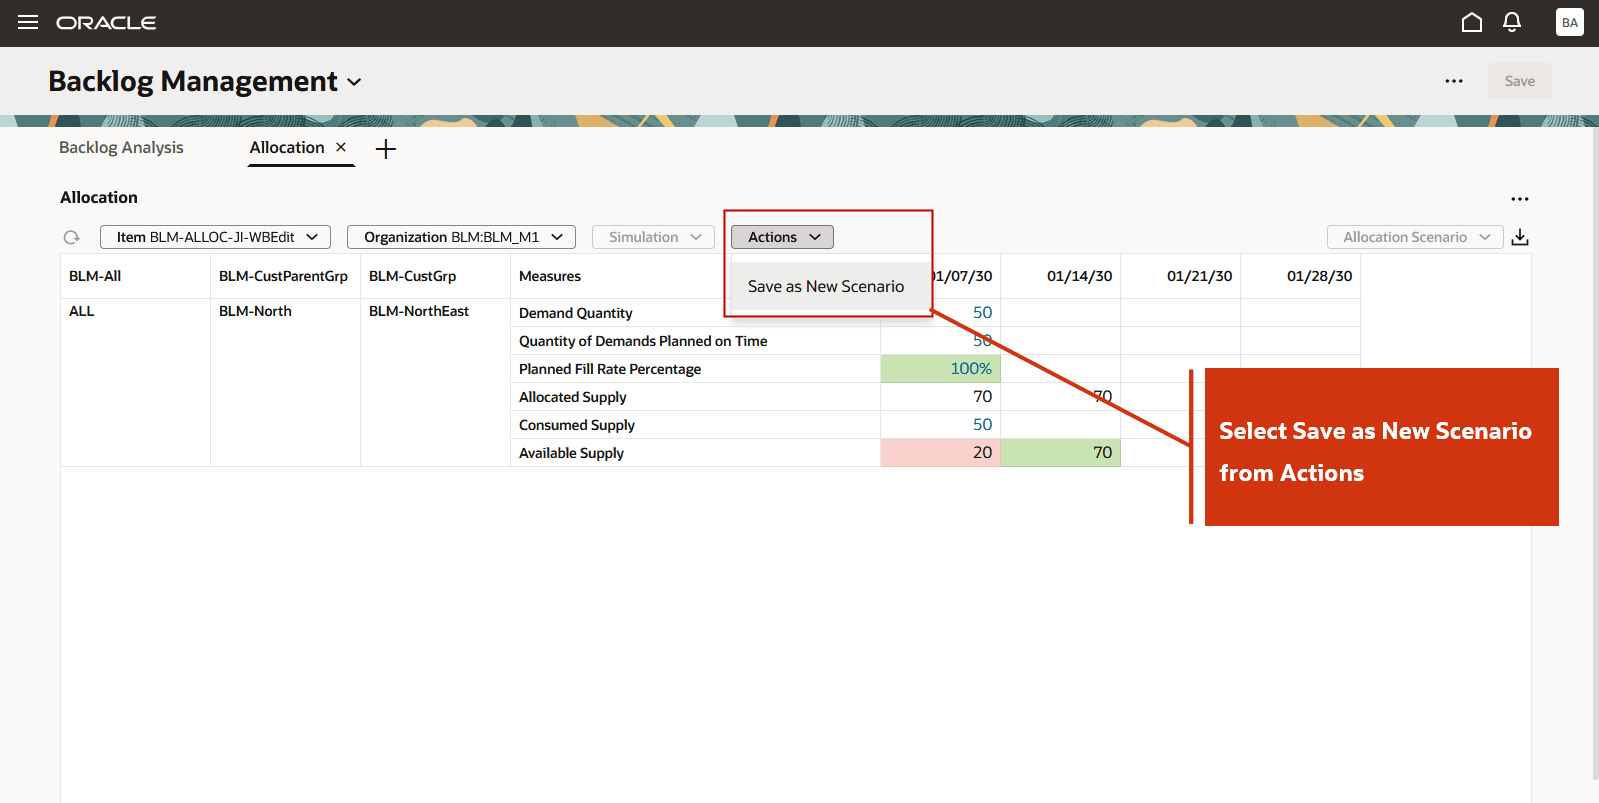
Select Save as New Scenario
- In the Allocation Scenario drawer:
- Enter a scenario name.
- (Optional) Modify the number of buckets from the default 4 buckets.
- Add more measures as needed in the Demand Satisfaction Metrics and Allocation Measures tabs.
- (Optional) Select Set as default to make this the default scenario.
- Click Create to save the scenario.
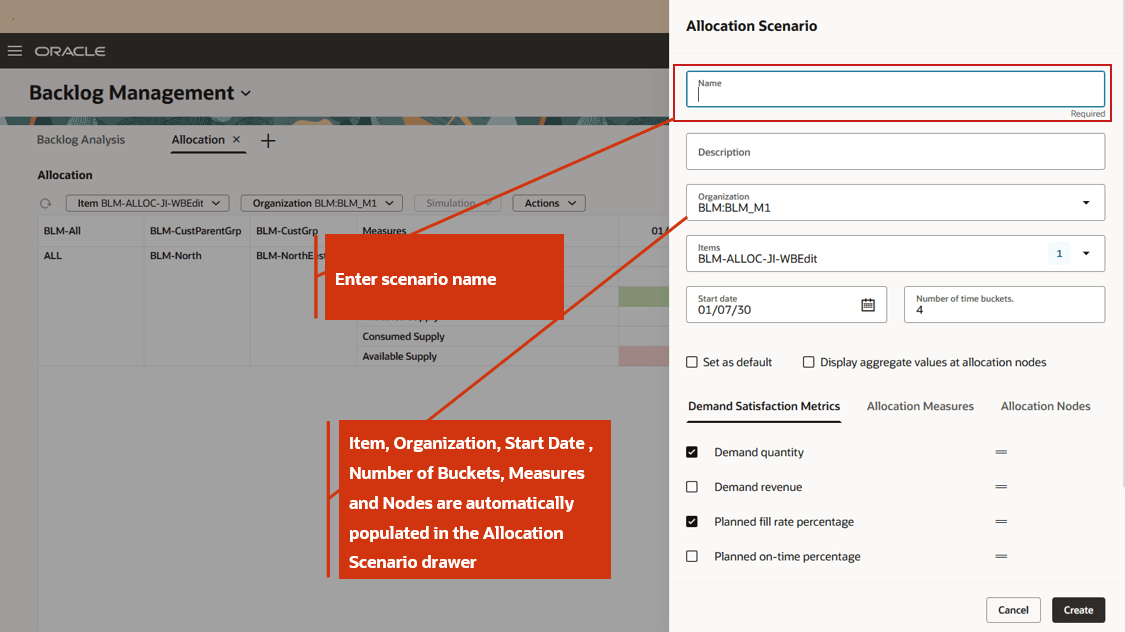
Enter Scenario Name and Click Create
Predefined Page Group
The predefined page group Backlog Plan Overview includes Backlog Analysis and Allocation pages. By default, both pages are displayed when you open Backlog Management from the Redwood Supply Chain Planning work area. You now have the option to create a user-defined page group. If you do not use the allocation feature and prefer not to display the Allocation page, you can create your own page group that includes only the Backlog Analysis page.
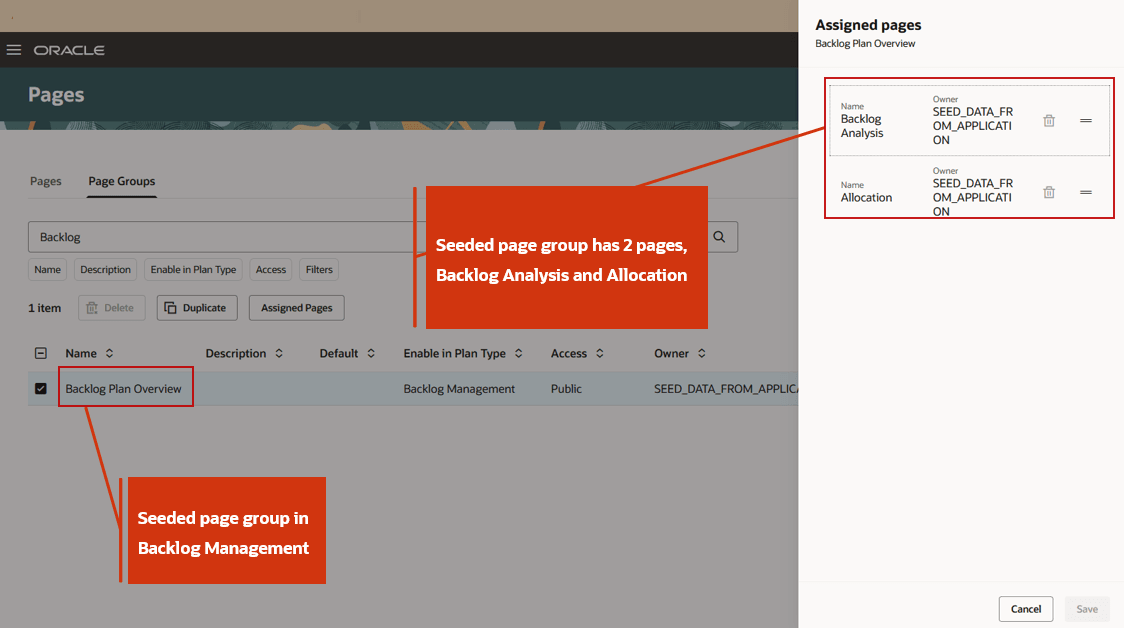
Seeded Page Group Backlog Plan Overview
Steps to Enable
Use the Opt In UI to enable this feature. For instructions, refer to the Optional Uptake of New Features section of this document.
Offering: Supply Chain Planning
Tips And Considerations
If you want to use the Redwood: Review and Update Allocations Using a New User Experience feature, then you must opt in to its parent feature: Order Backlog Management. If you’ve already opted in to this parent feature, then you don’t have to opt in again. To use this feature, you must also opt in to either the Attribute-Based Planning feature or the Project-Driven Supply Chain feature.
Additional tips and considerations:
- If you do not specify a start date while creating an allocation scenario, the system defaults it to the current week's Monday when reviewing the data on the Allocation page.
- If you do not enter the number of buckets while creating an allocation scenario, the system defaults to 8 buckets when the scenario data is displayed.
- Save the simulation results to retain changes.
- During a simulation run or save process, all other actions are disabled.
- If you change the item in scenario before first saving the simulation results, those results will be discarded.
- If the manual allocation measure edits are significant, the system may automatically trigger a simulation run with refresh on run simulation. In such cases, results will be saved automatically, and a confirmation message will appear.
- After running a simulation, you must save the simulation before drilling to the Backlog Analysis page to view updated planned dates.
- You can navigate from the Backlog Analysis page to the Allocation page only if the sales order is for an item under allocation. Additional conditions include:
- The order line on the Backlog Analysis page must have a valid allocation node.
- The Drill To > Allocation option is enabled only if a single order line is selected. It is disabled if none or multiple order lines are selected.
- Upon navigation, only Save as New Scenario is enabled. Run Simulation and Save Simulation are disabled.
- Manual Allocation values cannot be modified immediately after navigation.
- To enable simulation, first save the navigation results as a new scenario, then edit the scenario.
- On subsequent navigations from the same order line, the Allocation page will display data in the context of the navigation. The Allocation Scenario field will be blank, and it will not default to the last saved or default scenario.
- Data security is enforced based on Item and Organization.
- You can export allocation data from the Allocation page to Excel.
- You can create, edit, and delete allocation scenarios using following REST Endpoints:
- Allocation Scenarios
- Backlog Management Allocation Nodes
- Backlog Management Supply Allocation Consumptions
- Allocation Measure Reports
See REST API for Oracle Supply Chain Management Cloud here for more details.
Key Resources
- Refer to the Cloud Applications Readiness content for the following 25B Supply Chain Planning feature for more information:
- Redwood: Analyze and Replan Backlog Using a New User Experience
Access Requirements
Users who are assigned a configured job role that contains these privileges can access this feature:
- Monitor Backlog Management Work Area (MSC_MONITOR_BACKLOG_MANAGEMENT_WORK_AREA_PRIV)
- Create Backlog Plan (MSC_CREATE_BACKLOG_PLAN_PRIV)
These privileges were available prior to this update. The following site-level profile should be enabled:
- Redwood Backlog Management Pages Enabled (ORA_MSC_BACKLOG_MANAGEMENT_REDWOOD_ENABLED)