 Redwood: Diagnose Scheduling Delays in Backlog Management
You can review the sources, calendars, lead times, and other criteria that Oracle Backlog management uses to schedule selected items. A graph highlights any material, capacity, or supplier delays that prevent an order line from meeting its requested date. With these insights, you may be able to resolve the delay, such as by adjusting item allocations or expediting transportation.
You can access Schedule Diagnostics for an individual order line from the Redwood Supply Chain Planning work area by selecting Backlog Management in the context selector and opening the Backlog Analysis page. From there, select an order line and then select Scheduling Diagnostics from the Actions menu.
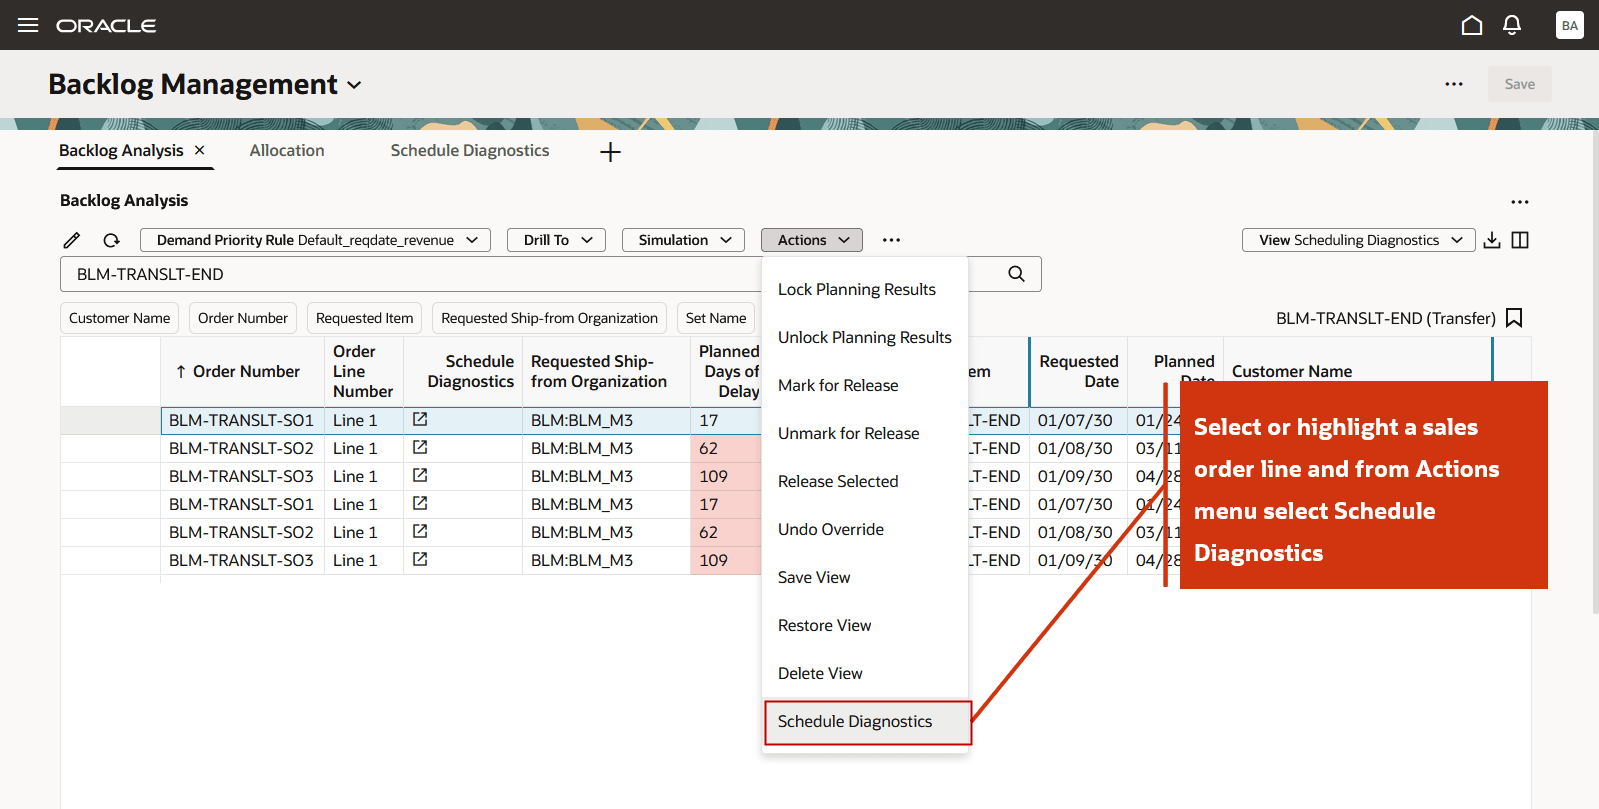
Highlight an Order Line and Select Schedule Diagnostics from Actions Menu
Alternatively, you can access the Schedule Diagnostics directly by clicking the icon in the Schedule Diagnostics column for the corresponding order line.
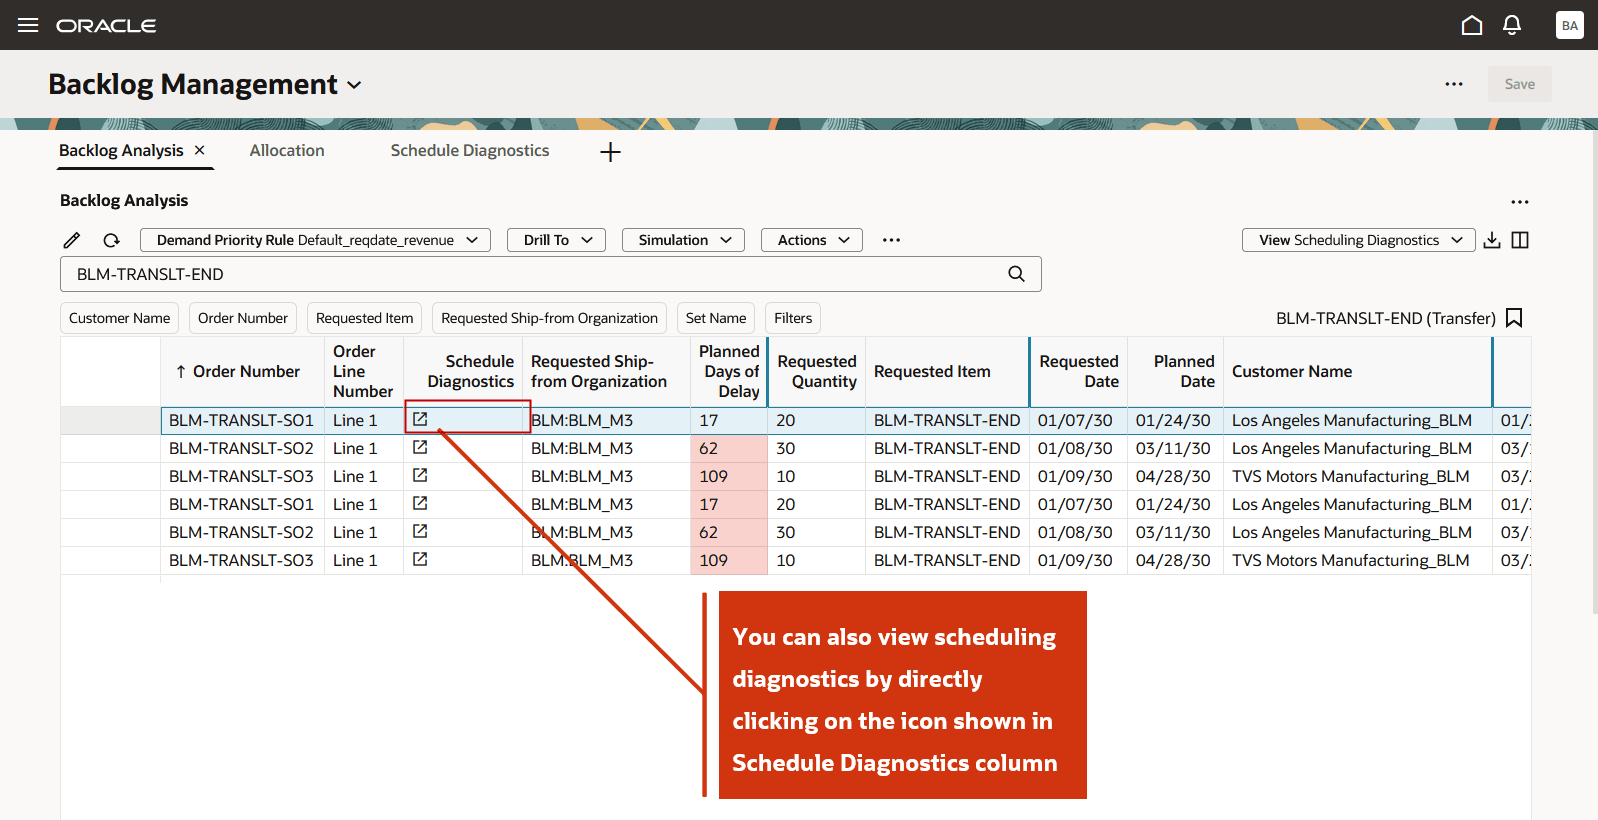
Click the Icon in Schedule Diagnostics Field
Note: The Schedule Diagnostics icon appears for an order line only if a scheduling diagnostics report has already been generated for that order line.
When you open the report, a new tab displays the scheduling diagnostics report for the selected order line in a graphical format. The report shows the entire solution path that was explored to reschedule the order, including all nodes from which supply was consumed to meet demand.
For example, the report highlights that a demand node requested 20 units on January 7, 2030. Of this demand, 10 units were satisfied on time using ATP supply from the same organization, BLM:BLM_M3. The remaining 10 units were fulfilled late, after 17 days, by transferring supply from an upstream organization, BLM:BLM_M2.
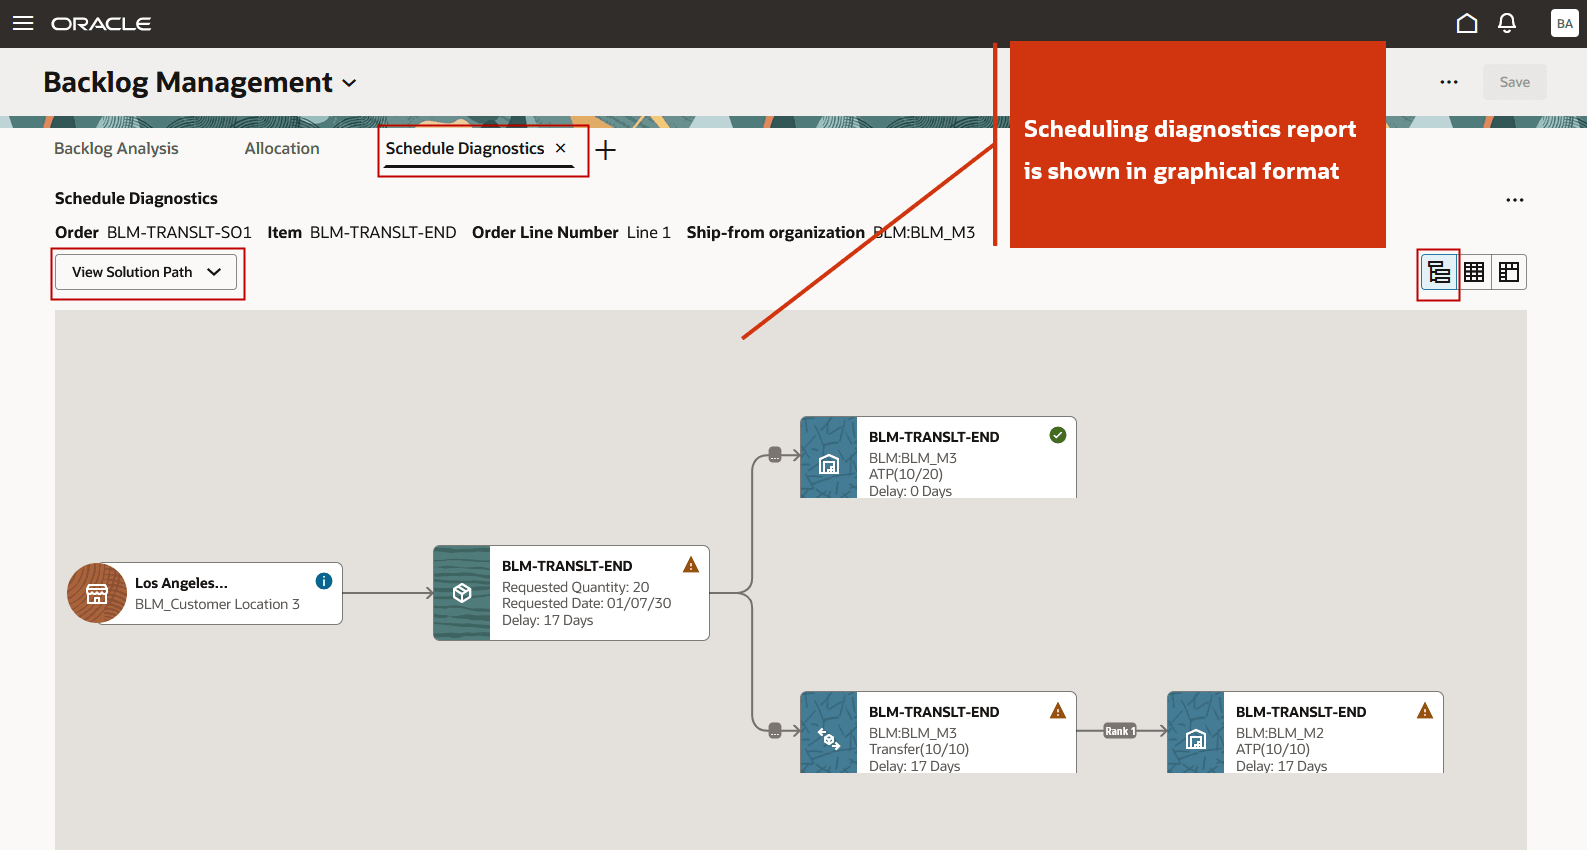
Solution Path
You can switch to the Critical Path view from the View menu. Selecting Critical Path allows you to focus on the nodes that were responsible for the maximum delay or the planned date for the selected order line.
The critical path represents a subset of the overall solution path, highlighting only the nodes that directly impacted the delay or planned date. Nodes that are not part of the critical path are displayed in a dimmed color. There is a single critical path for the entire solution.
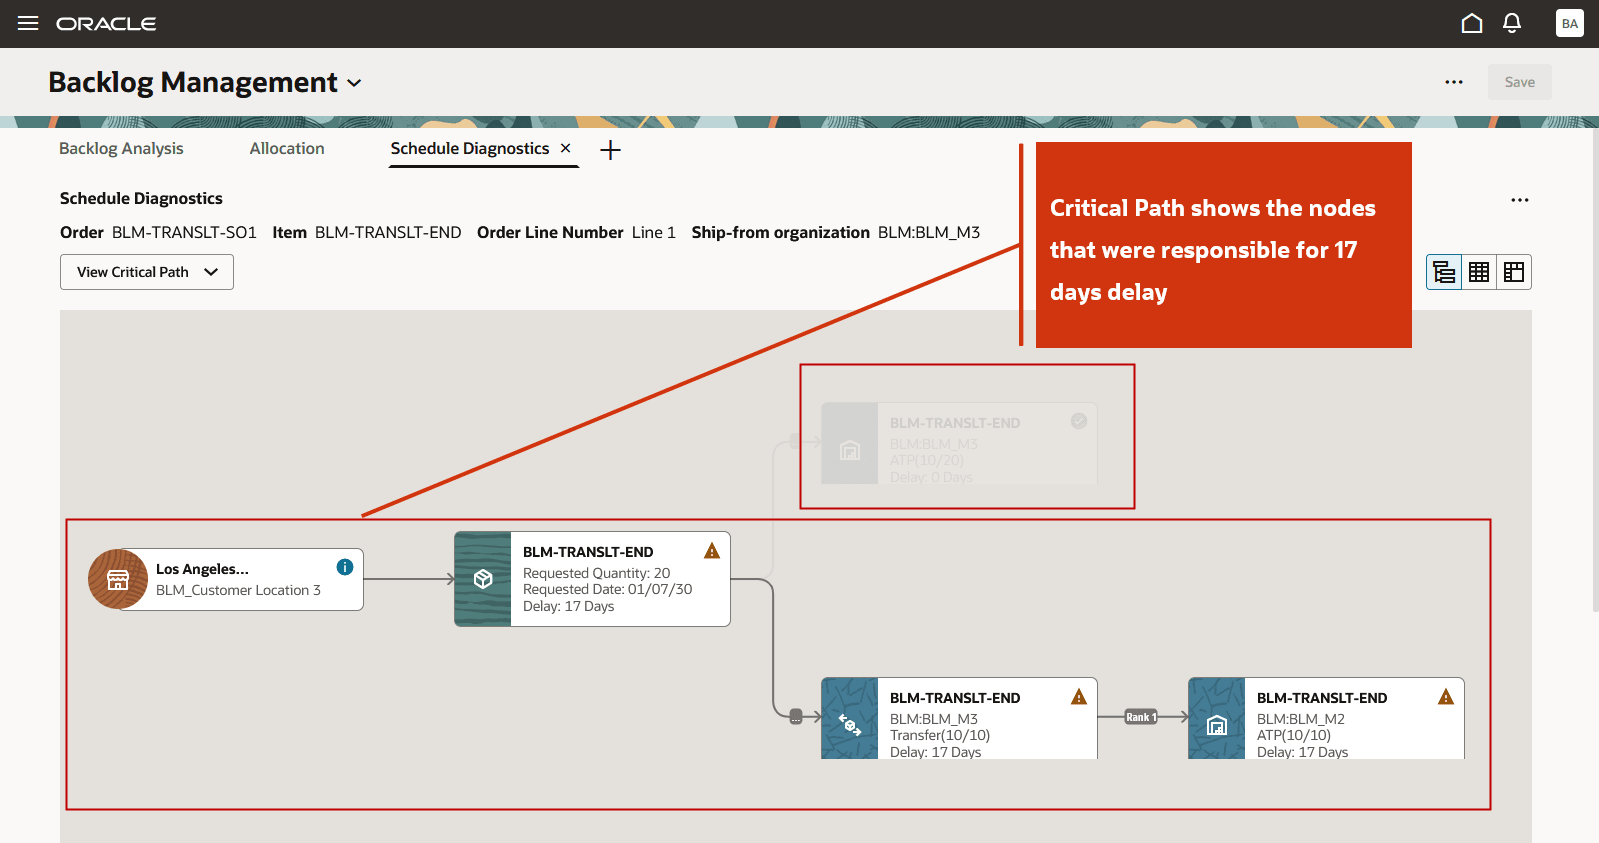
Critical Path
You can also switch the report to View Complete Path which shows all nodes that were explored even if no supply was consumed from those nodes. You can select the Status icon to view important attributes for each node shown in the scheduling diagnostics graphical view.
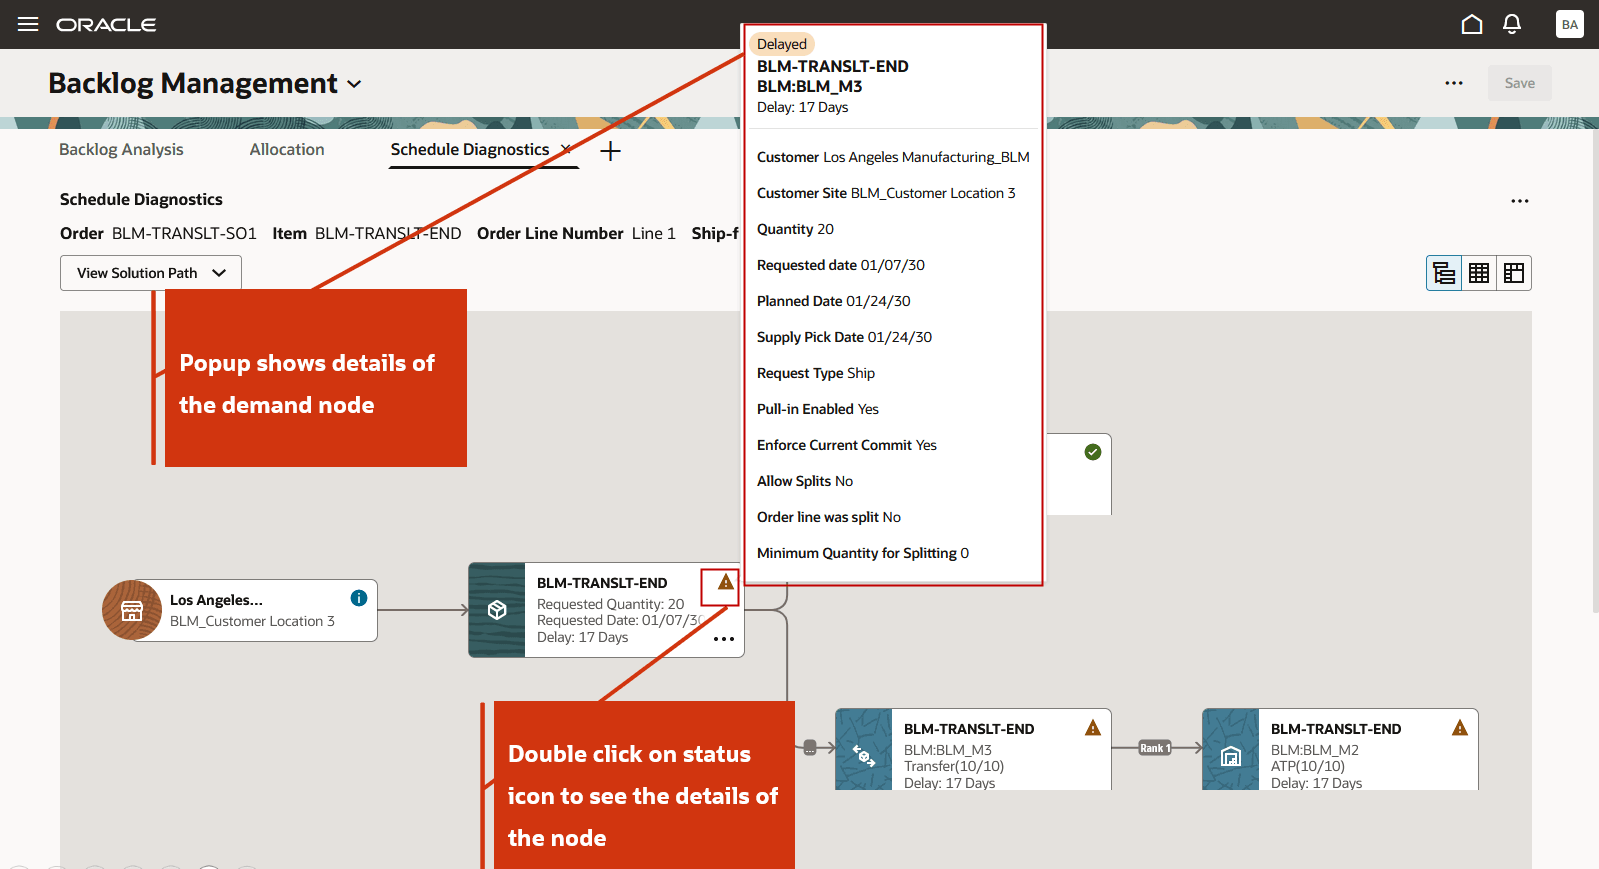
Attribute Details for the Requested Demand Node
If the scheduling diagnostics report contains many nodes across multiple levels, you can focus on a specific section of the supply path in detail.
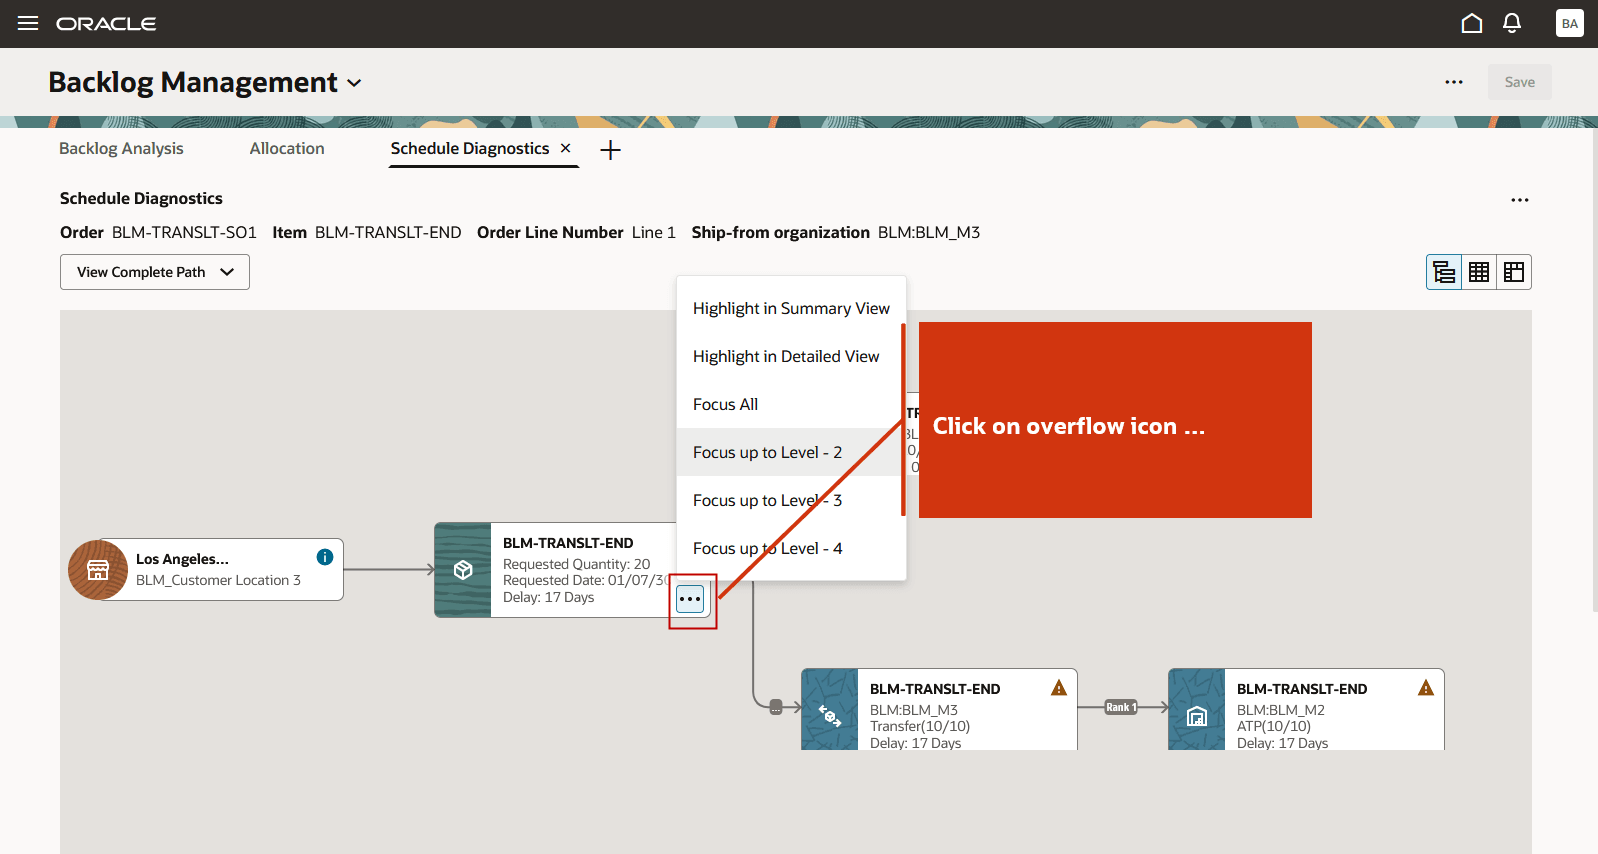
Focus Up to Level 2
The Focus up to 2 level shows the 2 level supply path starting from the node from where the focus functionality is applied.
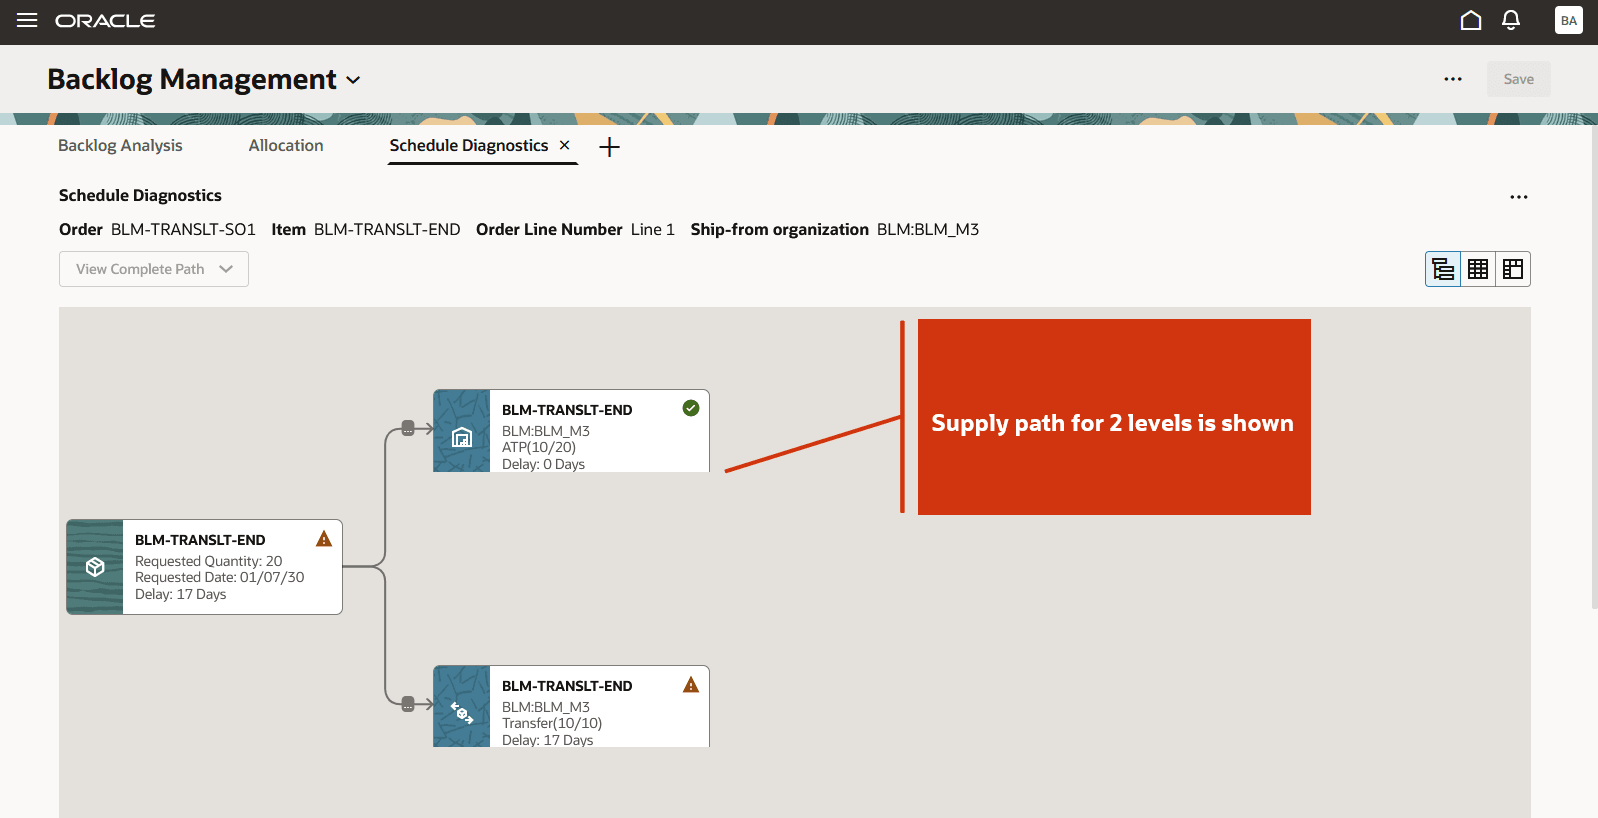
2 Level Supply Path
From the default graphical view, you can switch to the tabular summary view by selecting the See Summary View icon.
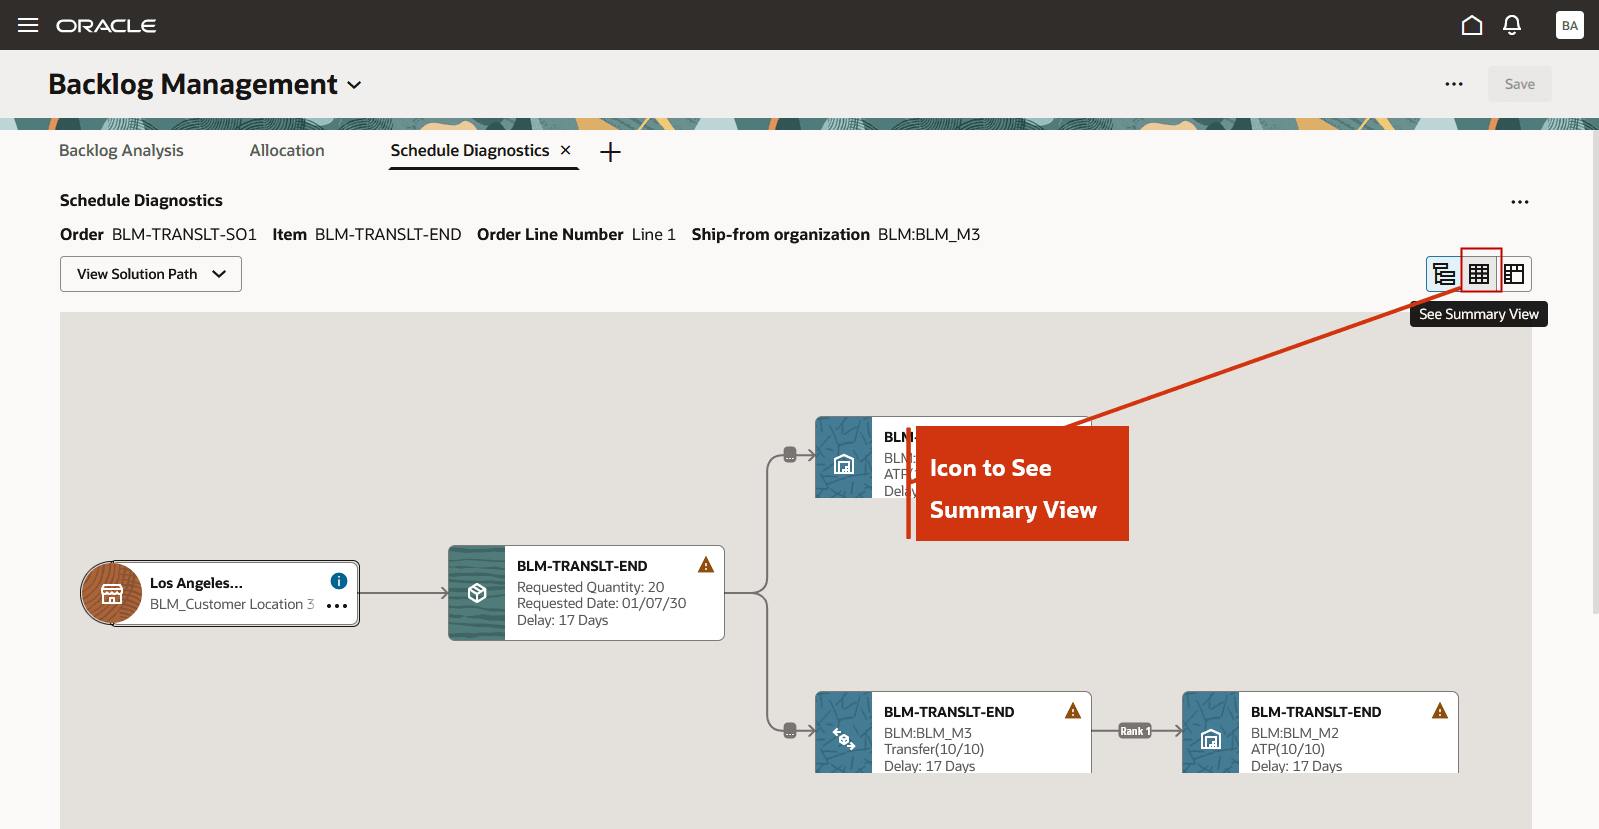
Icon to Show Summary View
The summary view displays following details for each step of the solution path:
- Step Number
- Node Visit
- Item/Resource and Location/Organization
- Quantity Sought and Quantity Found
- Date Needed and Date Found
- Action such as Transfer from Rank 1, Use Available Supply, CTP from Transfer Supply
- Results
- Details such as Backlog Planning rule, Infinite Time Fence date
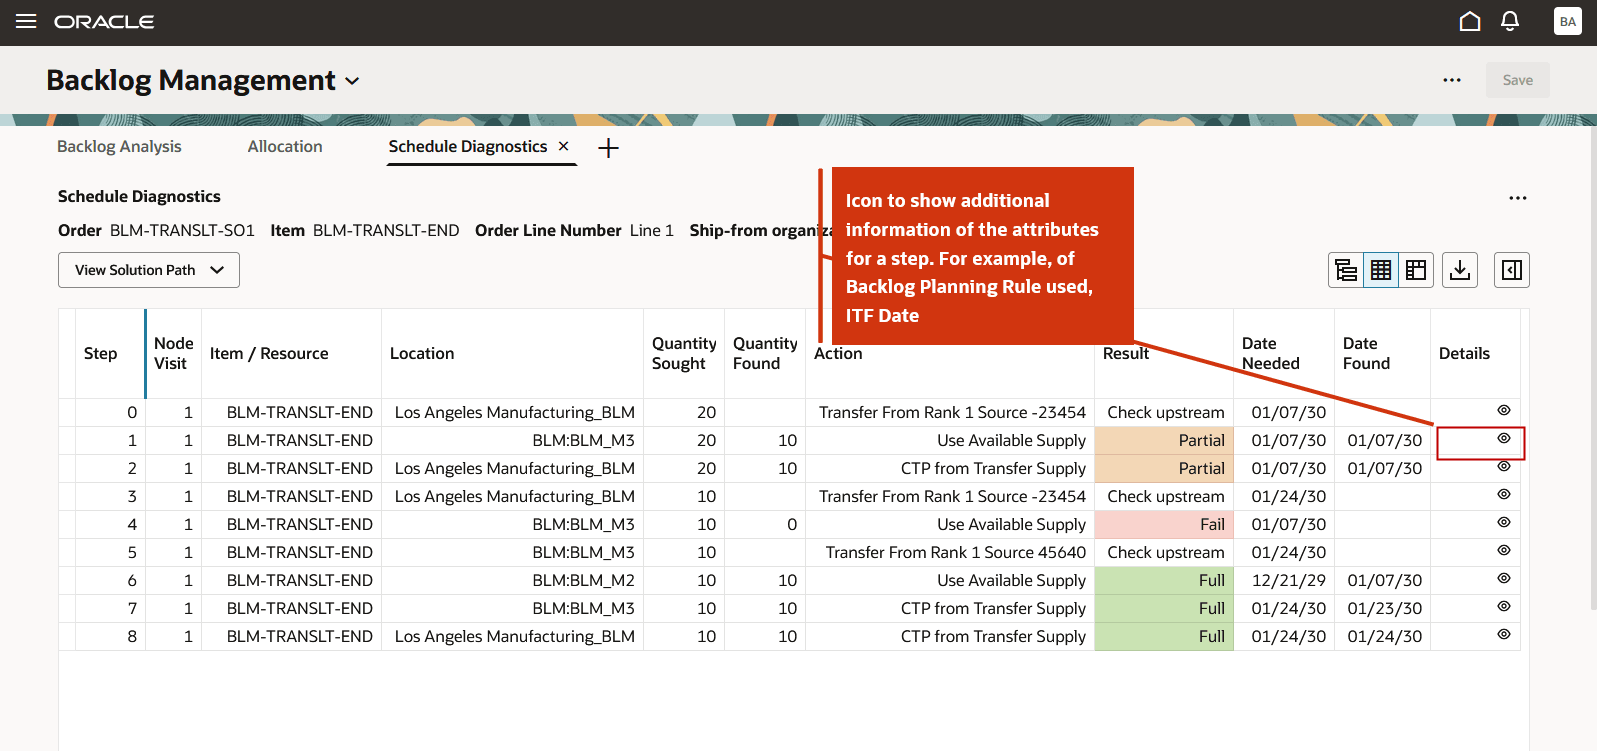
Summary View
Additional details for a step are displayed in a drawer. You can navigate directly to the details of the next or previous step by using the forward or backward arrow.
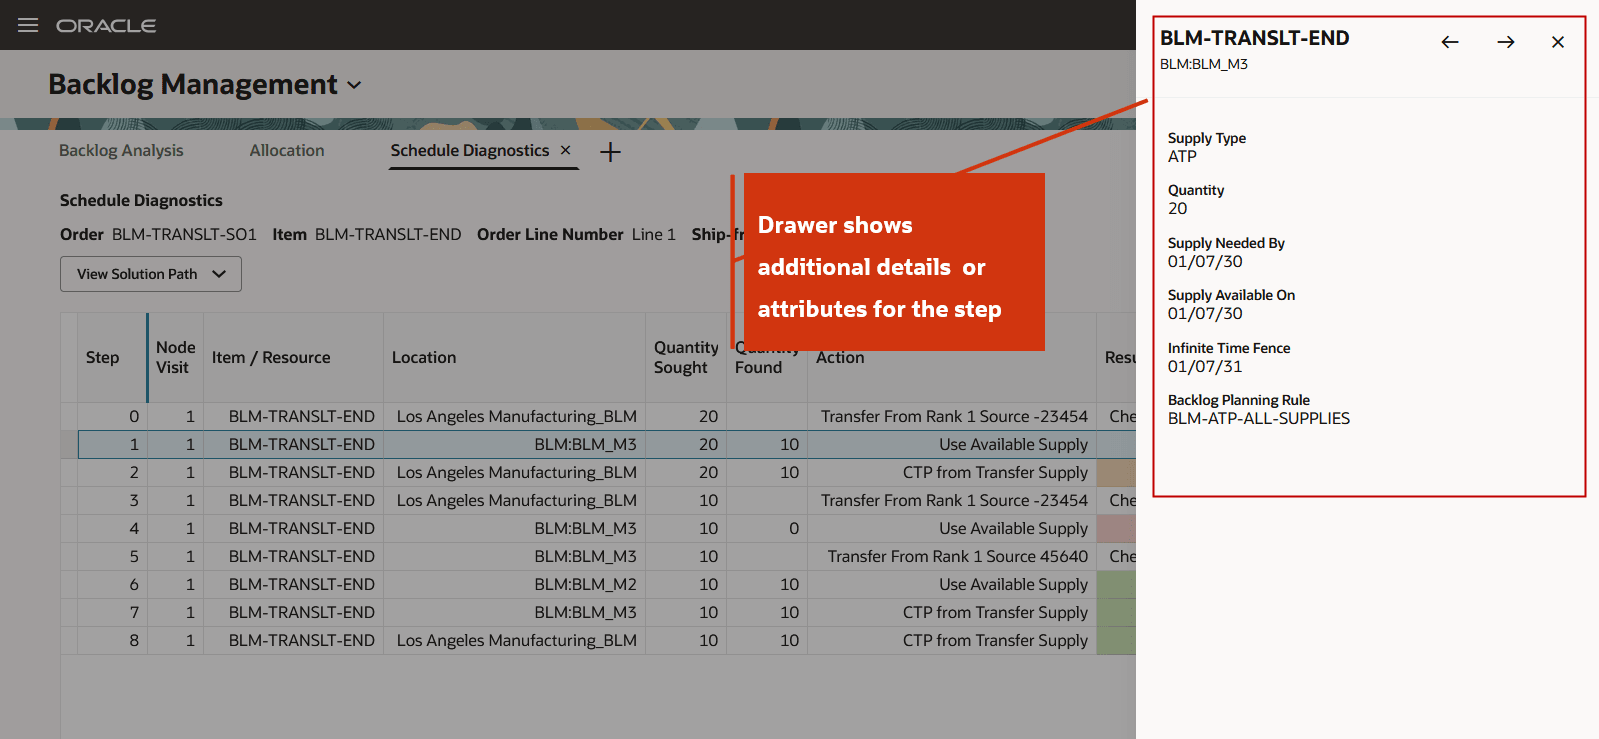
Additional Details for a Step
Click the Configure View icon to show, hide, or reorder columns in the summary view.
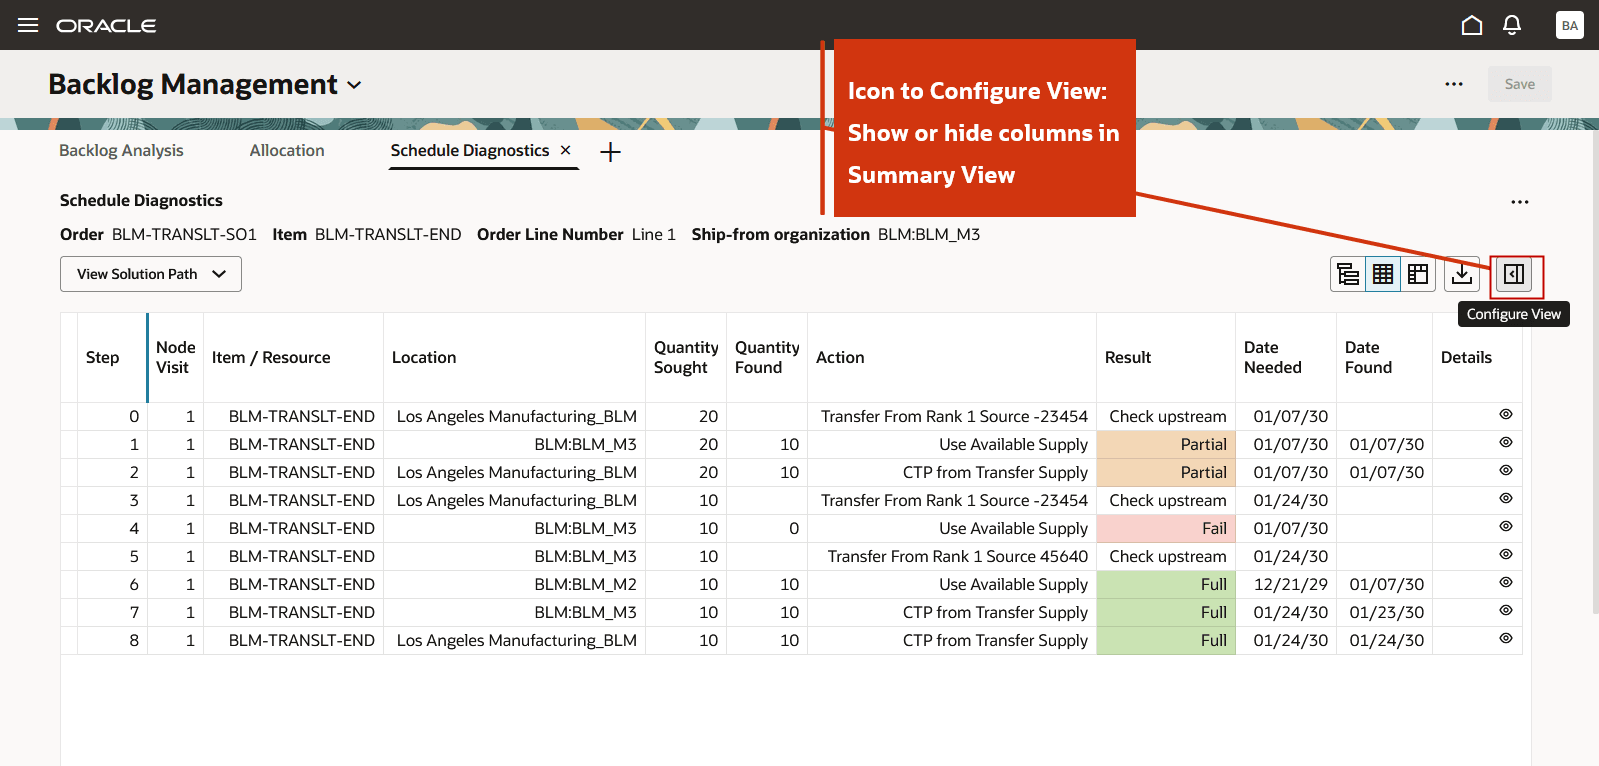
Configure View Icon
In the Configure drawer, you can show or hide attributes and reorder the columns.
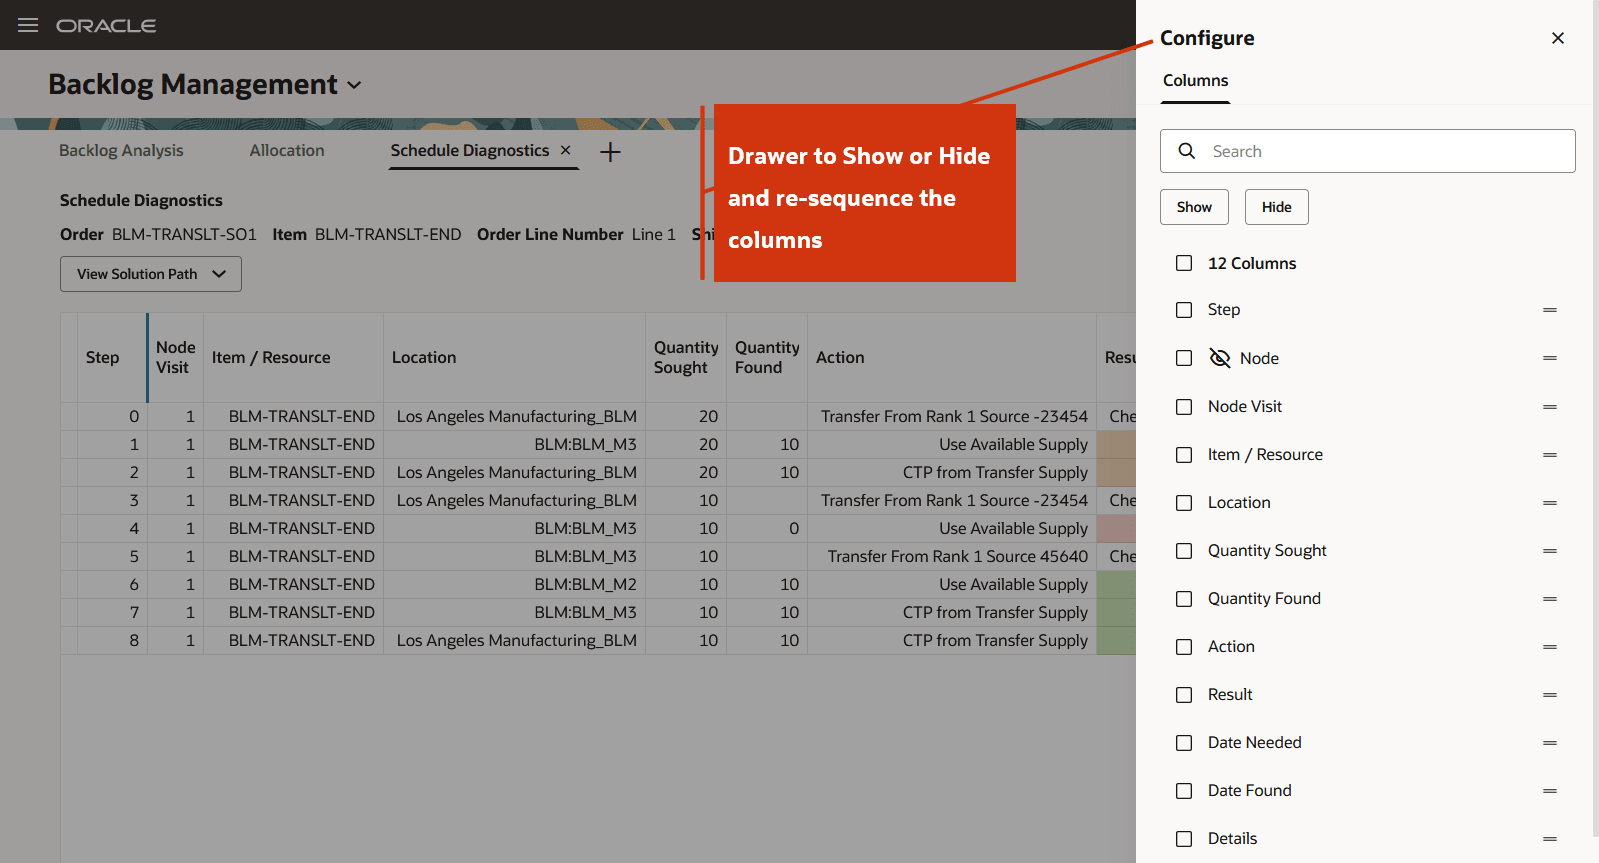
Configure Drawer to Show, Hide, and Reorder Columns
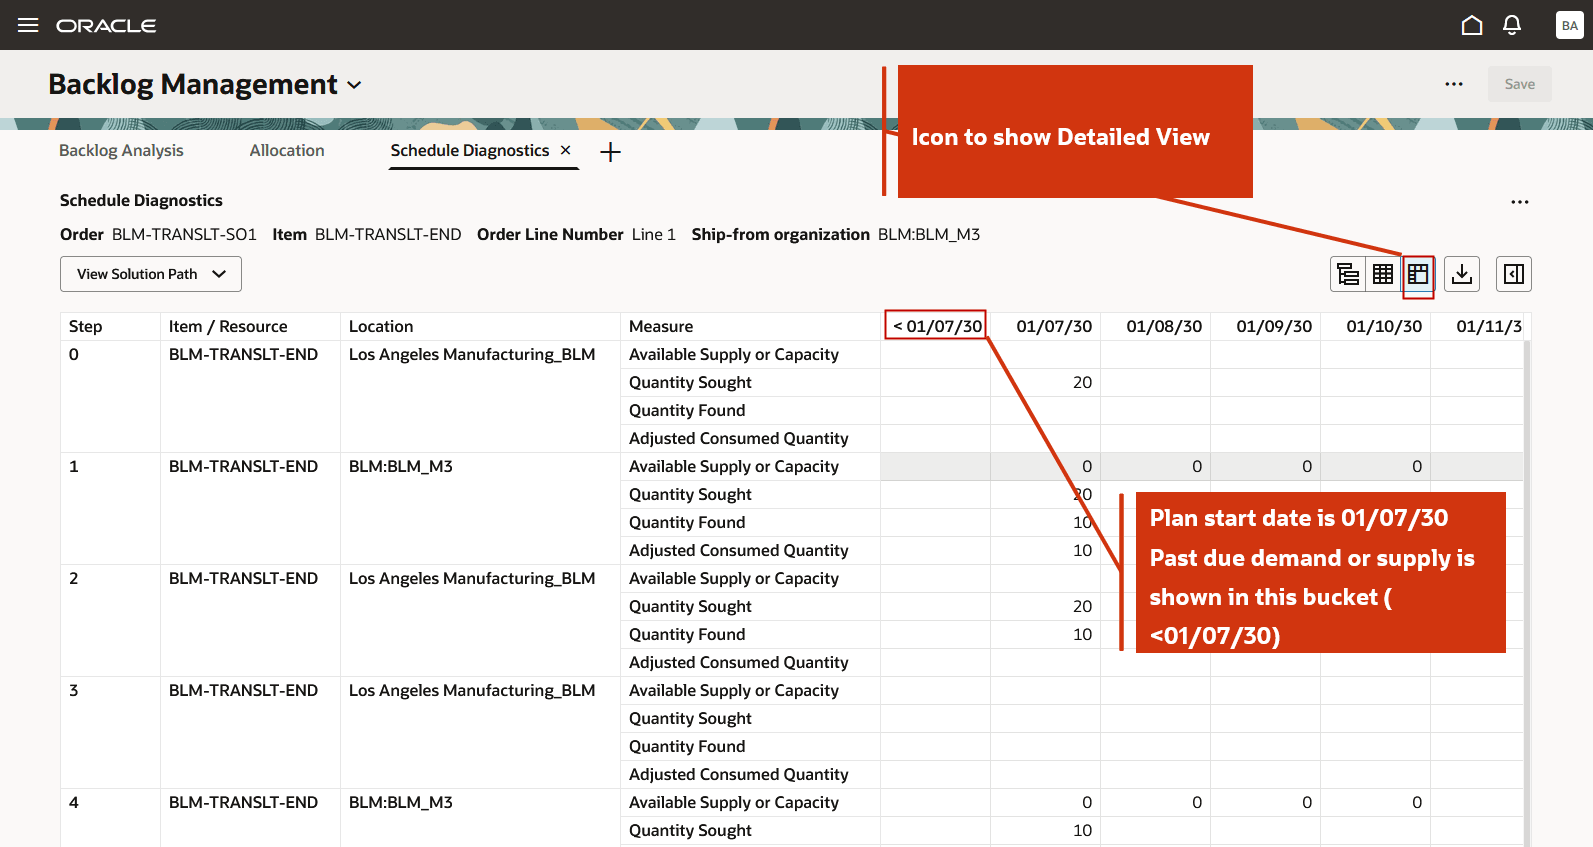
You can also view the detailed view by selecting the See Detailed View icon. The detailed view displays the step, node, measure, and time buckets. By default, 10 daily buckets are shown.
Following are the details of the displayed measures:
- Available Supply or Capacity indicates the Projected Available Balance for items and the available resource after accounting for consumption in that bucket.
- Quantity Sought shows the quantity required to satisfy the full demand in that bucket.
- Quantity Found shows the actual quantity of material or resource available to satisfy the full or partial demand in that bucket.
- Adjusted Consumed Quantity shows the quantity of material or resource consumed and the specific bucket in which it was used.
Detailed View
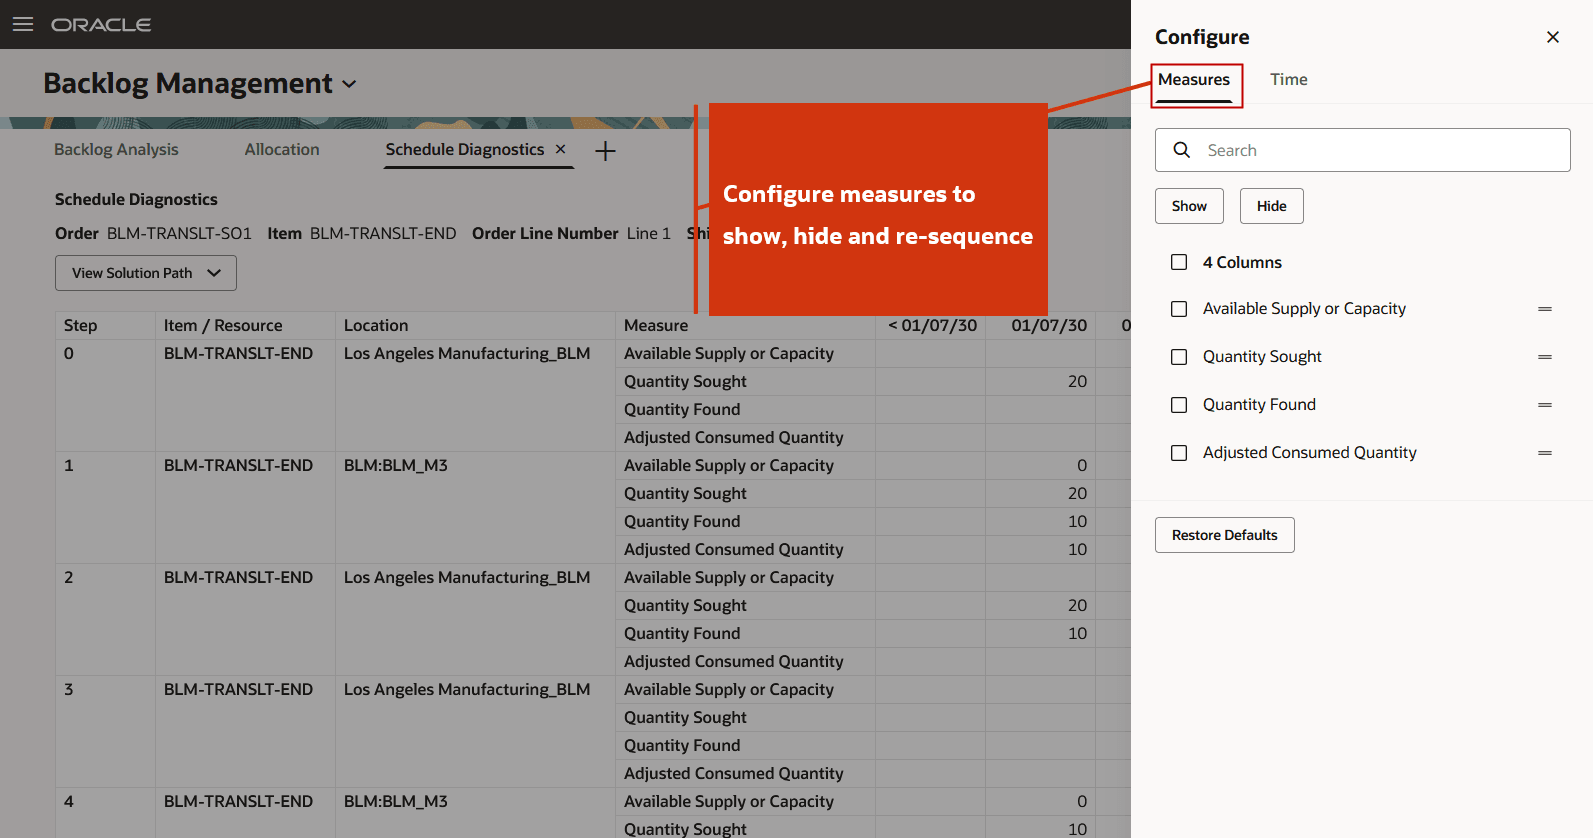
You can use the Configure drawer to add, remove, and reorder measures.
Configure Measures to Show, Hide and Reorder
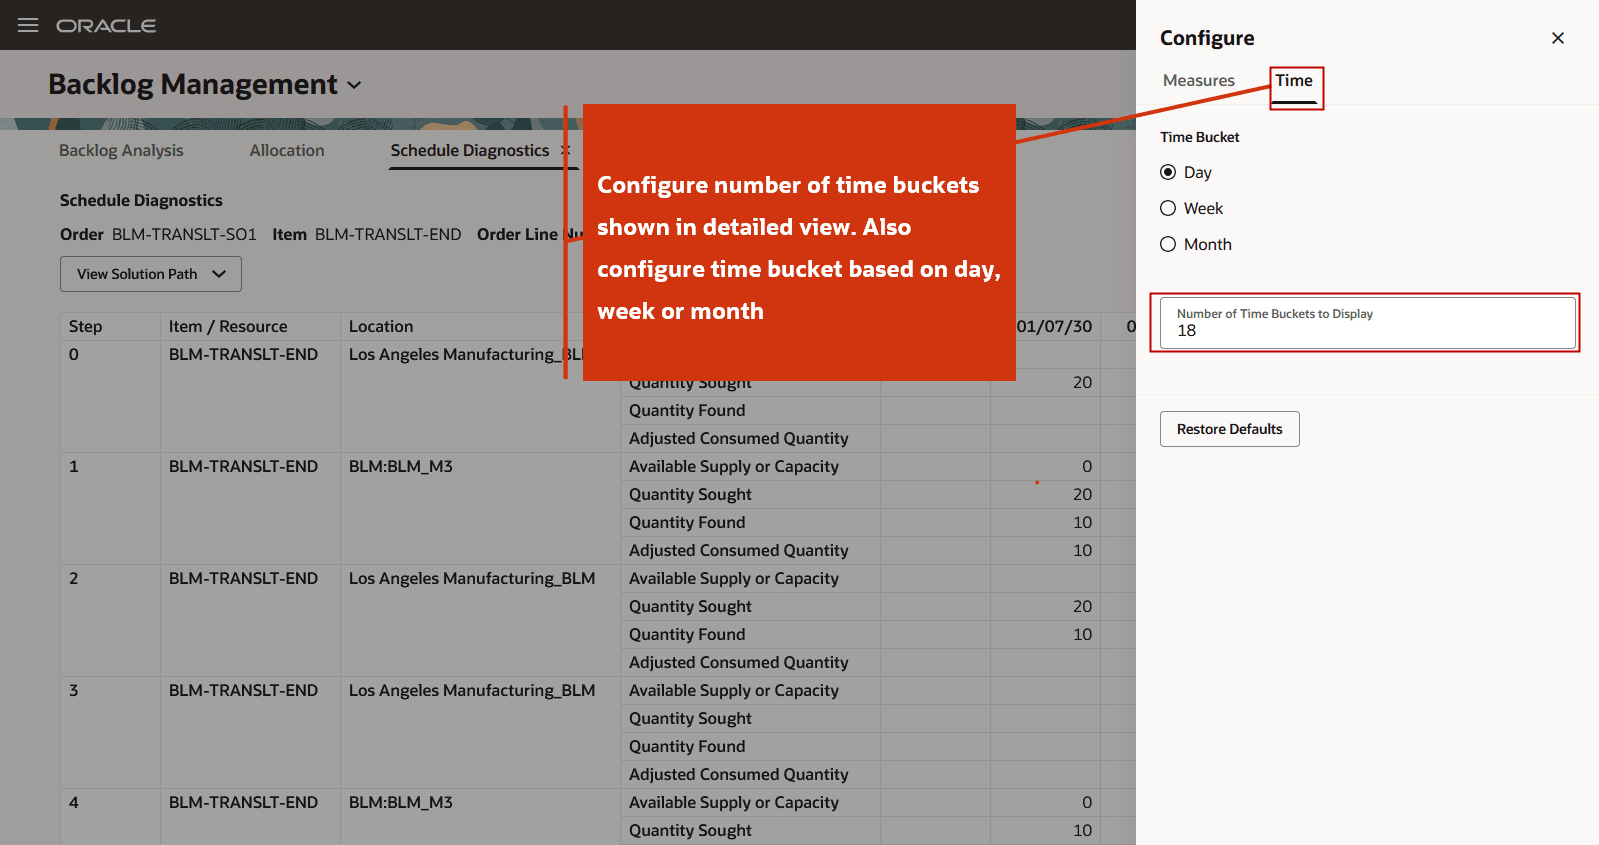
You can also use the Configure drawer to set daily, weekly, or monthly buckets and to specify the number of buckets displayed in the detailed view.
Configure Day, Week, or Month and Number of Buckets
You can use the Scheduling Diagnostics report in combination with the previously available Constraint Analysis feature to analyze Configure-to-Order orders. For Assemble-to-Order orders, scheduling diagnostics are displayed at the model item level. For Pick-to-Order orders, diagnostics are shown at the option item and mandatory component levels. For Pick-to-Order Kit items, scheduling diagnostics are provided at the kit component level, not at the kit header level.
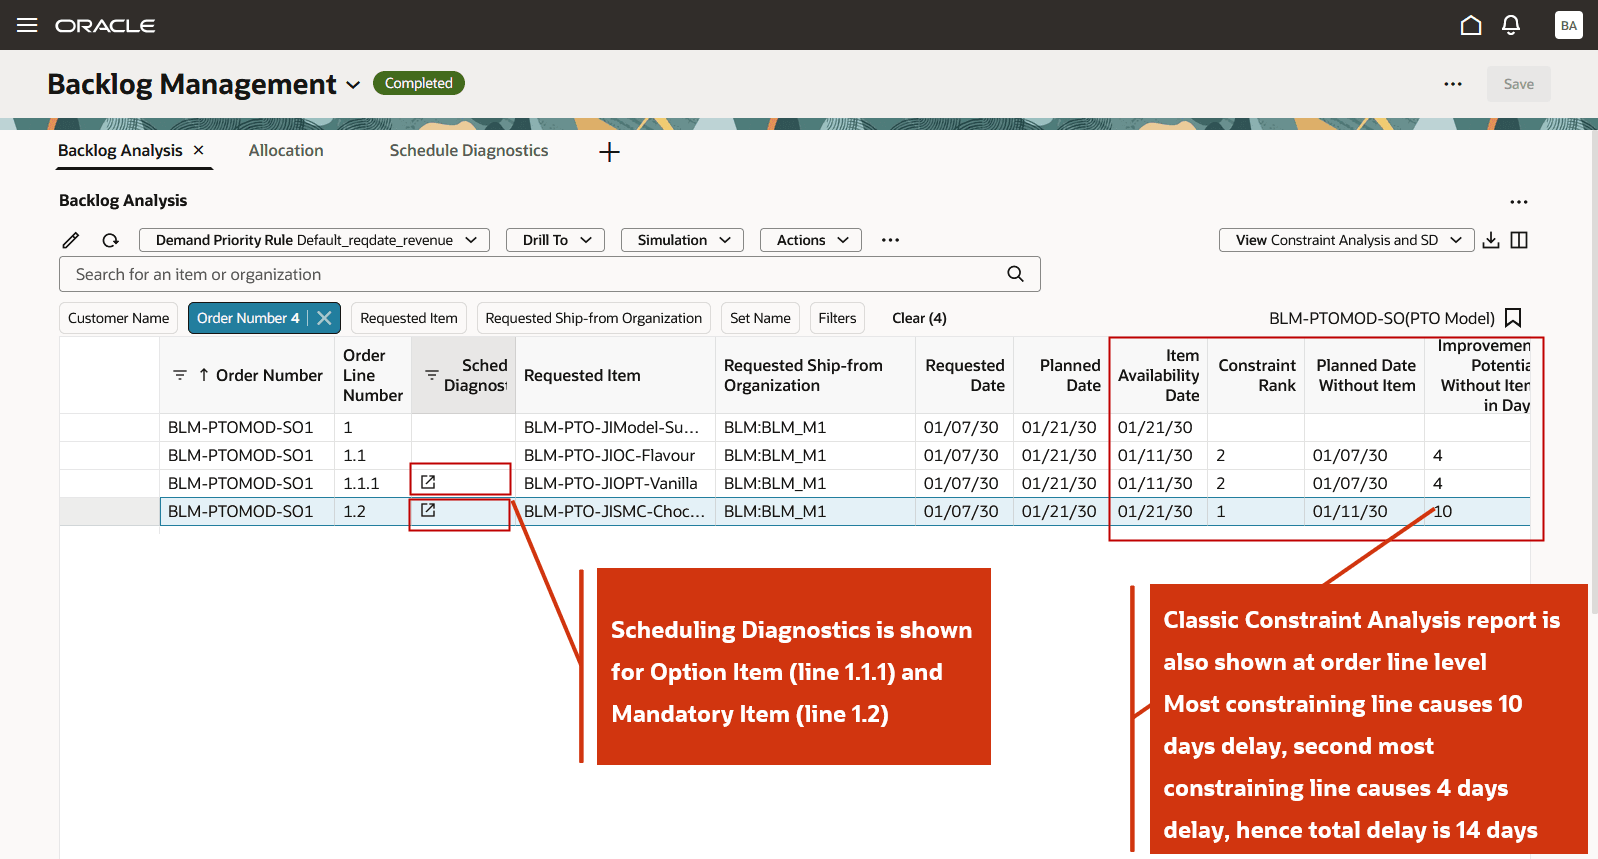
Classic Constraint Analysis and New Scheduling Diagnostics for PTO Model Order
Scheduling diagnostics report for mandatory item shows it is a make item, has no ATP supply and is delayed at Make node.
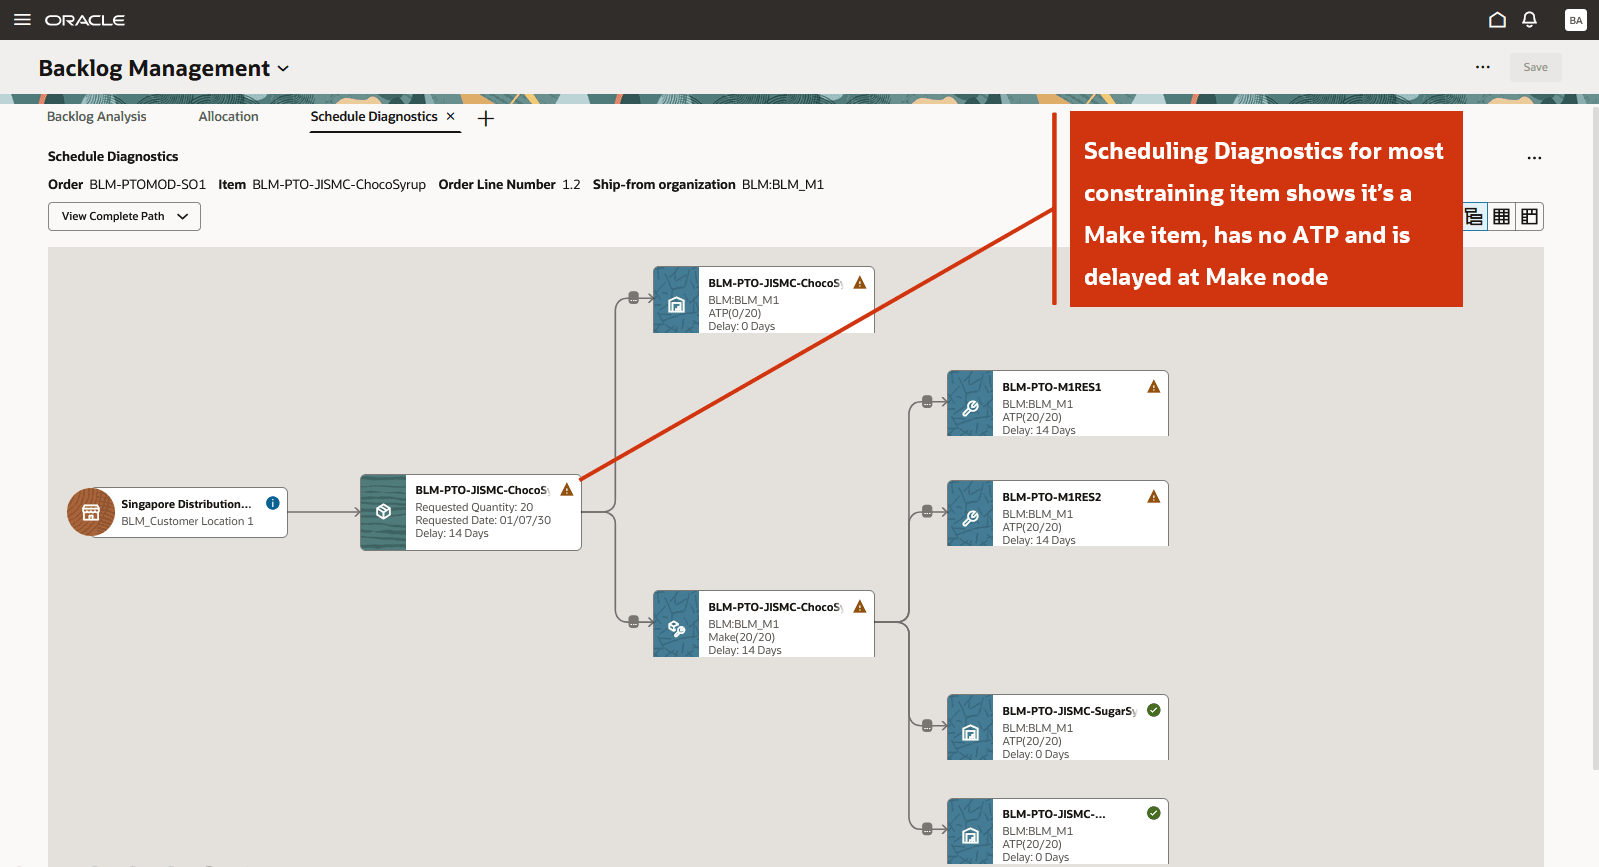
Scheduling Diagnostic Graphical View for Mandatory Item in a PTO Order
You can also view scheduling diagnostics report for an order line of an item under allocation.
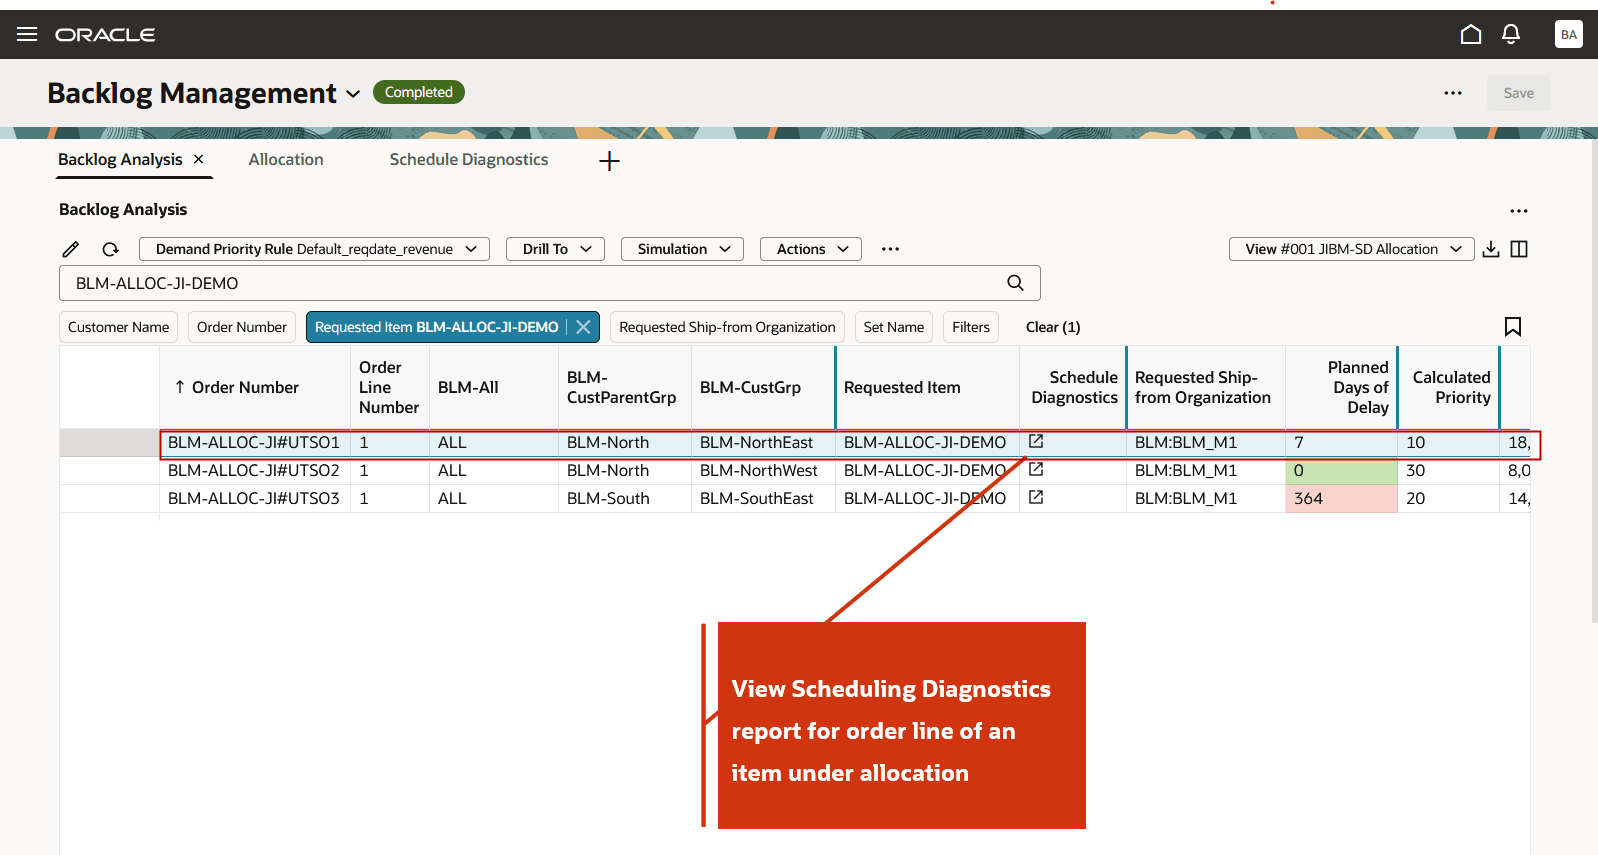
View Scheduling Diagnostics Report for an Order Line of an Item under Allocation
For a sales order line of an item under allocation, the Allocation Consumption is shown in the tool tip. You can access the tool tip by clicking on the Status icon. For the below demand of Requested Quantity 90 units, here is the supply consumed from allocation nodes:
- 20 units from allocation node ALL
- 60 units from allocation node BLM-NorthEast
- 10 units from allocation node BLM-North
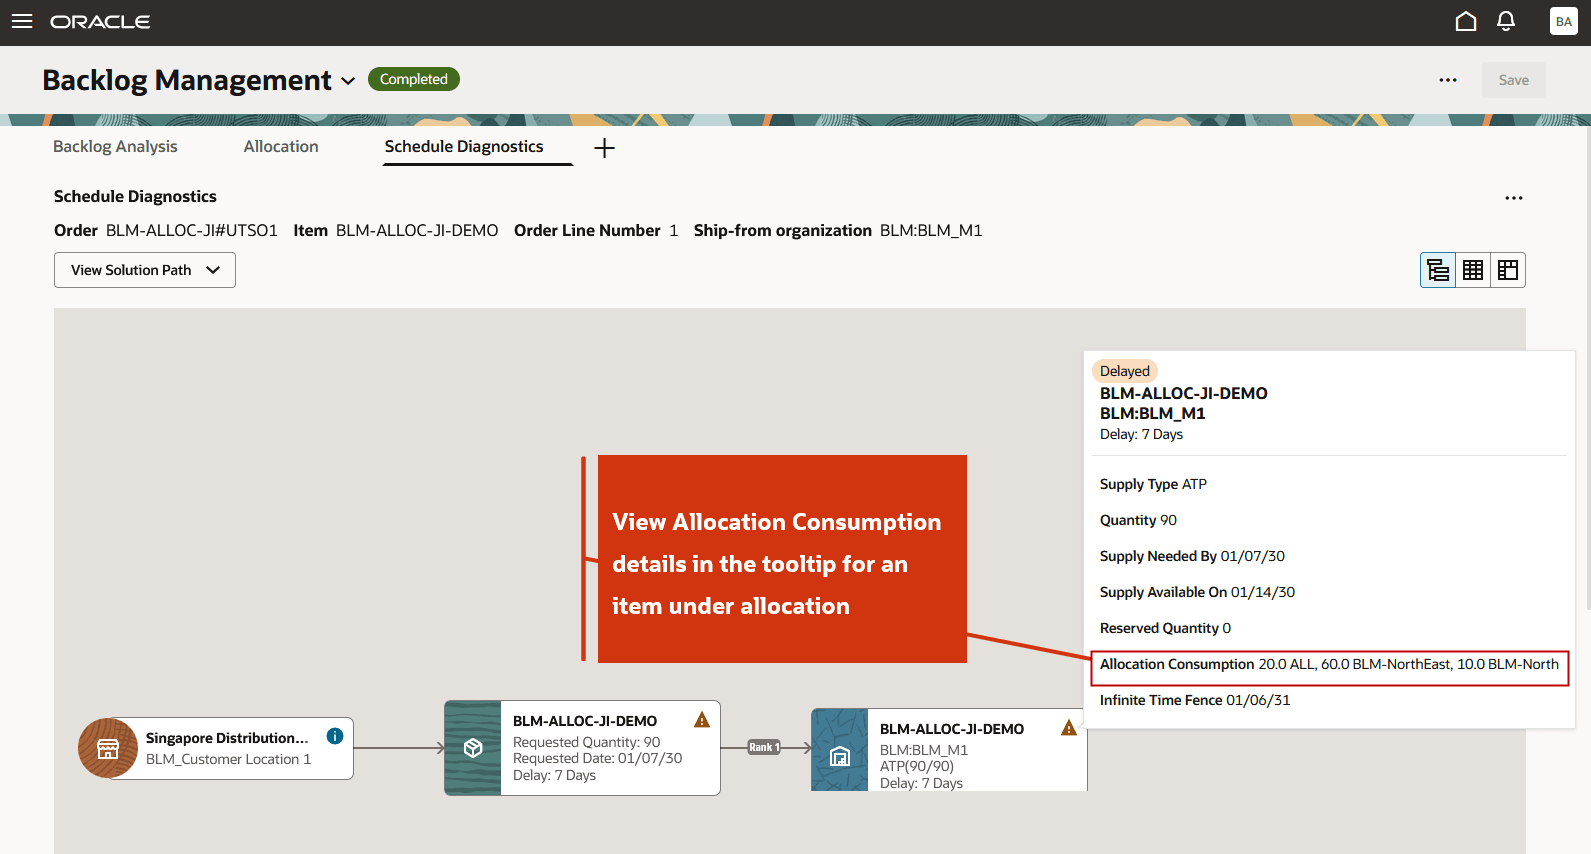
Tool-Tip on ATP Node Shows Supply Consumed from Allocation Nodes to Satisfy the Demand
By default, the Enable scheduling diagnostics check box is disabled. You can enable scheduling diagnostics on the Backlog Planning Options page in Redwood. The scheduling diagnostics report is generated based on the value specified for the Maximum Number of Order Lines in Scheduling Diagnostics attribute. By default, this attribute is set to 1000, which means the diagnostics report is generated for up to 1000 order lines. You can also specify attributes and attribute values for which you want the diagnostics report to be generated. The scheduling diagnostics report is generated only for the order lines whose attribute values are defined in the Backlog Planning Options page.
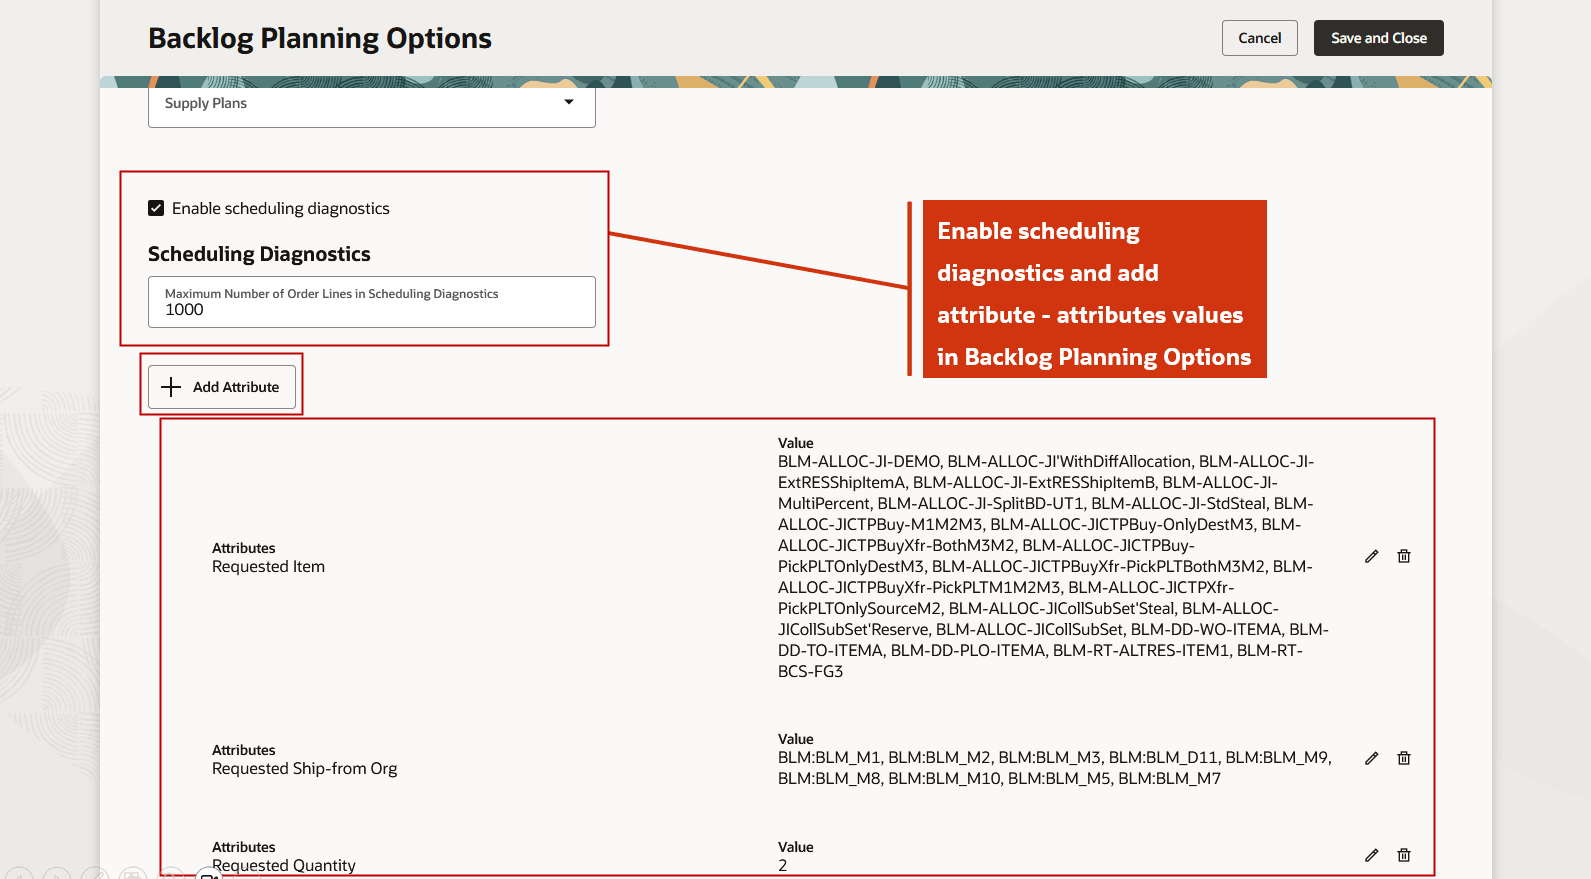
Enable Scheduling Diagnostics
If no attributes are specified, the Scheduling Diagnostics report is generated for the top 1000 order lines based on the calculated demand priority. You can configure the following attributes to define the criteria for generating the scheduling diagnostics report:
- Customer Name
- Demand Class
- Requested Item
- Requested Ship-from Org
- Requested Date
- Scheduled Date
- Requested Quantity
- Order Revenue
- Display Attribute (for feeding externally calculated priority)
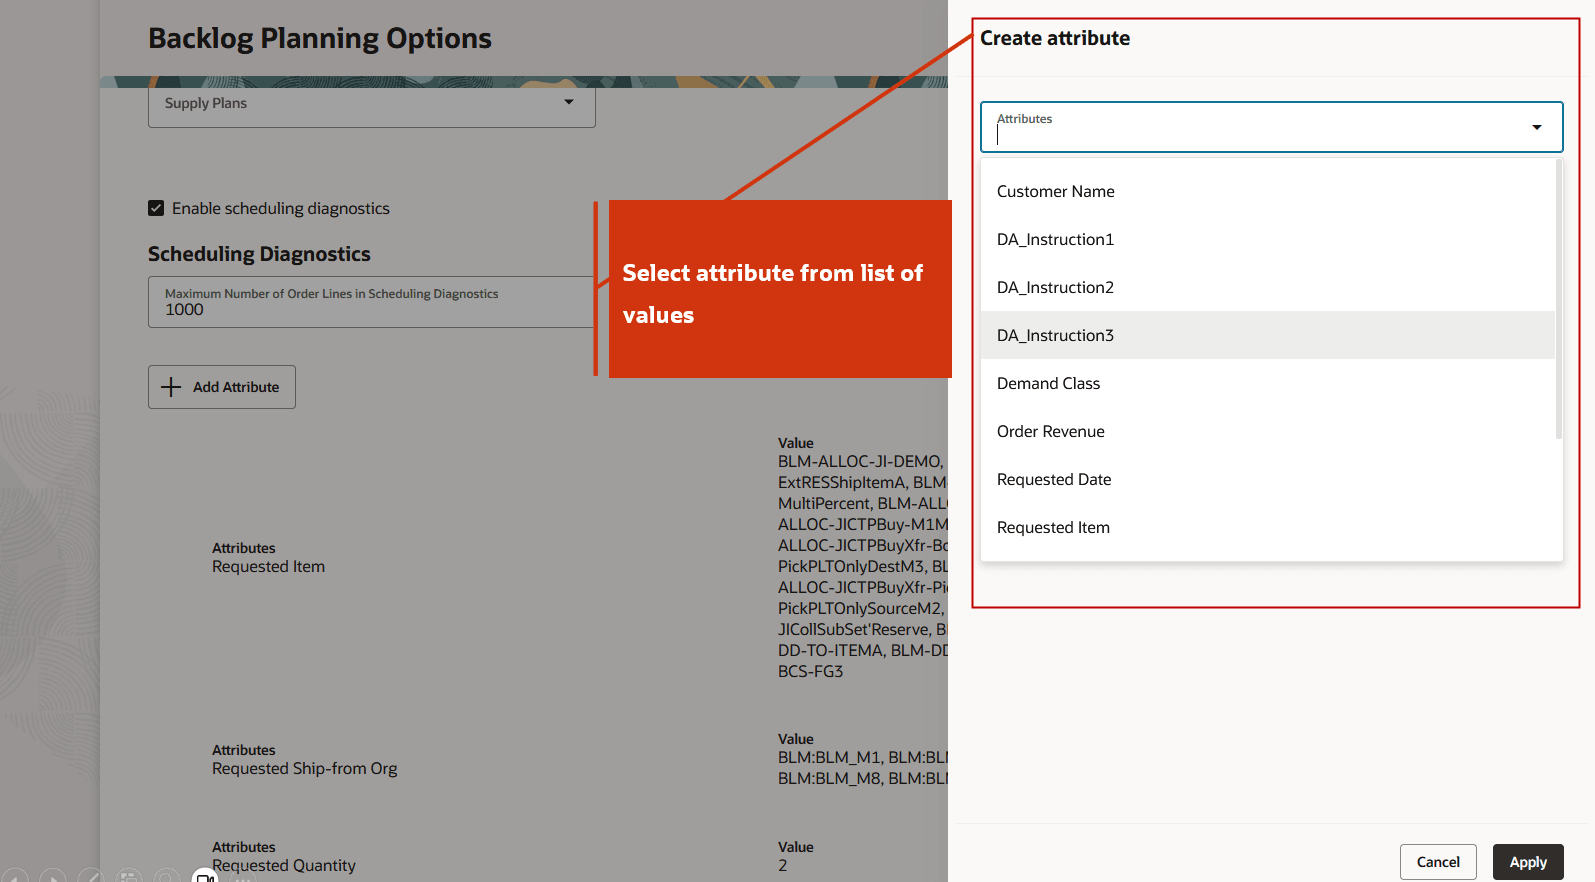
List of Attributes Available for Specifying the Criteria for Generating Scheduling Diagnostic Report
Example: Using attribute setup in Backlog Planning Options to generate the scheduling diagnostics report
The following setup in the Backlog Planning Options page defines the attributes and their values for generating the scheduling diagnostics report:
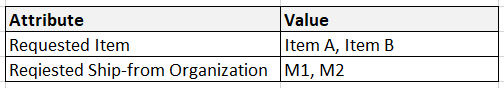
Attribute Set Up for Scheduling Diagnostics in Backlog Planning Options
This means that any order for item A at organization M1, item A at organization M2, item B at organization M1, or item B at organization M2 will qualify for generation of scheduling diagnostics. The scheduling diagnostics report is generated for order lines SO1, SO2, SO4, and SO5, as these lines meet all the specified conditions in the Backlog Planning Options page.
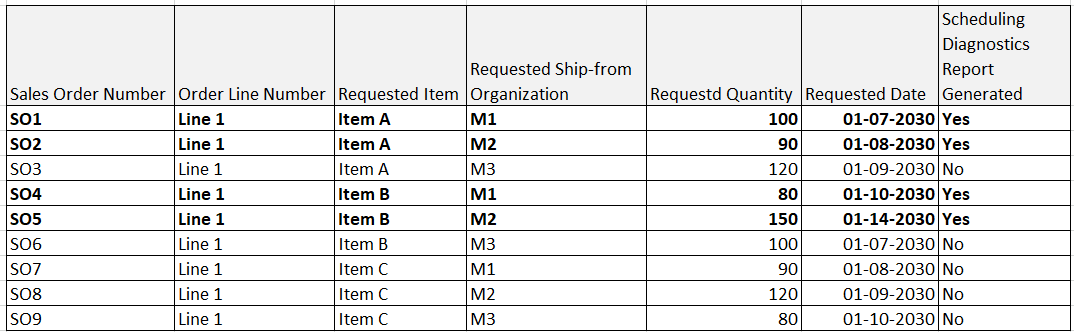
Order Lines for which Scheduling Diagnostics Report is Generated
Steps to enable and configure
Use the Opt In UI to enable this feature. For instructions, refer to the Optional Uptake of New Features section of this document.
Offering: Supply Chain Planning
Tips and considerations
If you want to use the Redwood: Diagnose Scheduling Delays in Backlog Management feature, then you must opt in to its parent feature: Order Backlog Management. If you’ve already opted in to this parent feature, then you don’t have to opt in again.
Additional Tips and Considerations:
- For sets (both shipment and arrival) and configure-to-order orders, use a combination of the classic constraint analysis and the new scheduling diagnostics to analyze the sales order lines and identify problematic lines.
- For order lines split by date or organization, the scheduling diagnostics report shows for each of the split lines.
- You can download scheduling diagnostics report from both summary view and detailed view.
- To delete scheduling diagnostics information for all order lines for which a report has been generated, you can use one of the following options
- Delete Scheduling Diagnostic Information for Backlog Management scheduled process.
- Delete Diagnostic Reports action in the Actions menu on the Backlog Analysis page.
- You can view, create, or update scheduling diagnostic settings and attributes in Backlog Planning Options using following REST Endpoints:
- Backlog Planning Options
- Scheduling Diagnostic Attributes
- Scheduling Diagnostic Attribute Details
- Scheduling Diagnostic Attributes
- Backlog Planning Options
Access requirements
Users who are assigned a configured job role that contains these privileges can access this feature:
- Monitor Backlog Management Work Area (MSC_MONITOR_BACKLOG_MANAGEMENT_WORK_AREA_PRIV) (enables access to work area and enables 'Backlog Management' in the plan switcher)
- Create Backlog Plan (MSC_CREATE_BACKLOG_PLAN_PRIV)
The following site-level profile should be enabled:
- Redwood Backlog Management Pages Enabled (ORA_MSC_BACKLOG_MANAGEMENT_REDWOOD_ENABLED)
These privileges were available prior to this update.