Filter by a relative date range before or after the plan start date in visualizations
You can now configure Redwood visualizations with relative date ranges that start and end before or after the plan start date. On the Time Members subtab on the Data tab in the properties drawer for a visualization, when you set the criteria to Relative to plan start date, the drawer includes Before and After options for both the start and end dates. You can define ranges such as 24 months to 6 months before the plan start date or 3 quarters to 4 quarters after the plan start date. Existing visualizations remain backward-compatible.
This enhancement makes the setup of time-based visualizations easier. You can configure common analysis windows before or after the plan start date without relying on more complex filters.
On the Time Members subtab, when you select Relative to plan start date or Relative to today as the criteria, you can now select Before or After in the Start and End sections.
For example, if you wanted the visualization to display data starting 12 months before the plan start date and ending 6 months before the plan start date, you would make the selections in the following screenshot:
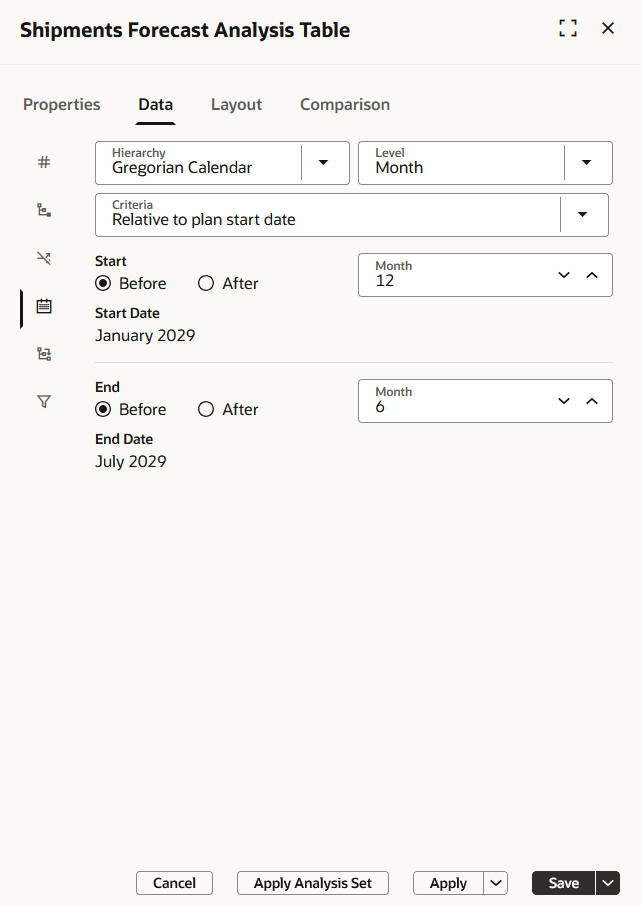
Selections for time range starting and ending before plan start date
If you wanted the visualization to display data starting 2 quarters after the plan start date and ending 4 quarters after the plan start date, you would make the selections in the following screenshot:
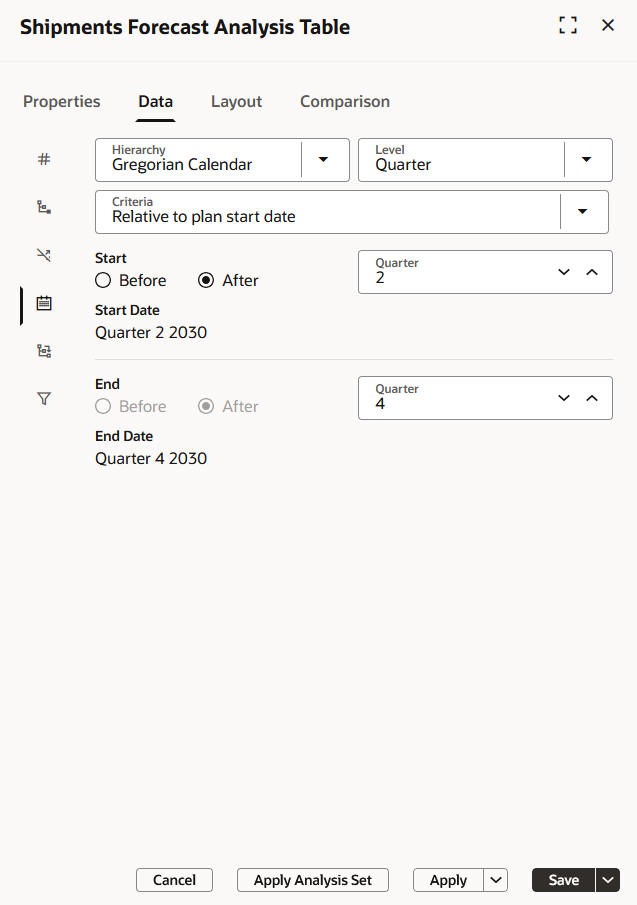
Selections for time range starting and ending after plan start date
In Update 26D, when you open visualizations that were created in previous updates and use the Relative to plan start date or Relative to today criteria, Before is automatically selected in the Start section, and After is automatically selected in the End section.
For example, the following screenshot shows the selections for an existing visualization before Update 26D:
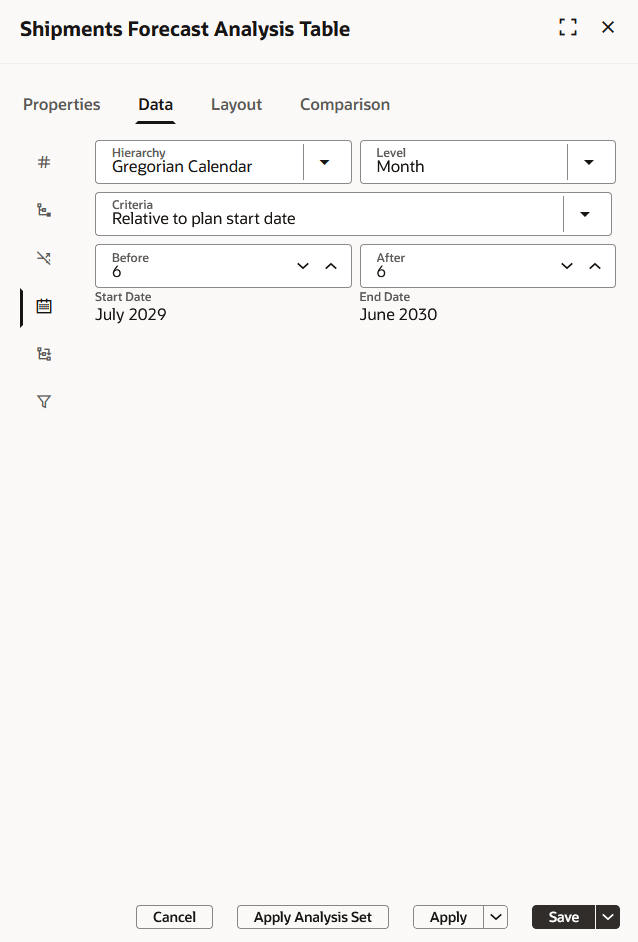
Selections for existing visualization before Update 26D
The following screenshot shows the selections for the visualization in Update 26D:
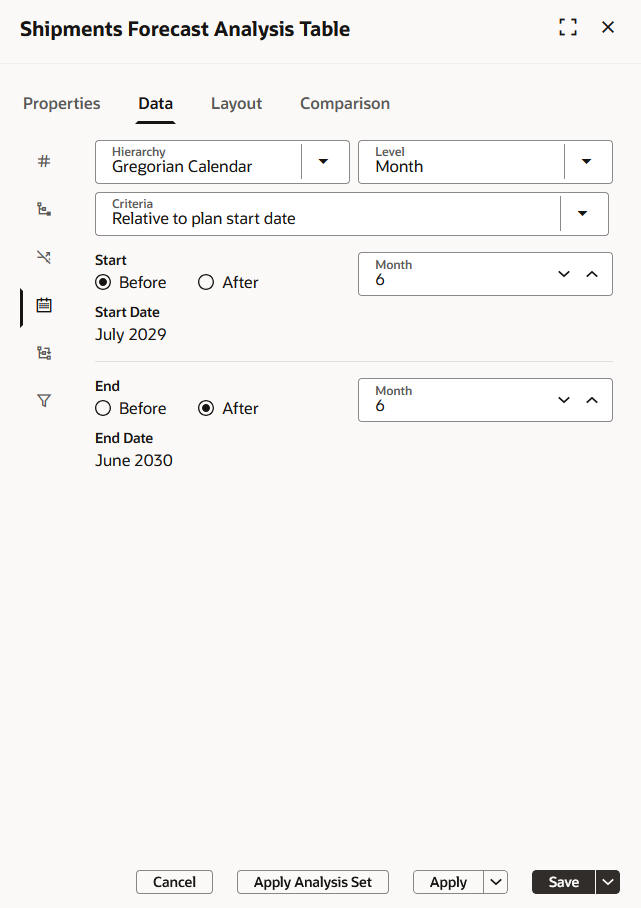
Selections for existing visualization in Update 26D
Steps to enable and configure
Use the Opt In UI to enable this feature. For instructions, refer to the Optional Uptake of New Features section of this document.
Offering: Supply Chain Planning
Tips and considerations
If you want to use the Redwood: Filter by a Relative Date Range Before or After the Plan Start Date in Visualizations feature, then you must opt in to its parent feature: Replenishment Planning. If you’ve already opted in to this parent feature, then you don’t have to opt in again
This feature provides functionality comparable to that on the Time Range tab in the Advanced Filter dialog box that’s opened from the Selector Tool in the Classic UI. Tables and graphs that were configured on the Time Range tab will automatically be converted to the corresponding, relative time ranges when opened in the Redwood UI.
Key resources
Visit https://redwood.oracle.com/ for more information about the Redwood experience.
Access requirements
If you’re using user-defined job roles, then you need to add the privileges identified as new in this update as well as validate that you have the existing privileges that are listed.
| Privilege status | Privilege name and code |
|---|---|
| Existing |
Edit Planning Analytics Configuration MSC_EDIT_PLANNING_ANALYTICS_CONFIGURATION_PRIV |
| Existing |
Maintain Planning Tables MSC_MAINTAIN_PLANNING_TABLES_PRIV |
| Existing |
View Planning Objects Using REST Service MSC_VIEW_PLANNING_OBJECTS_REST_SERVICE_PRIV |