Support personalization of Service Overview KPI Dashboard
Enable a user to personalize the Service Overview dashboard
Building personalization functionality in the Service Overview KPI Dashboard delivers significant value to both users (service representatives) and the business. Different roles across service organizations - such as service reps, team leads, and managers - have varying priorities and responsibilities. A one-size-fits-all dashboard can lead to information overload or overlooked insights. Personalization ensures that each user (service rep) is presented with only the most relevant KPIs, thereby improving focus and decision-making.
This capability also enhances productivity by reducing the time spent filtering or navigating through irrelevant data. By aligning the dashboard with user-specific goals and workflows, teams can more effectively monitor performance, detect issues early, and respond proactively. From a business standpoint, personalized dashboards support better resource management, faster issue resolution, and higher service quality, ultimately driving greater customer satisfaction and operational efficiency.
Steps to enable and configure
Personalization is supported on the Service Overview dashboard, but it requires a one-time setup. By default, this feature is disabled and must be manually enabled by an administrator.
To enable personalization:
- Login with administrative privileges
- Navigate to Service --> Service Dashboard, then open the Service Overview tab
- Click your user initials in the top-right corner and select Edit Page in Visual Builder Studio
- Open the appropriate project to proceed with customization
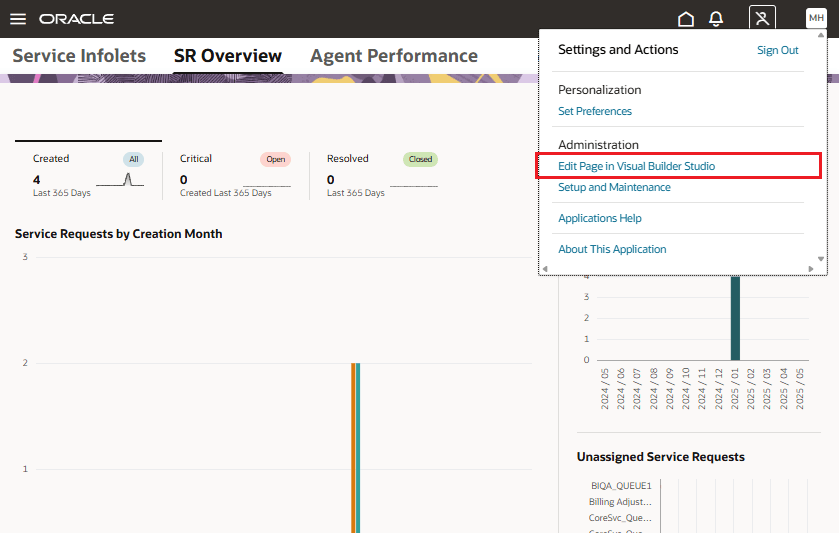
Edit Page in Visual Builder Studio
Locate the "enableKpiPersonalizationOTBI" setting under the otbi section and set its value to "true". Then, publish your changes.
This enables users with the appropriate privileges to personalize their Service Overview dashboard and include additional OTBI reports.
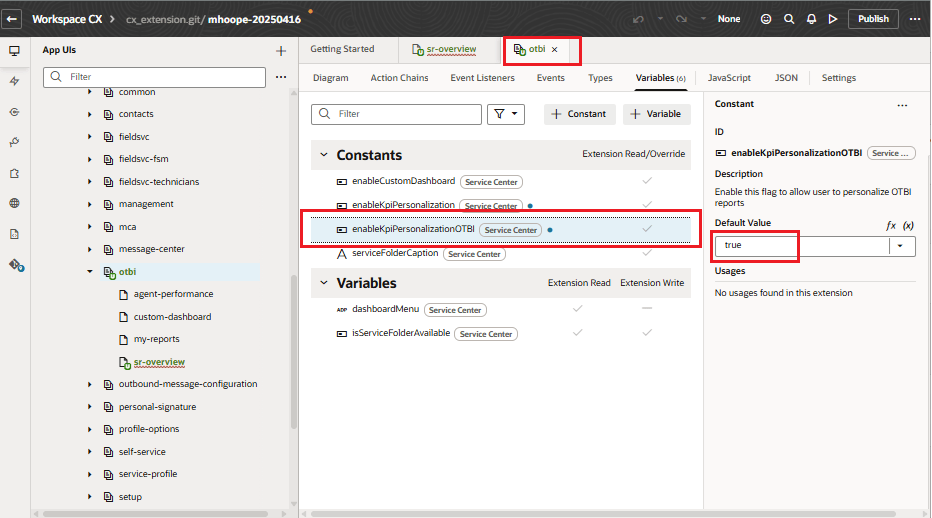
set enableKpiPersonalizationOTBI to true
Next, log in as a user with the necessary permissions to personalize the dashboard.
Navigate to Service --> Service Dashboard --> Service Overview, and click the Edit Page Layout button.
Note: If the button is not visible, either the enableKpiPersonalizationOTBI setting is still set to false or the user does not have the required permissions to personalize the page.
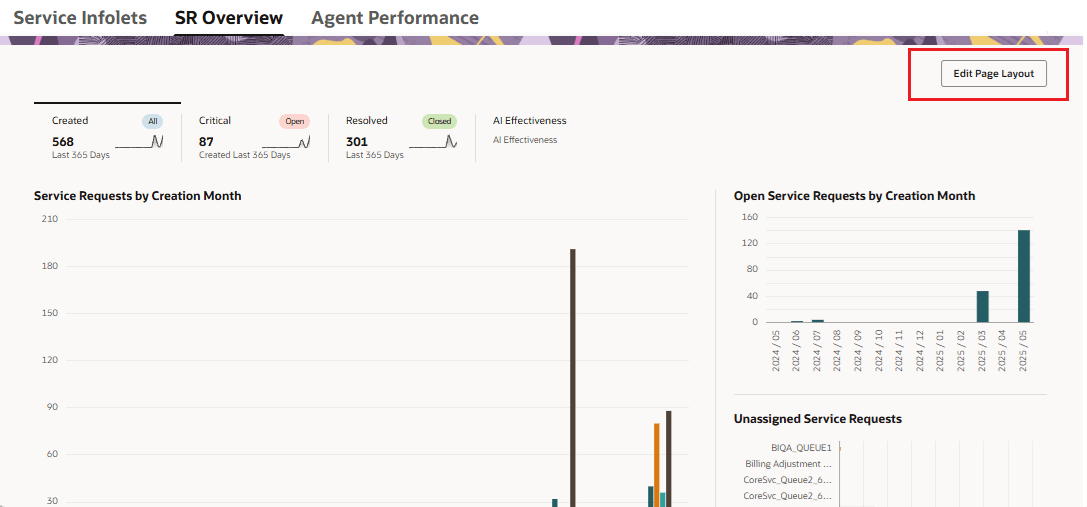
Click the Edit Page Layout button
When you click the Edit Page Layout button, the Content Library opens, displaying the list of root folders.
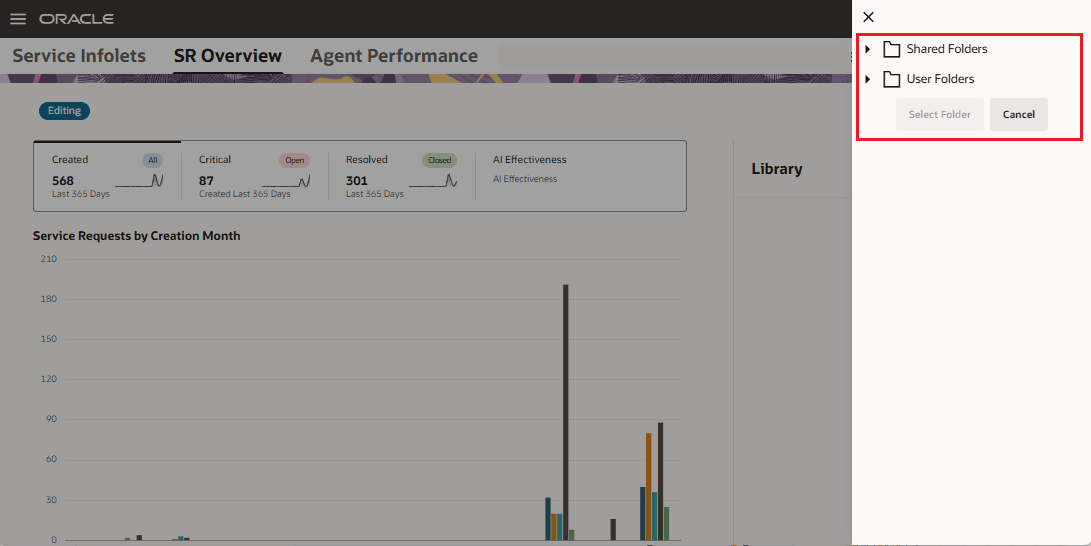
OTBI folder structure is displayed
Navigate through the folder structure to locate the folder containing the report(s) you want to add to your personalized layout.
For example, in the screenshot below, the ServiceCharts folder is selected by following the path:
Shared Folders --> Custom --> Dashboards --> Service --> ServiceCharts
Once you've selected the desired folder, click the Select Folder button.
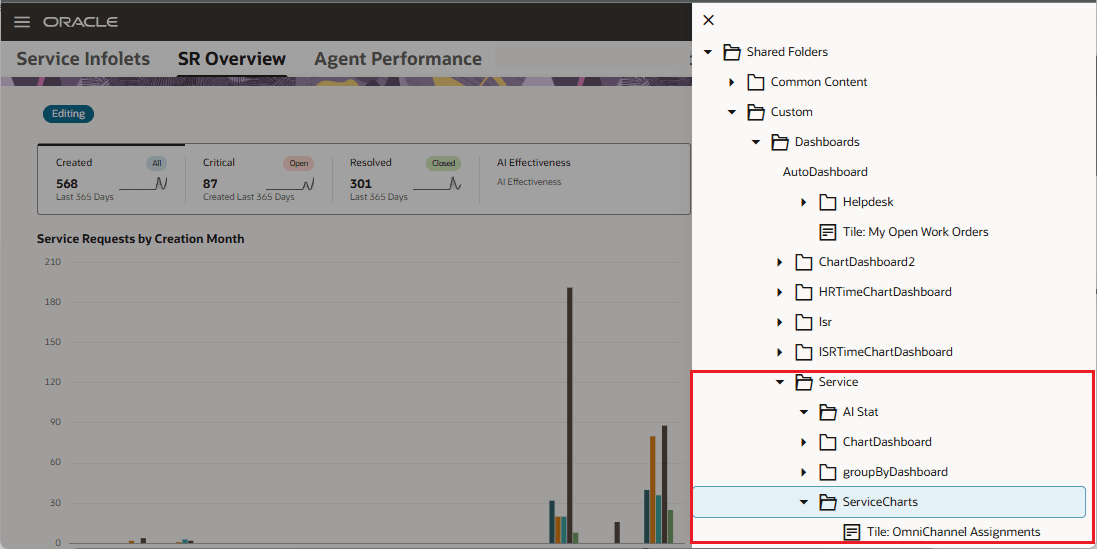
Select the folder
The Service Overview dashboard now appears in Edit mode. All reports from the selected folder are displayed and can be added to the dashboard layout.
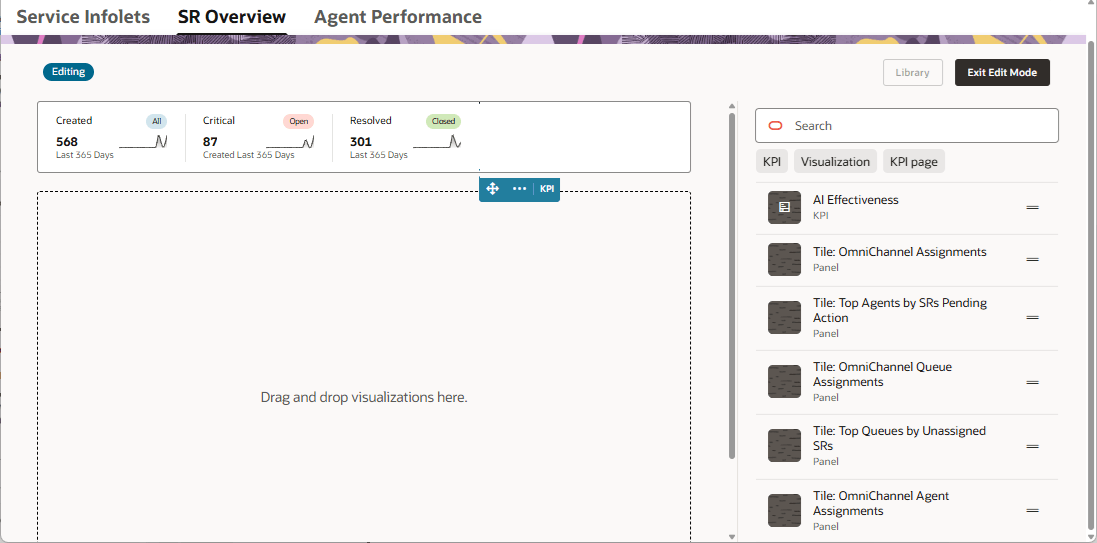
Reports from selected folder displayed
Now, drag and drop the desired reports onto the dashboard.
We recommend starting with one of the KPIs, as this will create a scorecard layout. You can then drag and drop additional reports beneath the scorecard, as illustrated below.
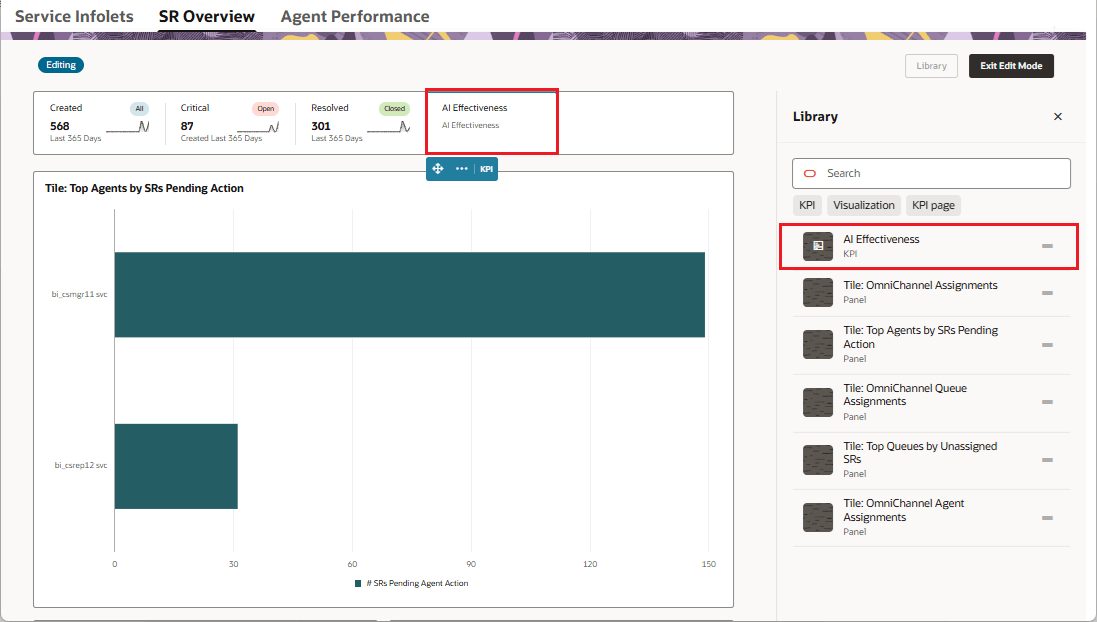
Reports added under a new scorecard
Once you’ve added the desired reports to the dashboard, click the Exit Edit Layout button. Your personalized Service Overview dashboard is now saved and accessible across browsers and devices.
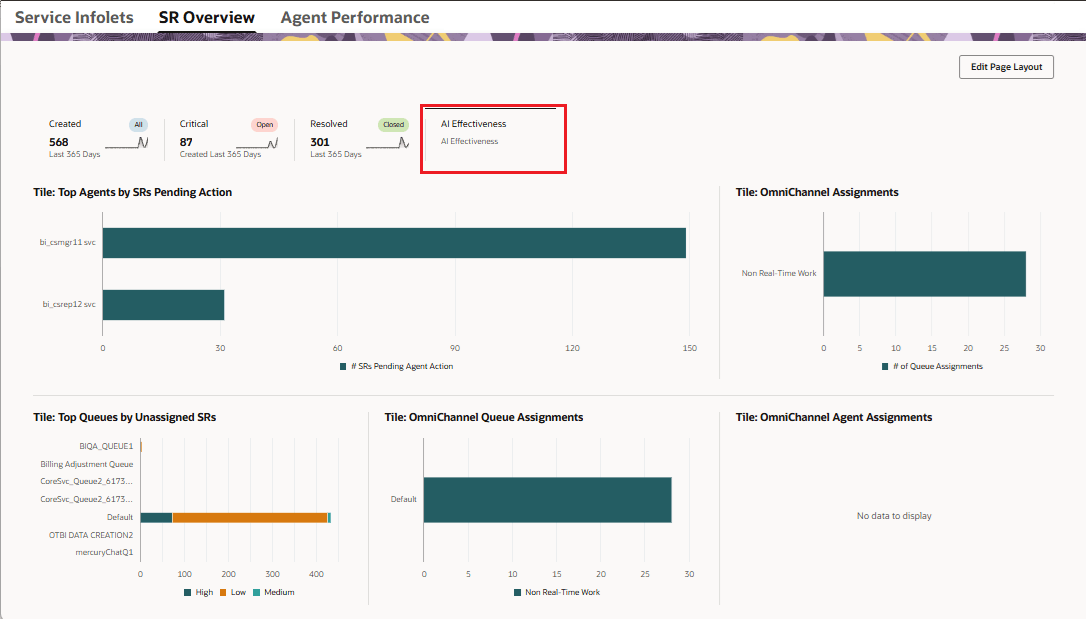
Personalized Service Overview dashboard