AI Usage, Effectiveness and Engagement Reports
A set of four reports that surface some key metrics related to usage, effectiveness and engagement of AI Agents.
The four reports are:
- AI Agent Invocations by Month
- Top AI Agents by Invocation Count (last 30 days)
- Top AI Agents by Engagement Rate (last 30 days)
- Engagement Breakdown by Month
These standard reports provide immediate visibility into AI adoption and effectiveness without requiring custom report development. Customers can track monthly trends, identify the most utilized and most engaging AI Agents, and monitor engagement patterns over time. This enables data driven decisions to optimize AI investments, improve agent performance, and maximize the business value of AI in service operations.
Steps to enable and configure
These AI related reports are based on the RODS data source. Ensure that RODS is enabled for the site before accessing these reports. Contact the system administrator to confirm availability if needed.
After confirming that RODS is enabled:
- Navigate to Service Dashboard > Agent Performance
- Click on Edit Page Layout
- Select RODS as the report data source
- Locate the four AI-related reports in the list
- Drag and drop the desired report or reports onto the dashboard layout
- Click on Exit Edit Mode
Tips and considerations
-
If the Edit Page Layout option is not visible, contact the system administrator to obtain the required privileges.
-
If RODS is enabled but does not appear as an available report data source, the global access flag for RODS based reports may not be enabled. Contact the system administrator to enable the flag.
Given below are more detailed steps on how to include the four AI-related reports on Agent Performance Dashboard.
First, ensure that personalization of the " Agent Performance " dashboard is enabled. By default, this feature is disabled and must be explicitly enabled by the administrator as explained below:
Login as a user with administrative privileges and navigate to Service --> Service Dashboard. Click on "Agent Performance" dashboard (tab).
Click on the user initials on the top right corner and select "Edit Page in Visual Builder Studio". Open the appropriate project.
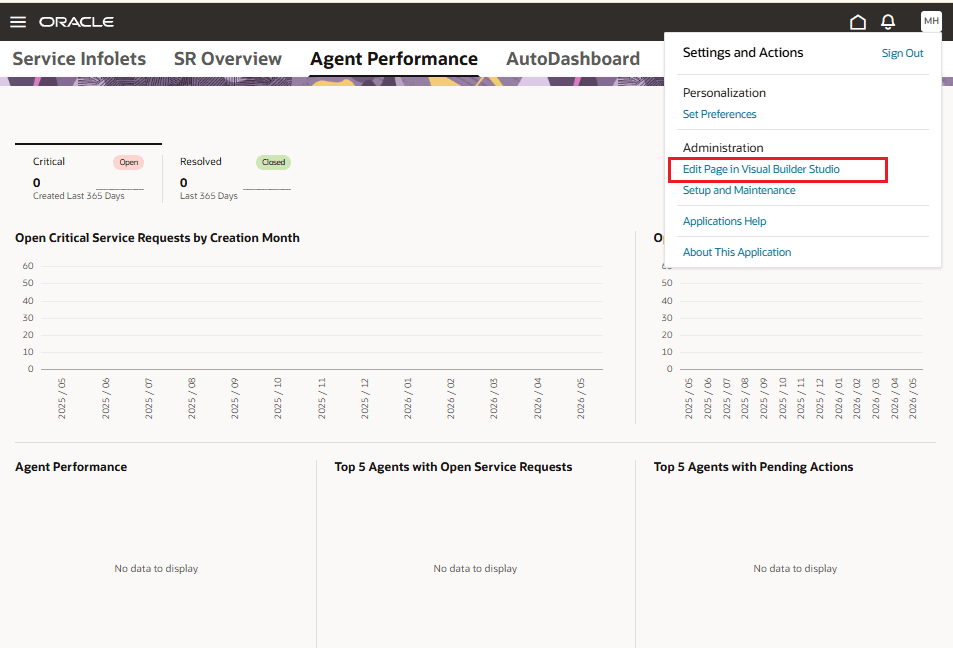
AP Dashboard Edit Page in Visual Studio
Locate "enableKpiPersonalization" and “enableKpiPersonalizationOTBI”under otbi and set their value to be "true". Publish your changes. This enables users with the relevant privileges to personalize their view of "Agent Performance" and include RODS-based reports and/or OTBI-based reports. Note: The AI Engagement Reports are RODS-based.
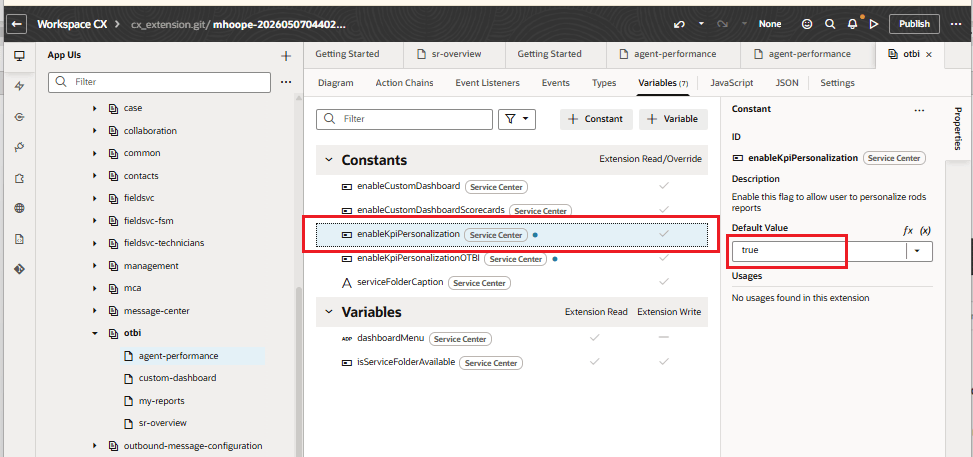
Set enableKpiPersonalization Flag
Next, login as a user with the requisite permissions to personalize the dashboard.
Navigate to Service --> Service Dashboard --> Agent Performance. Click on the "Edit Page Layout" button. Note: If the button is not visible, either enableKpiPersonalization (mentioned above) is set to "false" or the logged-in user lacks permission to personalize the page.
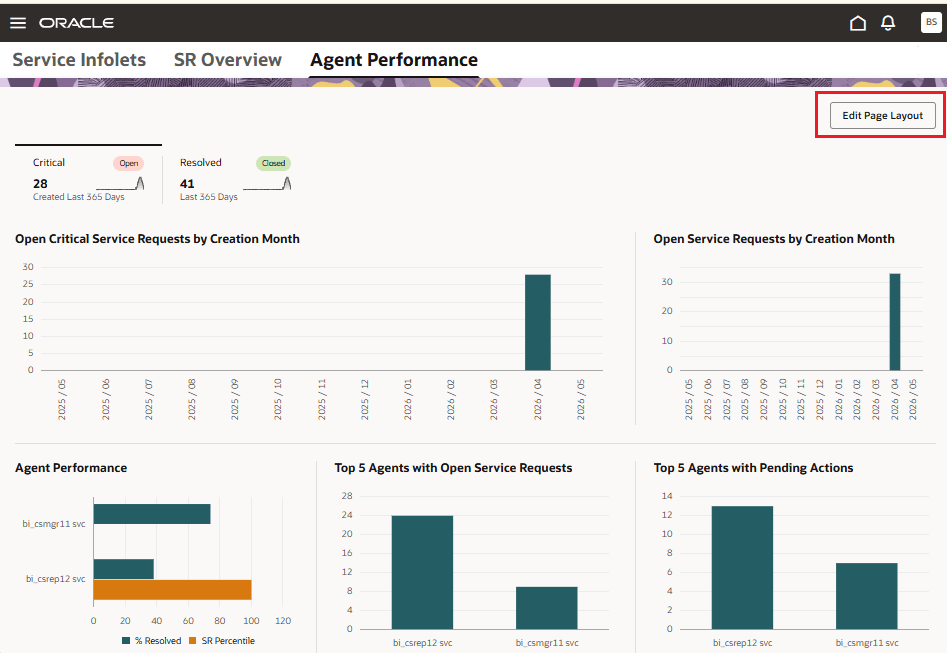
AP Dashboard with Edit Layout Button
Upon clicking the "Edit Page Layout" button, the "Select Reports Catalog" dropdown is displayed with “OTBI” and “RODS” as the available options. Select RODS.
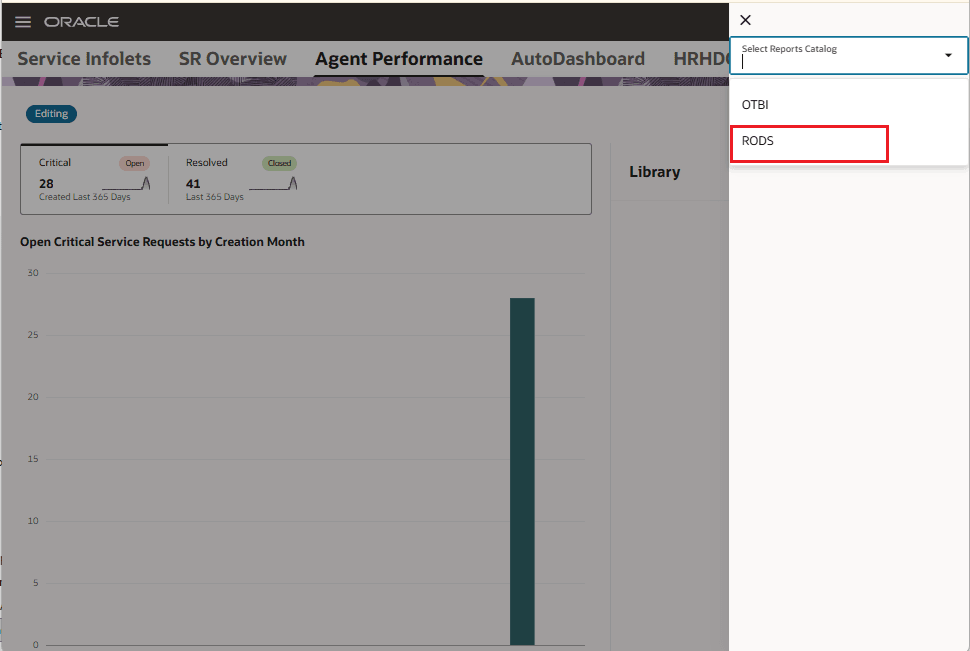
AP Dashboard Select RODS
The “Agent Performance” dashboard is displayed in Edit mode. Several reports related to AI Agents are listed and available for inclusion on the dashboard.
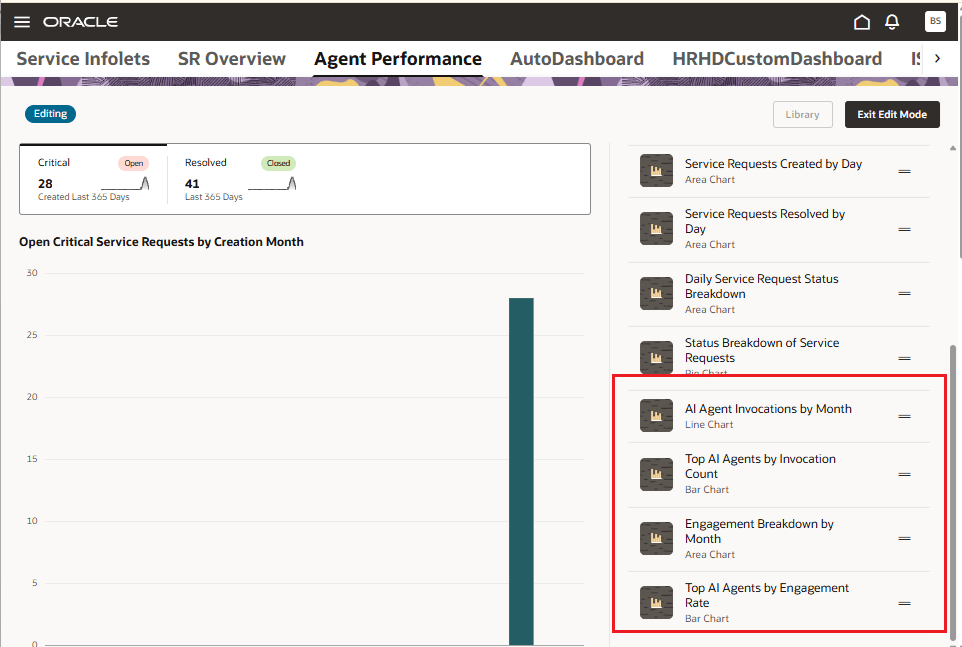
AP Dashboard AI Reports Displayed
Now, drag and drop the reports that you want on the dashboard. We recommend that you first drag-and-drop the one of the KPIs, as this creates a score card. You can then drag-and-drop the reports to be under this score card as shown below:
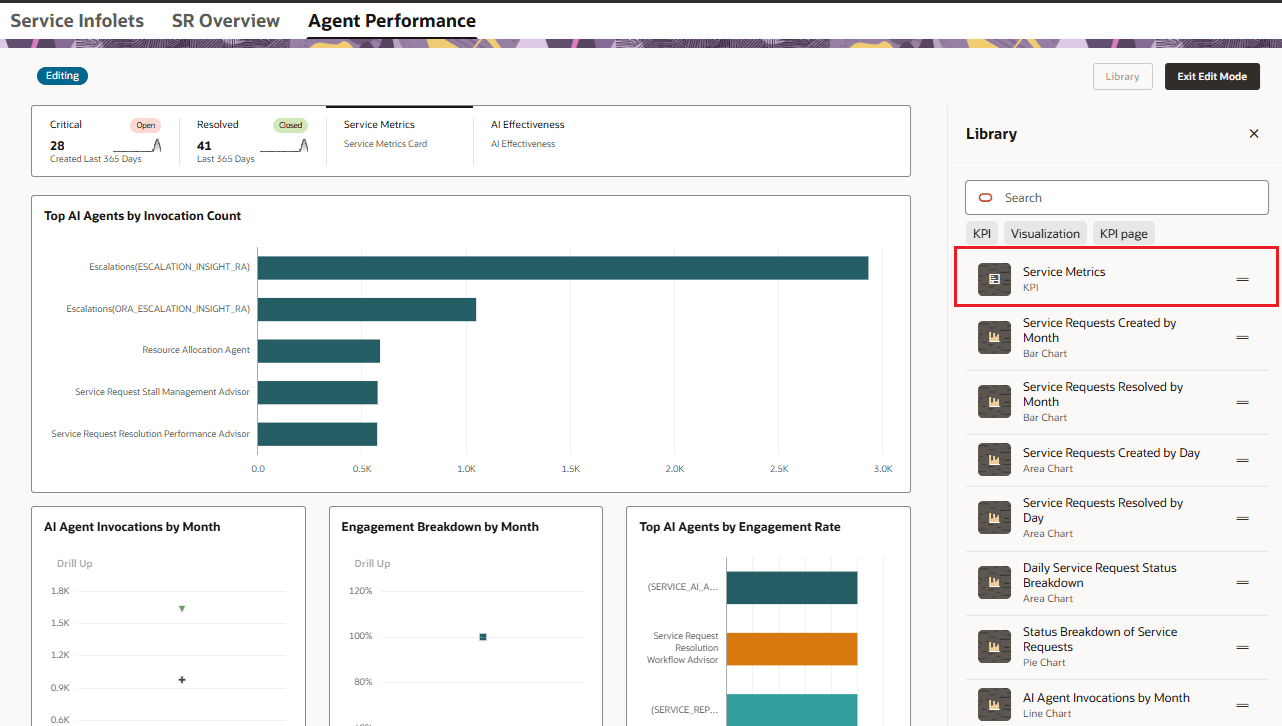
AP Dashboard Scorecard Selection
Click on the "Exit Edit Layout" button after you have copied across the required reports to the dashboard. Your personalized “Agent Performance” dashboard now becomes visible across browsers and devices.
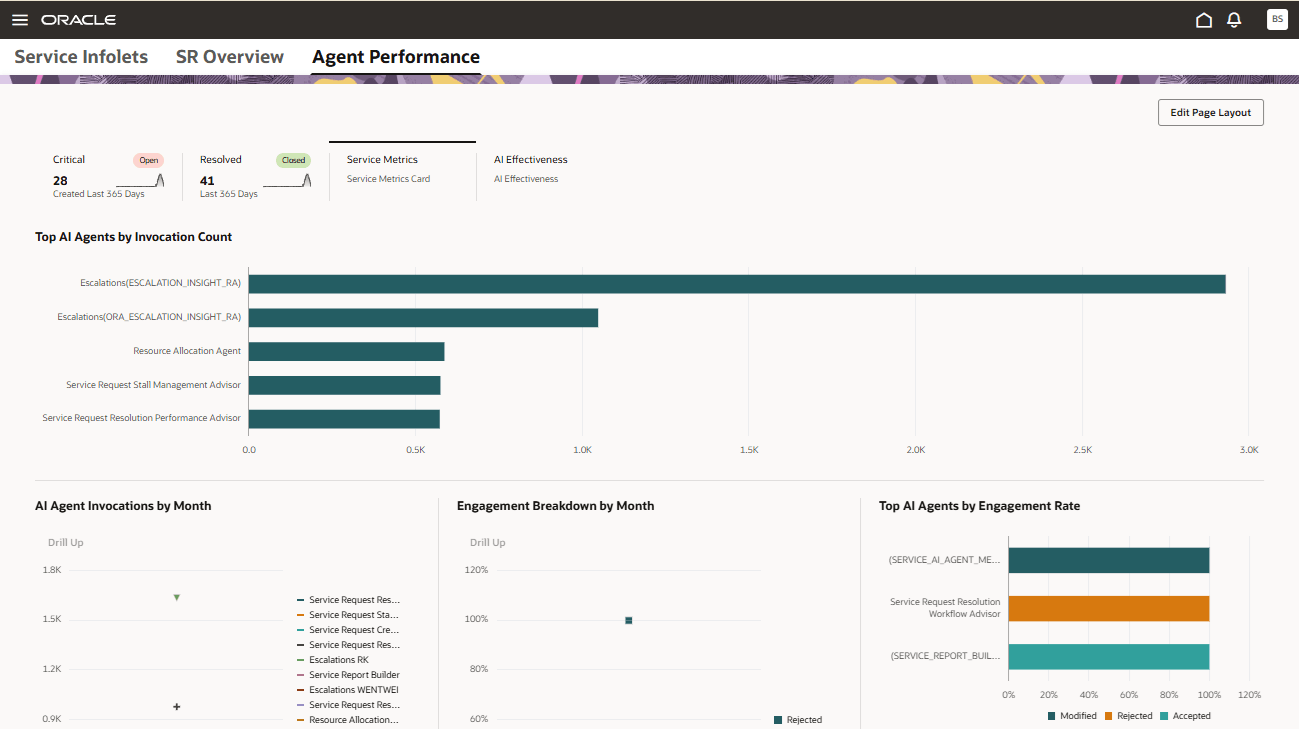
AP Dashboard with AI Engagement Reports