Peak Focused Home Energy Report
The Peak Focused Report is the most advanced version of the Home Energy Report yet available. It uses rate metadata, hourly disaggregation, and a new hourly normative comparison service based on smart meter data to produce new insights for customers. It includes a diverse set of modules designed to encourage customers to be aware of electricity costs, and guide them towards making energy use conscious behaviors during high-cost periods. There are two types of Peak Focused Reports:
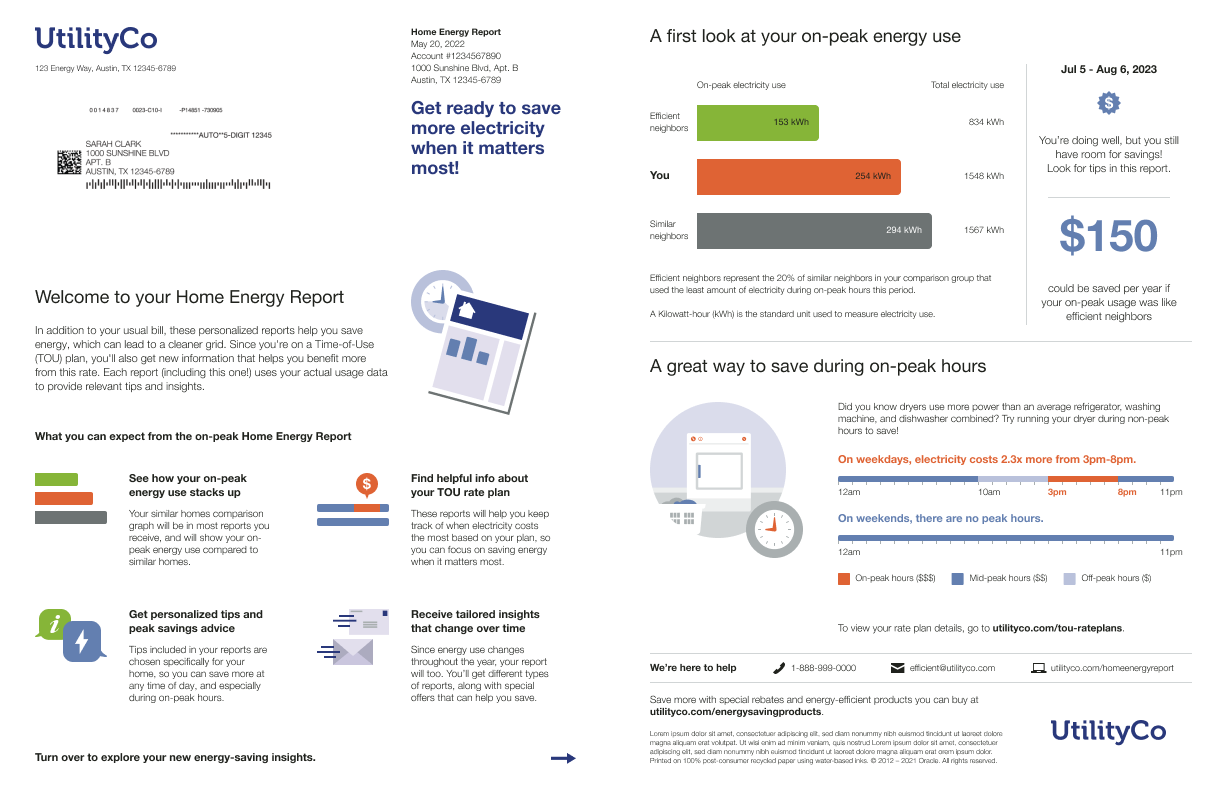
Peak Focused Welcome Report: The welcome version of the report is the first report sent to new customers, and is structured to facilitate positive behavior changes, equip customers with actionable tools and information, enhance overall customer satisfaction, and promote energy savings.
Peak Focused Welcome Report
The Peak Focus Reports Welcome Report include the following key features:
-
Introduction: The introduction module is a short welcome message encouraging the customer to get excited about their new report experience.
-
Welcome: Introduces customers to their new report experience and tells them that the report provides insights about your energy use, so that they can save more on their bill and make the most of their time of use plan. It includes a list of three features that explains how the report will help the customer save energy and lower their bill. The listed highlights include energy use insights, personalized ways to save, and timely, tailored advice.
-
Peak Focused Welcome Quadrant: The peak Focused welcome quadrant module appears under the customer address. It educates a new customers on the key features and benefits of the Peak Focused report experience with a focus on high-cost peak periods. The quadrant orients customers to the four parts of their report experience:
- Normative Comparison as a driver of energy efficiency savings.
- Tips as actions that the customer can take right away to reduce their energy use.
- Time of Use plan impact.
- Variable insights tells customers what to expect from the report program over time.
-
Peak Focus Normative Comparison: A three-bar graph that educates customers about their energy use relative to other homes. Total electricity usage values are included so the customer can have a better understanding of what their peak use is compared to their total use. Insights to the right of the graph provide information about why the bar chart appears the way it does, and provide the customer with feedback indicating potential savings or a percentage to enforce their performance in energy use. Optional iconography sets that match the state of the normative comparison can be configured to appear at the top of the module.
-
Time of Use 101: The Time of Use 101 module educates customers about the details of their time of use rate and offers educational insights into why saving energy during peak hours holds particular significance.
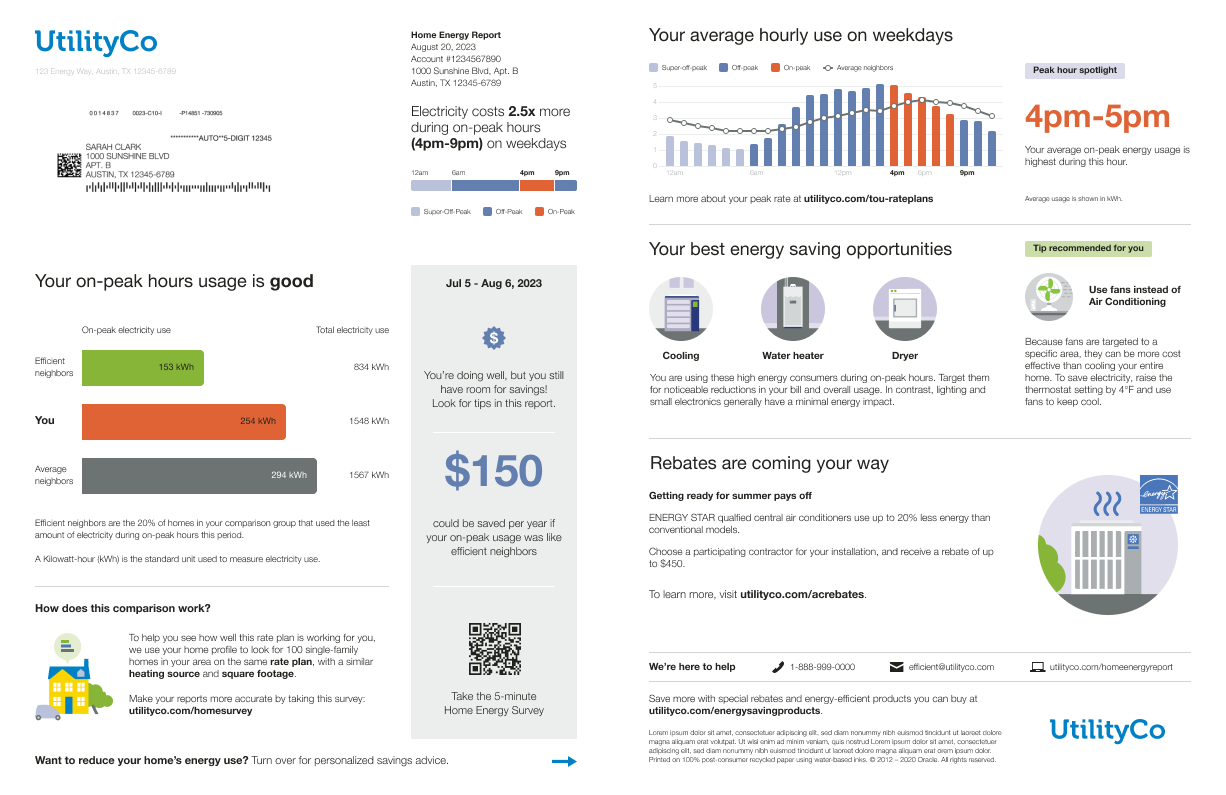
Peak Focused Progress Report: The progress version of the report includes insights designed to inform customers about their electricity usage, with a focus on peak periods under their Time of Use plan. It encourages more energy-efficient behaviors and heightened awareness of electricity costs.
The Peak Focus Reports Progress Report includes the following key features:
-
Mini Time of Use Reminder (Progress Report only): Reminds the customer when their highest cost or peak period occurs based on their Time of Use plan and what the cost multiplier will be during those periods. The module displays a timeline of the various cost periods for electricity during a weekday.
-
Peak Focus Normative Comparison: A three-bar graph that educates customers about their energy use relative to other homes. Total electricity usage values are included so the customer can have a better understanding of what their peak use is compared to their total use. Insights to the right of the graph provide information about why the bar chart appears the way it does, and provide the customer with feedback indicating potential savings or a percentage to enforce their performance in energy use. Optional iconography sets that match the state of the normative comparison can be configured to appear at the top of the module.
-
Time of Day Hourly Insights: Provides customers with insights into their hourly electricity consumption and how their energy use compares to their nearest comparison group. The graph helps the customer identify key times for energy savings by highlighting their average use during weekdays with a focus on the high-cost peak hours. It also includes the nearest comparison group’s average hourly usage for comparison, an insight that highlights in which high-cost period hour they are consuming the most energy, and a link where the customer can learn more about their Time of Day rate plan.
-
Energy Literacy and Tip: Educates customers about why they are consuming energy during the high-cost peak period, and provides guidance on what they can do to make a difference in their energy consumption. The module includes a list of two or three appliance categories that were detected during the high-cost period, and a tip related to one of the categories that the customer can use to help reduce their energy consumption.
The Peak Focused report allows utilities to educate customers about their electricity usage, with a focus on peak periods under their Time of Use (TOU) plan.
Steps to Enable
Contact your Service Delivery Manager to coordinate configuration of the module. To contact your Service Delivery Manager:
- Log in to Inside Opower (https://inside.opower.com). This is your portal for questions and information related to your program.
- Go to the Community tab and contact the Service Delivery Manager using the information provided.
Key Resources
- See the Peak Focused Reports for Print training.